Canada Information and Communications Technology Market Segmentation
Information and Communications Technology By Service Type (USD Million, 2025-2035)
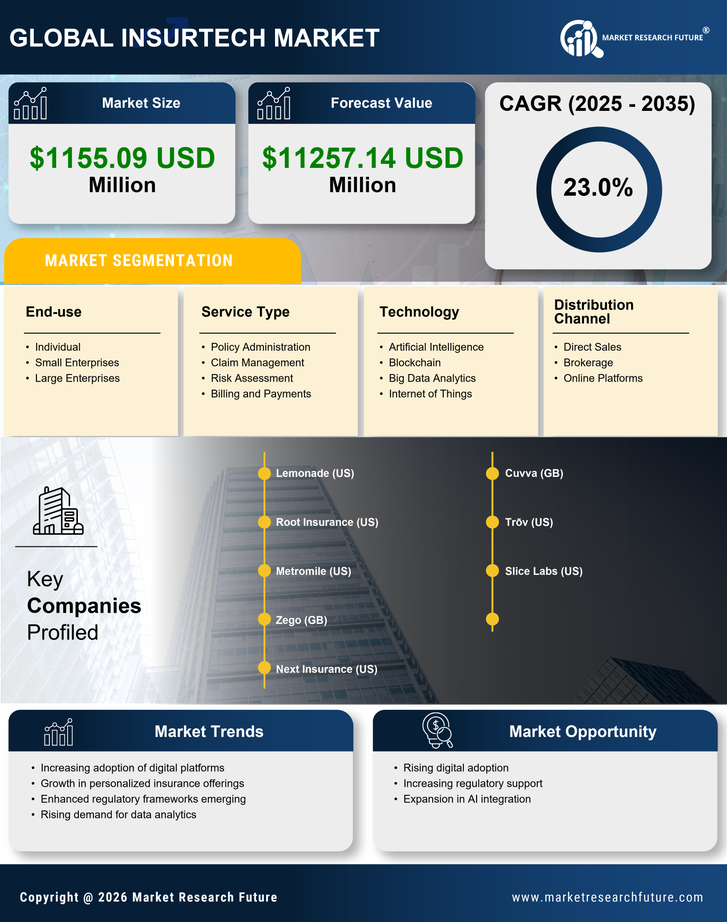
- Policy Administration
- Claim Management
- Risk Assessment
- Billing and Payments
Information and Communications Technology By Technology (USD Million, 2025-2035)
- Artificial Intelligence
- Blockchain
- Big Data Analytics
- Internet of Things
Information and Communications Technology By End-use (USD Million, 2025-2035)
- Individual
- Small Enterprises
- Large Enterprises
Information and Communications Technology By Distribution Channel (USD Million, 2025-2035)
- Direct Sales
- Brokerage
- Online Platforms