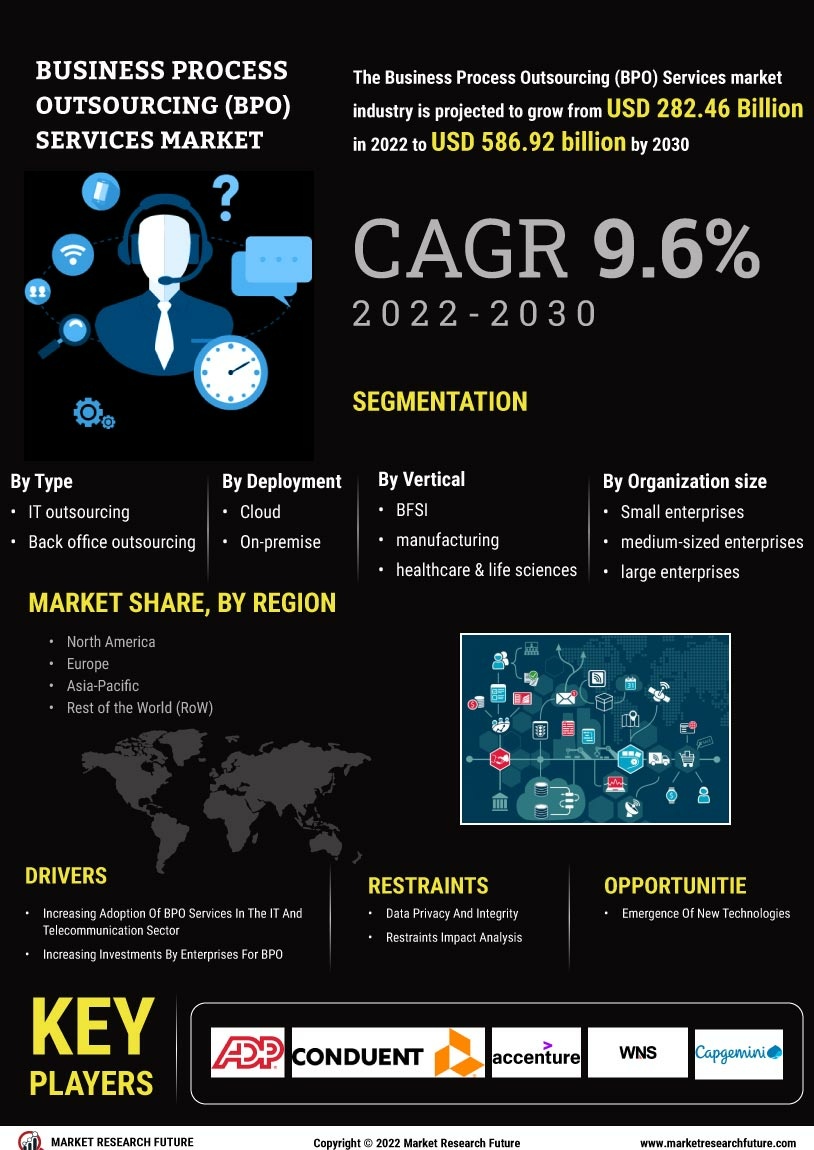
Certified Global Research Member
Isomar fd.webp Wcrc 57.webp
Key Questions Answered
  • Global Market Outlook
  • In-depth analysis of global and regional trends
  • Analyze and identify the major players in the market, their market share, key developments, etc.
  • To understand the capability of the major players based on products offered, financials, and strategies.
  • Identify disrupting products, companies, and trends.
  • To identify opportunities in the market.
  • Analyze the key challenges in the market.
  • Analyze the regional penetration of players, products, and services in the market.
  • Comparison of major players’ financial performance.
  • Evaluate strategies adopted by major players.
  • Recommendations
Why Choose Market Research Future?
  • Vigorous research methodologies for specific market.
  • Knowledge partners across the globe
  • Large network of partner consultants.
  • Ever-increasing/ Escalating data base with quarterly monitoring of various markets
  • Trusted by fortune 500 companies/startups/ universities/organizations
  • Large database of 5000+ markets reports.
  • Effective and prompt pre- and post-sales support.

Business Process Outsourcing (BPO) Services Market Research Report Information By Service Type (Finance and Accounting Outsourcing, Marketing & Sales Outsourcing, Customer Support Outsourcing, Training & Development Outsourcing, Human Resource and Recruitment Outsourcing, Document Management & Processing), Operating Model (Traditional (On-Premise), Business Process-as-a-Service (Cloud-Based)), Organization Size (SME’S and Large Enterprises), Vertical (BFSI, IT & Telecommunication, Retail & Consumer Goods, Manufacturing) - Forecast Till 2032


ID: MRFR/ICT/3040-CR | 140 Pages | Author: Ankit Gupta| January 2020

Research Methodology on Business Processing Outsourcing Services Market


Market Research Future (MRFR), has employed a comprehensive research methodology to assess the market dynamics of Business Process Outsourcing Services. This research methodology is based on primary and secondary data gathered from credible sources such as trade fairs, market reports, catalogues and magazine archives. This process enables a complete market research study with consistent results that is further validated by expert opinion and market feedback.


For a better assessment of the emerging opportunities in the Business Process Outsourcing services market, MRFR has followed a multi-disciplinary approach. This approach involves the following stages:


1. Identification of Target Market -


The first step includes the identification of the target market and its need for Business Process Outsourcing services in terms of products and services.


2. Market Analysis -


This step involves an in-depth study of the competitive landscape. This market analysis helps in understanding the competitive advantages and disadvantages of the leading players in the market. This analysis provides insights into the competitive strategies and tactics employed by the leading players to gain a competitive advantage.


3. Business Model Analysis -


The proposed business models of the leading players in the Business Process Outsourcing services market are assessed and compared. This analysis enables us to understand the business models of the leading players and provide a better analysis of the competitive landscape.


4. Market Drivers and Restraints -


The market drivers and restraints are identified and assessed. The market drivers include factors like demand for services, convenience, cost savings, and efficiency. The market restraints include regulations, infrastructure availability, and cost structure. All these factors are evaluated in order to provide a comprehensive assessment of the market.


5. Technology & Service Delivery -


Technology and service delivery are assessed in order to understand the current trends and technologies used in the market. This analysis enables us to get in-depth insights into the most preferred technologies used by the leading players.


6. Porter’s Five Forces Model -


Porter’s Five Forces Model is used to assess the competitive landscape and analyze the potential strategies the leading players could use to gain a competitive edge in the market. This analysis provides details such as the bargaining power of suppliers, the bargaining power of buyers, threats of new entrants, the threat of substitutes and the industry rivalry.


7. Market Forecast -


To gain insights into the future growth prospects of the industry, a market forecast is performed. This analysis includes factors such as current factors affecting the industry, market trends and opportunities, industry trends and developments, and macroeconomic conditions.


Overall, this comprehensive research methodology helps in providing an integrated approach to the study of the Business Process Outsourcing Services market. It helps in providing a clear and precise assessment of the market and enables the stakeholders to make effective decisions.

Leading companies partner with us for data-driven Insights
client_1 client_2 client_3 client_4 client_5 client_6 client_7 client_8 client_9 client_10
Please fill in Business Email for Quick Response

1 Executive Summary

1.1 Market Attractiveness Analysis

2 Market Introduction

2.1 Definition

2.2 Scope of the Study

2.3 Market Structure

3 Research Methodology

3.1 Research Process

3.2 Primary Research

3.3 Secondary Research

3.4 Market Size Estimation

3.5 Forecast Model

3.6 List of Assumptions

4 Market Insights

5 Market Dynamics

5.1 Introduction

5.2 Drivers

5.2.1 Increasing Adoption of BPO Services in the IT and Telecommunication Sector

5.2.2 Increasing Investments by Enterprises for BPO

5.2.3 Drivers Impact Analysis

5.3 Restraints

5.3.1 Data Privacy and Integrity

5.3.2 Restraints Impact Analysis

5.4 Opportunities

5.4.1 Emergence of New Technologies

5.5 Technological Trends

5.5.1 Cloud Computing Technology and BPaaS offering

5.5.2 Big data and Analytics

6 Market Factor Analysis

6.1 Value Chain Analysis

6.1.1 Technology & Software Providers

6.1.2 BPO Service Providers

6.1.3 End-Users

6.2 Porter’s Five Forces Model

6.2.1 Threat of New Entrants

6.2.2 Bargaining Power of Suppliers

6.2.3 Threat of Substitutes

6.2.4 Bargaining Power of Buyers

6.2.5 Competitive Rivalry

7 Global BPO Services Market, by Type

7.1 Overview

7.2 IT Outsourcing

7.3 Finance and Accounting Outsourcing

7.4 Back Office Outsourcing

7.5 E-Commerce Support Services

7.6 Training & Development Outsourcing

7.7 Training & Development Outsourcing

7.8 Others

8 Global BPO Services Market, by Deployment

8.1 Overview

8.2 Cloud

8.3 On-Premise

9 Global BPO Services Market, by Organization Size

9.1 Overview

9.2 Small- and Medium-Sized Enterprises

9.3 Large Enterprises

10 Global BPO Services Market, by Vertical

10.1 Overview

10.2 Banking, Financial Services and Insurance (BFSI)

10.3 IT and Telecommunications

10.4 Retail and Consumer Goods

10.5 Manufacturing

10.6 Healthcare and Life Sciences

10.7 Government and Defense

10.8 Others

11 Global BPO Services Market, by Region

11.1 Overview

11.2 North America

11.2.1 US

11.2.2 Canada

11.2.3 Mexico

11.3 Asia-Pacific

11.3.1 China

11.3.2 Japan

11.3.3 India

11.3.4 Rest of Asia-Pacific

11.4 Europe

11.4.1 Germany

11.4.2 UK

11.4.3 France

11.4.4 Rest of Europe

11.5 Middle East and Africa

11.6 South America

12 Competitive Landscape

12.1 Competitive Overview

12.2 Major Growth Strategy in the Global BPO Services Market

12.3 Competitive Benchmarking

12.4 Dashboard: The Leading Players in Global Business Process Outsourcing (BPO) Services Market

12.5 Key Developments & Growth Strategies

12.5.1 New Product Launch/Service Deployment

12.5.2 Merger & Acquisition

13 Company Profile

13.1 ADP, LLC

13.1.1 Company Overview

13.1.2 Financial Overview

13.1.3 Products/Services/Solutions Offered

13.1.4 Key Developments

13.1.5 SWOT Analysis

13.1.6 Key Strategies

13.2 Conduent Inc.

13.2.1 Company Overview

13.2.2 Financial Overview

13.2.3 Products/Services/Solutions Offered

13.2.4 Key Developments

13.2.5 SWOT Analysis

13.2.6 Key Strategies

13.3 Accenture PLC

13.3.1 Company Overview

13.3.2 Financial Overview

13.3.3 Products/Services/Solutions Offered

13.3.4 Key Developments

13.3.5 SWOT Analysis

13.3.6 Key Strategies

13.4 WNS (Holdings) Ltd

13.4.1 Company Overview

13.4.2 Financial Overview

13.4.3 Products/Services/Solutions Offered

13.4.4 Key Developments

13.4.5 SWOT Analysis

13.4.6 Key Strategies

13.5 Capgemini

13.5.1 Company Overview

13.5.2 Financial Overview

13.5.3 Products/Services/Solutions Offered

13.5.4 Key Developments

13.5.5 SWOT Analysis

13.5.6 Key Strategies

13.6 Infosys BPM Limited

13.6.1 Company Overview

13.6.2 Financial Overview

13.6.3 Products/Services/Solutions Offered

13.6.4 Key Developments

13.6.5 SWOT Analysis

13.6.6 Key Strategies

13.7 IBM Corporation

13.7.1 Company Overview

13.7.2 Financial Overview

13.7.3 Products/Services/Solutions Offered

13.7.4 Key Developments

13.7.5 SWOT Analysis

13.7.6 Key Strategies

13.8 Tata Consultancy Services Limited

13.8.1 Company Overview

13.8.2 Financial Overview

13.8.3 Products/Services/Solutions Offered

13.8.4 Key Developments

13.8.5 SWOT Analysis

13.8.6 Key Strategies

13.9 TTEC Holdings, Inc.

13.9.1 Company Overview

13.9.2 Financial Overview

13.9.3 Products/Services/Solutions Offered

13.9.4 Key Developments

13.9.5 SWOT Analysis

13.9.6 Key Strategies

13.10 Conneqt Business Solution Limited

13.10.1 Company Overview

13.10.2 Financial Overview

13.10.3 Products/Services/Solutions Offered

13.10.4 Key Developments

13.10.5 SWOT Analysis

13.11 Aegis

13.11.1 Company Overview

13.11.2 Financial Overview

13.11.3 Products/Services/Solutions Offered

13.11.4 Key Developments

13.11.5 Key Strategies

13.12 Tech Mahindra Limited

13.12.1 Company Overview

13.12.2 Financial Overview

13.12.3 Products/Services/Solutions Offered

13.12.4 Key Developments

13.12.5 SWOT Analysis

13.12.6 Key Strategies

13.13 HCL Technologies Limited

13.13.1 Company Overview

13.13.2 Financial Overview

13.13.3 Products/Services/Solutions Offered

13.13.4 Key Developments

13.13.5 SWOT Analysis

13.13.6 Key Strategies

13.14 eNoah

13.14.1 Company Overview

13.14.2 Products/Services/Solutions Offered

13.14.3 Key Developments

13.14.4 Key Strategies

13.15 Genpact

13.15.1 Company Overview

13.15.2 Financial Overview

13.15.3 Products/Services/Solutions Offered

13.15.4 Key Developments

13.15.5 SWOT Analysis

13.15.6 Key Strategies

14 List of Tables

TABLE 1 LIST OF ASSUMPTIONS

TABLE 2 GLOBAL BPO SERVICES MARKET, BY TYPE, 2020–2027 (USD BILLION)

TABLE 3 GLOBAL BPO SERVICES MARKET, BY DEPLOYMENT, 2020–2027 (USD BILLION)

TABLE 4 GLOBAL BPO SERVICES MARKET, BY ORGANIZATION SIZE, 2020–2027 (USD BILLION)

TABLE 5 GLOBAL BPO SERVICES MARKET, BY VERTICAL, 2020–2027 (USD BILLION)

TABLE 6 GLOBAL BPO SERVICES MARKET, BY REGION, 2020–2027 (USD BILLION)

TABLE 7 NORTH AMERICA: BPO SERVICES MARKET, BY COUNTRY, 2020–2027 (USD BILLION)

TABLE 8 NORTH AMERICA: BPO SERVICES MARKET, BY TYPE, 2020–2027 (USD BILLION)

TABLE 9 NORTH AMERICA: BPO SERVICES MARKET, BY DEPLOYMENT, 2020–2027 (USD BILLION)

TABLE 10 NORTH AMERICA: BPO SERVICES MARKET, BY ORGANIZATION SIZE, 2020–2027 (USD BILLION)

TABLE 11 NORTH AMERICA: BPO SERVICES MARKET, BY VERTICAL, 2020–2027 (USD BILLION)

TABLE 12 US: BPO SERVICES MARKET, BY TYPE, 2020–2027 (USD BILLION)

TABLE 13 US: BPO SERVICES MARKET, BY DEPLOYMENT, 2020–2027 (USD BILLION)

TABLE 14 US: BPO SERVICES MARKET, BY ORGANIZATION SIZE, 2020–2027 (USD BILLION)

TABLE 15 US: BPO SERVICES MARKET, BY VERTICAL, 2020–2027 (USD BILLION)

TABLE 16 CANADA: BPO SERVICES MARKET, BY TYPE, 2020–2027 (USD BILLION)

TABLE 17 CANADA: BPO SERVICES MARKET, BY DEPLOYMENT, 2020–2027 (USD BILLION)

TABLE 18 CANADA: BPO SERVICES MARKET, BY ORGANIZATION SIZE, 2020–2027 (USD BILLION)

TABLE 19 CANADA: BPO SERVICES MARKET, BY VERTICAL, 2020–2027 (USD BILLION)

TABLE 20 MEXICO: BPO SERVICES MARKET, BY TYPE, 2020–2027 (USD BILLION)

TABLE 21 MEXICO: BPO SERVICES MARKET, BY DEPLOYMENT, 2020–2027 (USD BILLION)

TABLE 22 MEXICO: BPO SERVICES MARKET, BY ORGANIZATION SIZE, 2020–2027 (USD BILLION)

TABLE 23 MEXICO: BPO SERVICES MARKET, BY VERTICAL, 2020–2027 (USD BILLION)

TABLE 24 ASIA-PACIFIC: BPO SERVICES MARKET, BY COUNTRY, 2020–2027 (USD BILLION)

TABLE 25 ASIA-PACIFIC: BPO SERVICES MARKET, BY TYPE, 2020–2027 (USD BILLION)

TABLE 26 ASIA-PACIFIC: BPO SERVICES MARKET, BY DEPLOYMENT, 2020–2027 (USD BILLION)

TABLE 27 ASIA-PACIFIC: BPO SERVICES MARKET, BY ORGANIZATION SIZE, 2020–2027 (USD BILLION)

TABLE 28 ASIA-PACIFIC: BPO SERVICES MARKET, BY VERTICAL, 2020–2027 (USD BILLION)

TABLE 29 CHINA: BPO SERVICES MARKET, BY TYPE, 2020–2027 (USD BILLION)

TABLE 30 CHINA: BPO SERVICES MARKET, BY DEPLOYMENT, 2020–2027 (USD BILLION)

TABLE 31 CHINA: BPO SERVICES MARKET, BY ORGANIZATION SIZE, 2020–2027 (USD BILLION)

TABLE 32 CHINA: BPO SERVICES MARKET, BY VERTICAL, 2020–2027 (USD BILLION)

TABLE 33 JAPAN: BPO SERVICES MARKET, BY TYPE, 2020–2027 (USD BILLION)

TABLE 34 JAPAN: BPO SERVICES MARKET, BY DEPLOYMENT, 2020–2027 (USD BILLION)

TABLE 35 JAPAN: BPO SERVICES MARKET, BY ORGANIZATION SIZE, 2020–2027 (USD BILLION)

TABLE 36 JAPAN: BPO SERVICES MARKET, BY VERTICAL, 2020–2027 (USD BILLION)

TABLE 37 INDIA: BPO SERVICES MARKET, BY TYPE, 2020–2027 (USD BILLION)

TABLE 38 INDIA: BPO SERVICES MARKET, BY DEPLOYMENT, 2020–2027 (USD BILLION)

TABLE 39 INDIA: BPO SERVICES MARKET, BY ORGANIZATION SIZE, 2020–2027 (USD BILLION)

TABLE 40 INDIA: BPO SERVICES MARKET, BY VERTICAL, 2020–2027 (USD BILLION)

TABLE 41 REST OF ASIA-PACIFIC: BPO SERVICES MARKET, BY TYPE, 2020–2027 (USD BILLION)

TABLE 42 REST OF ASIA-PACIFIC: BPO SERVICES MARKET, BY DEPLOYMENT, 2020–2027 (USD BILLION)

TABLE 43 REST OF ASIA-PACIFIC: BPO SERVICES MARKET, BY ORGANIZATION SIZE, 2020–2027 (USD BILLION)

TABLE 44 REST OF ASIA-PACIFIC: BPO SERVICES MARKET, BY VERTICAL, 2020–2027 (USD BILLION)

TABLE 45 EUROPE: BPO SERVICES MARKET, BY COUNTRY, 2020–2027 (USD BILLION)

TABLE 46 EUROPE: BPO SERVICES MARKET, BY TYPE, 2020–2027 (USD BILLION)

TABLE 47 EUROPE: BPO SERVICES MARKET, BY DEPLOYMENT, 2020–2027 (USD BILLION)

TABLE 48 EUROPE: BPO SERVICES MARKET, BY ORGANIZATION SIZE, 2020–2027 (USD BILLION)

TABLE 49 EUROPE: BPO SERVICES MARKET, BY VERTICAL, 2020–2027 (USD BILLION)

TABLE 50 GERMANY: BPO SERVICES MARKET, BY TYPE, 2020–2027 (USD BILLION)

TABLE 51 GERMANY: BPO SERVICES MARKET, BY DEPLOYMENT, 2020–2027 (USD BILLION)

TABLE 52 GERMANY: BPO SERVICES MARKET, BY ORGANIZATION SIZE, 2020–2027 (USD BILLION)

TABLE 53 GERMANY: BPO SERVICES MARKET, BY VERTICAL, 2020–2027 (USD BILLION)

TABLE 54 UK: BPO SERVICES MARKET, BY TYPE, 2020–2027 (USD BILLION)

TABLE 55 UK: BPO SERVICES MARKET, BY DEPLOYMENT, 2020–2027 (USD BILLION)

TABLE 56 UK: BPO SERVICES MARKET, BY ORGANIZATION SIZE, 2020–2027 (USD BILLION)

TABLE 57 UK: BPO SERVICES MARKET, BY VERTICAL, 2020–2027 (USD BILLION)

TABLE 58 FRANCE: BPO SERVICES MARKET, BY TYPE, 2020–2027 (USD BILLION)

TABLE 59 FRANCE: BPO SERVICES MARKET, BY DEPLOYMENT, 2020–2027 (USD BILLION)

TABLE 60 FRANCE: BPO SERVICES MARKET, BY ORGANIZATION SIZE, 2020–2027 (USD BILLION)

TABLE 61 FRANCE: BPO SERVICES MARKET, BY VERTICAL, 2020–2027 (USD BILLION)

TABLE 62 REST OF EUROPE: BPO SERVICES MARKET, BY TYPE, 2020–2027 (USD BILLION)

TABLE 63 REST OF EUROPE: BPO SERVICES MARKET, BY DEPLOYMENT, 2020–2027 (USD BILLION)

TABLE 64 REST OF EUROPE: BPO SERVICES MARKET, BY ORGANIZATION SIZE, 2020–2027 (USD BILLION)

TABLE 65 REST OF EUROPE: BPO SERVICES MARKET, BY VERTICAL, 2020–2027 (USD BILLION)

TABLE 66 MIDDLE EAST AND AFRICA: BPO SERVICES MARKET, BY TYPE, 2020–2027 (USD BILLION)

TABLE 67 MIDDLE EAST AND AFRICA: BPO SERVICES MARKET, BY DEPLOYMENT, 2020–2027 (USD BILLION)

TABLE 68 MIDDLE EAST AND AFRICA: BPO SERVICES MARKET, BY ORGANIZATION SIZE, 2020–2027 (USD BILLION)

TABLE 69 MIDDLE EAST AND AFRICA: BPO SERVICES MARKET, BY VERTICAL, 2020–2027 (USD BILLION)

TABLE 70 SOUTH AMERICA: BPO SERVICES MARKET, BY TYPE, 2020–2027 (USD BILLION)

TABLE 71 SOUTH AMERICA: BPO SERVICES MARKET, BY DEPLOYMENT, 2020–2027 (USD BILLION)

TABLE 72 SOUTH AMERICA: BPO SERVICES MARKET, BY ORGANIZATION SIZE, 2020–2027 (USD BILLION)

TABLE 73 SOUTH AMERICA: BPO SERVICES MARKET, BY VERTICAL, 2020–2027 (USD BILLION)

TABLE 74 DASHBOARD: THE MOST ACTIVE PLAYER IN THE GLOBAL BUSINESS PROCESS OUTSOURCING (BPO) SERVICES MARKET

TABLE 75 NEW PRODUCT LAUNCH/SERVICE DEPLOYMENT 108

TABLE 76 MERGER & ACQUISITION

15 List of Figures

FIGURE 1 MARKET SYNOPSIS

FIGURE 2 MARKET ATTRACTIVENESS ANALYSIS: GLOBAL BUSINESS PROCESS OUTSOURCING SERVICE MARKET

FIGURE 3 GLOBAL BPO SERVICES MARKET: MARKET STRUCTURE

FIGURE 4 RESEARCH PROCESS OF MRFR

FIGURE 5 TOP DOWN & BOTTOM UP APPROACH

FIGURE 6 GLOBAL MARKET SIZE & MARKET SHARE BY REGION (2020 VS 2027)

FIGURE 7 NORTH AMERICA MARKET SIZE & MARKET SHARE BY COUNTRY (2020 VS 2027)

FIGURE 8 ASIA-PACIFIC MARKET SIZE & MARKET SHARE BY COUNTRY (2020 VS 2027)

FIGURE 9 EUROPE MARKET SIZE & MARKET SHARE BY COUNTRY (2020 VS 2027)

FIGURE 10 DRO ANALYSIS OF GLOBAL BPO SERVICES MARKET

FIGURE 11 NUMBER OF BPO DEALS FROM 2013-2017

FIGURE 12 DRIVERS IMPACT ANALYSIS: BPO SERVICES MARKET

FIGURE 13 RESTRAINTS IMPACT ANALYSIS: BPO SERVICES MARKET

FIGURE 14 VALUE CHAIN: GLOBAL BPO SERVICES MARKET

FIGURE 15 PORTER'S FIVE FORCES ANALYSIS OF THE GLOBAL BPO SERVICES MARKET

FIGURE 16 GLOBAL BPO SERVICES MARKET, BY TYPE, 2020–2027 (USD BILLION)

FIGURE 17 GLOBAL BPO SERVICES MARKET, BY DEPLOYMENT, 2020–2027 (USD BILLION)

FIGURE 18 GLOBAL BPO SERVICES MARKET, BY ORGANIZATION SIZE, 2020–2027 (USD BILLION)

FIGURE 19 GLOBAL BPO SERVICES MARKET, BY VERTICAL, 2020–2027 (USD BILLION)

FIGURE 20 GLOBAL BPO SERVICES MARKET, BY REGION, 2020–2027 (USD BILLION)

FIGURE 21 NORTH AMERICA: BPO SERVICES MARKET, BY COUNTRY, 2020–2027 (USD BILLION)

FIGURE 22 NORTH AMERICA: BPO SERVICES MARKET, BY TYPE, 2020–2027 (USD BILLION)

FIGURE 23 NORTH AMERICA: BPO SERVICES MARKET, BY DEPLOYMENT, 2020–2027 (USD BILLION)

FIGURE 24 NORTH AMERICA: BPO SERVICES MARKET, BY ORGANIZATION SIZE, 2020–2027 (USD BILLION)

FIGURE 25 NORTH AMERICA: BPO SERVICES MARKET, BY VERTICAL, 2020–2027 (USD BILLION)

FIGURE 26 ASIA-PACIFIC: BPO SERVICES MARKET, BY COUNTRY, 2020–2027 (USD BILLION)

FIGURE 27 ASIA-PACIFIC: BPO SERVICES MARKET, BY TYPE, 2020–2027 (USD BILLION)

FIGURE 28 ASIA-PACIFIC: BPO SERVICES MARKET, BY DEPLOYMENT, 2020–2027 (USD BILLION)

FIGURE 29 ASIA-PACIFIC: BPO SERVICES MARKET, BY ORGANIZATION SIZE, 2020–2027 (USD BILLION)

FIGURE 30 ASIA-PACIFIC: BPO SERVICES MARKET, BY VERTICAL, 2020–2027 (USD BILLION)

FIGURE 31 EUROPE: BPO SERVICES MARKET, BY COUNTRY, 2020–2027 (USD BILLION)

FIGURE 32 EUROPE: BPO SERVICES MARKET, BY TYPE, 2020–2027 (USD BILLION)

FIGURE 33 EUROPE: BPO SERVICES MARKET, BY DEPLOYMENT, 2020–2027 (USD BILLION)

FIGURE 34 EUROPE: BPO SERVICES MARKET, BY ORGANIZATION SIZE, 2020–2027 (USD BILLION)

FIGURE 35 EUROPE: BPO SERVICES MARKET, BY VERTICAL, 2020–2027 (USD BILLION)

FIGURE 36 MIDDLE EAST AND AFRICA: BPO SERVICES MARKET, BY TYPE, 2020–2027 (USD BILLION)

FIGURE 37 MIDDLE EAST AND AFRICA: BPO SERVICES MARKET, BY DEPLOYMENT, 2020–2027 (USD BILLION)

FIGURE 38 MIDDLE EAST AND AFRICA: BPO SERVICES MARKET, BY ORGANIZATION SIZE, 2020–2027 (USD BILLION)

FIGURE 39 MIDDLE EAST AND AFRICA: BPO SERVICES MARKET, BY VERTICAL, 2020–2027 (USD BILLION)

FIGURE 40 SOUTH AMERICA: BPO SERVICES MARKET, BY TYPE, 2020–2027 (USD BILLION)

FIGURE 41 SOUTH AMERICA: BPO SERVICES MARKET, BY DEPLOYMENT, 2020–2027 (USD BILLION)

FIGURE 42 SOUTH AMERICA: BPO SERVICES MARKET, BY ORGANIZATION SIZE, 2020–2027 (USD BILLION)

FIGURE 43 SOUTH AMERICA: BPO SERVICES MARKET, BY VERTICAL, 2020–2027 (USD BILLION)

FIGURE 44 CONTRACTS & AGREEMENTS: THE MAJOR STRATEGY ADOPTED BY KEY PLAYERS IN THE GLOBAL BPO SERVICES MARKET

FIGURE 45 BENCHMARKING OF MAJOR COMPETITORS

Purchase Option
Single User $ 4,950
Multiuser License $ 5,950
Enterprise User $ 7,250
Compare Licenses
Tailored for You
  • Dedicated Research on any specifics segment or region.
  • Focused Research on specific players in the market.
  • Custom Report based only on your requirements.
  • Flexibility to add or subtract any chapter in the study.
  • Historic data from 2014 and forecasts outlook till 2040.
  • Flexibility of providing data/insights in formats (PDF, PPT, Excel).
  • Provide cross segmentation in applicable scenario/markets.