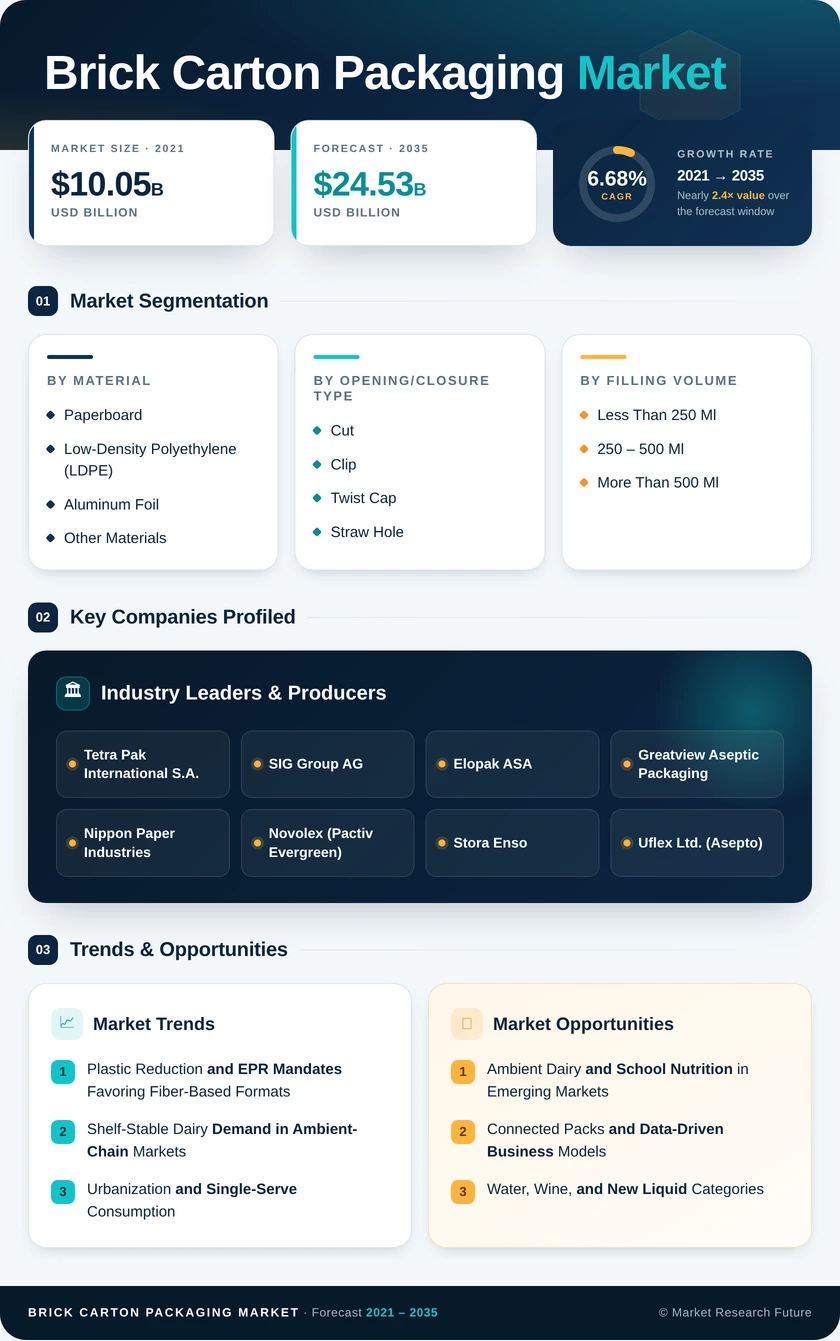
Brick Carton Packaging Market (2026 - 2035)

ID: MRFR/PCM/10325-HCR 111 Pages Snehal Singh Last Updated: September 24, 2026
Brick Carton Packaging Market Research Report Information By Material (Paperboard, Low-Density Polyethylene (LDPE), Aluminum Foil, and Other Materials), By Opening/Closure Type (Cut, Clip, Twist Cap, and Straw Hole), By Filling Volume (Less Than 250 Ml, 250 – 500 Ml, and More Than 500 Ml), and By End-User Industry (Food and Beverages, Pharmaceuticals, Personal Care and Cosmetics, and Other End-User Industries) – Forecast Till 2035
Brick Carton Packaging Market
Market Size
Forecast Period2026-2035
CAGR (2026-2035)6.68%
2025 Market SizeUSD 12.90 Billion
2035 Market SizeUSD 24.53 Billion
Key Players
Tetra Pak International S.A.
SIG Group AG
Elopak ASA
Greatview Aseptic Packaging
Nippon Paper Industries
Novolex
Opportunities
  • Ambient Dairy and School Nutrition in Emerging Markets
  • Connected Packs and Data-Driven Business Models
  • Water, Wine, and New Liquid Categories
  1. 1 Market Summary | |
  2. 2 Key Report Takeaways | |
    1. 2.1 By Material | |
    2. 2.2 By Opening/Closure Type | |
    3. 2.3 By Filling Volume | |
    4. 2.4 By End-User Industry | |
    5. 2.5 By Region | |
  3. 3 Market Size and Forecast (2021–2035) | |
  4. 4 Driver Impact Analysis | |
    1. 4.1 Plastic Reduction and EPR Mandates Favoring Fiber-Based Formats | |
    2. 4.2 Shelf-Stable Dairy Demand in Ambient-Chain Markets | |
    3. 4.3 Urbanization and Single-Serve Consumption | |
    4. 4.4 Plant-Based and Functional Beverage Expansion | |
    5. 4.5 Aluminum-Free Barrier Innovation | |
    6. 4.6 Filling-Line Automation and Digital Printing | |
  5. 5 Restraints Impact Analysis | |
    1. 5.1 Recycling Infrastructure Gaps for Multilayer Packs | |
    2. 5.2 Paperboard and Pulp Price Volatility | |
    3. 5.3 Substitution by PET Bottles and Flexible Pouches | |
    4. 5.4 Aluminum Foil Supply Tightness | |
    5. 5.5 Barrier Chemistry and Food-Contact Compliance Costs | |
  6. 6 Opportunities | |
    1. 6.1 Ambient Dairy and School Nutrition in Emerging Markets | |
    2. 6.2 Connected Packs and Data-Driven Business Models | |
    3. 6.3 Water, Wine, and New Liquid Categories | |
    4. 6.4 Bio-Based Polymers and Plant-Based Closures | |
    5. 6.5 Closed-Loop Recycling Partnerships | |
  7. 7 Regional Market Share and Country-Level Analysis | |
    1. 7.1 North America | | |
      1. 7.1.1 US | | |
      2. 7.1.2 Canada | | |
      3. 7.1.3 Mexico | |
    2. 7.2 Europe | | |
      1. 7.2.1 Germany | | |
      2. 7.2.2 UK | | |
      3. 7.2.3 France | | |
      4. 7.2.4 Italy | | |
      5. 7.2.5 Spain | | |
      6. 7.2.6 Nordic Countries | | |
      7. 7.2.7 Russia | | |
      8. 7.2.8 Rest of Europe | |
    3. 7.3 Asia-Pacific | | |
      1. 7.3.1 China | | |
      2. 7.3.2 India | | |
      3. 7.3.3 Japan | | |
      4. 7.3.4 South Korea | | |
      5. 7.3.5 ASEAN | | |
      6. 7.3.6 Rest of Asia-Pacific | |
    4. 7.4 South America | | |
      1. 7.4.1 Brazil | | |
      2. 7.4.2 Argentina | | |
      3. 7.4.3 Rest of South America | |
    5. 7.5 Middle East & Africa | | |
      1. 7.5.1 Saudi Arabia | | |
      2. 7.5.2 UAE | | |
      3. 7.5.3 South Africa | | |
      4. 7.5.4 Egypt | | |
      5. 7.5.5 Rest of MEA | |
  8. 8 Future Outlook (2026–2035) | |
    1. 8.1 Fiber-Dominant Structures Replace Foil | |
    2. 8.2 Digital Operations on the Filling Line | |
    3. 8.3 Recyclability Grading and Producer Fees | |
    4. 8.4 Demand Geography and Demographics | |
  9. 9 Segmentation Analysis | |
    1. 9.1 By Material | | |
      1. 9.1.1 Paperboard | | |
      2. 9.1.2 Low-Density Polyethylene (LDPE) | | |
      3. 9.1.3 Aluminum Foil | | |
      4. 9.1.4 Other Materials | |
    2. 9.2 By Opening/Closure Type | | |
      1. 9.2.1 Cut | | |
      2. 9.2.2 Clip | | |
      3. 9.2.3 Twist Cap | | |
      4. 9.2.4 Straw Hole | | |
      5. 9.2.5 Other Closure Type | |
    3. 9.3 By Filling Volume | | |
      1. 9.3.1 Less Than 250 Ml | | |
      2. 9.3.2 250 – 500 Ml | | |
      3. 9.3.3 More Than 500 Ml | |
    4. 9.4 By End-User Industry | | |
      1. 9.4.1 Food and Beverages | | |
      2. 9.4.2 Pharmaceuticals | | |
      3. 9.4.3 Personal Care and Cosmetics | | |
      4. 9.4.4 Other End-User Industries | | |
      5. 9.4.5 Dairy Products | | |
      6. 9.4.6 Juices and Functional Drinks | | |
      7. 9.4.7 Nutraceuticals | |
  10. 10 Competitive Landscape | |
  11. 11 Recent News & Developments | |
  12. 12 Report Scope and Methodology | |
  13. 13 Detailed Sources and Citations | |
  14. 14 Frequently Asked Questions (FAQs) | | LIST OF TABLES | |
  15. TABLE 1 Market Snapshot — Study Period, Market Size, CAGR, and Leading Regions | |
  16. TABLE 2 Global Market Size & Forecast, by Revenue (USD Billion), 2021–2035 | |
  17. TABLE 3 Driver Impact Analysis on Forecast CAGR, 2026–2035 | |
  18. TABLE 4 Restraints Impact Analysis on Forecast CAGR, 2026–2035 | |
  19. TABLE 5 Regional Summary — Key Metrics and Investment Themes, 2025 | |
  20. TABLE 6 North America Country-Level Analysis, 2025–2035 | |
  21. TABLE 7 Europe Country-Level Analysis, 2025–2035 | |
  22. TABLE 8 Asia-Pacific Country-Level Analysis, 2025–2035 | |
  23. TABLE 9 South America Country-Level Analysis, 2025–2035 | |
  24. TABLE 10 Middle East & Africa Country-Level Analysis, 2025–2035 | |
  25. TABLE 11 Market Size, by Material, 2021–2035 (USD Billion) | |
  26. TABLE 12 Market Size, by Opening/Closure Type, 2021–2035 (USD Billion) | |
  27. TABLE 13 Market Size, by Filling Volume, 2021–2035 (USD Billion) | |
  28. TABLE 14 Market Size, by End-User Industry, 2021–2035 (USD Billion) | |
  29. TABLE 15 Competitive Benchmarking Matrix, 2025 | |
  30. TABLE 16 Report Scope and Methodology | |
  31. TABLE 17 Detailed Sources and Citations | |
  32. TABLE 18 Segmentation Quick Reference | | LIST OF FIGURES | |
  33. FIGURE 1 Market Dynamics Overview — Drivers, Restraints, and Opportunities | |
  34. FIGURE 2 Industry Value Chain Analysis — Board, Barrier Materials, Conversion, Filling, Recycling | |
  35. FIGURE 3 Porter's Five Forces Analysis | |
  36. FIGURE 4 Global Market Size Trend, 2021–2035 (USD Billion) | |
  37. FIGURE 5 Market Share by Material, 2025 | |
  38. FIGURE 6 Market Share by Opening/Closure Type, 2025 | |
  39. FIGURE 7 Market Share by Filling Volume, 2025 | |
  40. FIGURE 8 Market Share by End-User Industry, 2025 | |
  41. FIGURE 9 Regional Market Share, 2025 | |
  42. FIGURE 10 Country-Level Share within Asia-Pacific, 2025 | |
  43. FIGURE 11 Competitive Positioning Map, 2025 | |
  44. FIGURE 12 Estimated Top-Five Supplier Share Range, 2025

Segmentation Quick Reference

DimensionSub-SegmentsDominant SegmentFastest Growing Segment
By MaterialPaperboard, Low-Density Polyethylene (LDPE), Aluminum Foil, Other MaterialsPaperboard (58.6% share)Aluminum Foil (8.67% CAGR)
By Opening/Closure TypeCut, Clip, Twist Cap, Straw HoleTwist Cap (37.6% share)Straw Hole (7.65% CAGR)
By Filling VolumeLess Than 250 Ml, 250 – 500 Ml, More Than 500 MlMore Than 500 Ml (48.3% share)Less Than 250 Ml (7.31% CAGR)
By End-User IndustryFood and Beverages, Pharmaceuticals, Personal Care and Cosmetics, Other End-User IndustriesFood and Beverages (59.7% share)Personal Care and Cosmetics (8.1% CAGR)
By RegionNorth America, Europe, Asia-Pacific, South America, Middle East & AfricaAsia-Pacific (41.8% share)Asia-Pacific (41.8% share)


Market Segmentation Overview

By Material

Sub-SegmentKey Trend
PaperboardHigher fiber content to meet recyclability grades
Low-Density Polyethylene (LDPE)Shift toward bio-based and thinner sealing layers
Aluminum FoilRetained for infant formula, soups, and low-acid foods
Other MaterialsEVOH and polymer barriers replacing foil in chilled products


Paperboard leads because it provides the stiffness, printability, and fiber mass that regulators reward under PPWR grading. Aluminum Foil grows fastest because the high-barrier categories it protects, especially infant nutrition and ambient soups, expand faster than milk. Other Materials such as EVOH are absorbing foil's role in less demanding chilled and juice applications.

By Opening/Closure Type

Sub-SegmentKey Trend
CutLowest material use for value and cooking packs
ClipTamper-evident premium positioning
Twist CapLighter, bio-based resin caps
Straw HolePaper straws and straw-free drinking spouts


Twist Cap leads because one-litre milk, juice, and plant-based drinks are consumed over several days and need resealing. Straw Hole grows fastest as school milk and children's drinks scale in Asia and Africa, with plastic-straw bans pushing designs toward paper straws rather than other formats. Cut openings persist where cost per pack outweighs convenience.

By Filling Volume

Sub-SegmentKey Trend
Less Than 250 MlPremium protein, coffee, and school portions
250 – 500 MlImpulse and lunchbox occasions
More Than 500 MlPallet efficiency for grocery and club channels


More Than 500 Ml leads because family buyers minimize per-serving cost and retailers favor pallet-efficient litre packs. Less than 250 Ml grows fastest in single-person urban households and school feeding tenders. The 250 – 500 Ml tier benefits from fillers that switch volumes quickly between seasonal runs.

By End-User Industry

Sub-SegmentKey Trend
Food and BeveragesUHT dairy growth in ambient-chain markets
PharmaceuticalsOral and clinical nutrition in sterile packs
Personal Care and CosmeticsRefill formats replacing rigid plastic bottles
Other End-User IndustriesHousehold liquids and pet food trials


Food and Beverages leads because UHT milk, juice, and plant-based drinks rely on ambient shelf life that bricks deliver at low cost. Personal Care and Cosmetics grows fastest from a small base as shampoo and body-wash brands adopt refill bricks to cut rigid plastic. Pharmaceuticals demand stays steady in clinical nutrition, where sterile filling is essential.




Download PDF ×

We do not share your information with anyone. However, we may send you emails based on your report interest from time to time. You may contact us at any time to opt-out.