Brazil Brazil Virtualized Evolved Packet Core Market Segmentation
Brazil Virtualized Evolved Packet Core Market By Component (USD Million, 2025-2035)
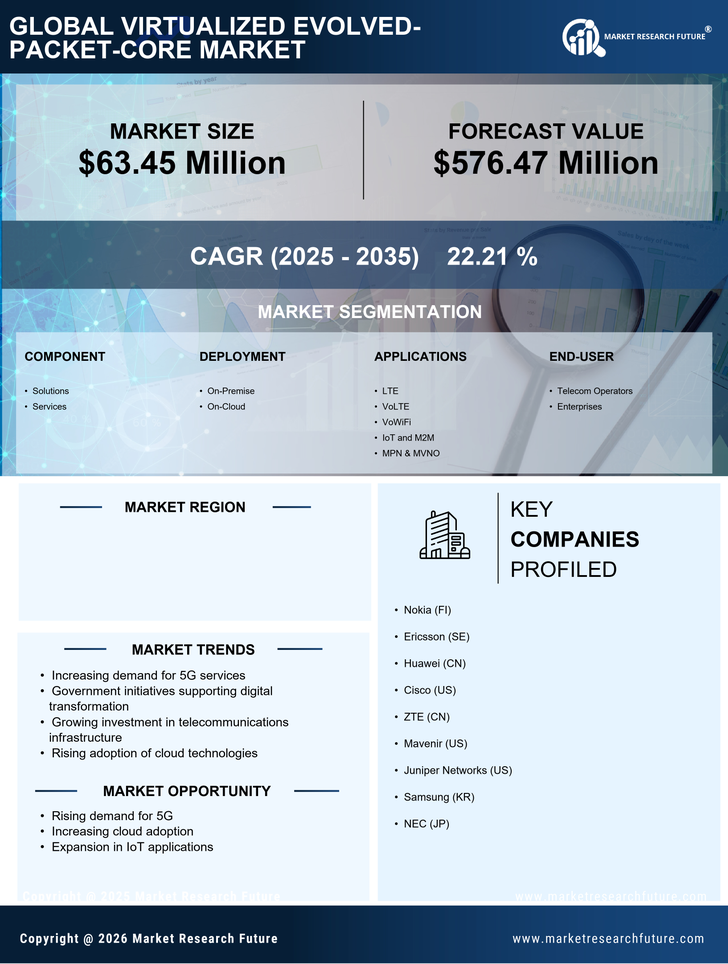
- Solutions
- Services
Brazil Virtualized Evolved Packet Core Market By Deployment (USD Million, 2025-2035)
- On-Premise
- On-Cloud
Brazil Virtualized Evolved Packet Core Market By Applications (USD Million, 2025-2035)
- LTE
- VoLTE
- VoWiFi
- IoT and M2M
- MPN & MVNO
Brazil Virtualized Evolved Packet Core Market By End-User (USD Million, 2025-2035)
- Telecom Operators
- Enterprises