Boric Acid Market (2026 - 2035)

ID: MRFR/CnM/5825-CR 140 Pages Anshula Mandaokar Last Updated: November 13, 2026
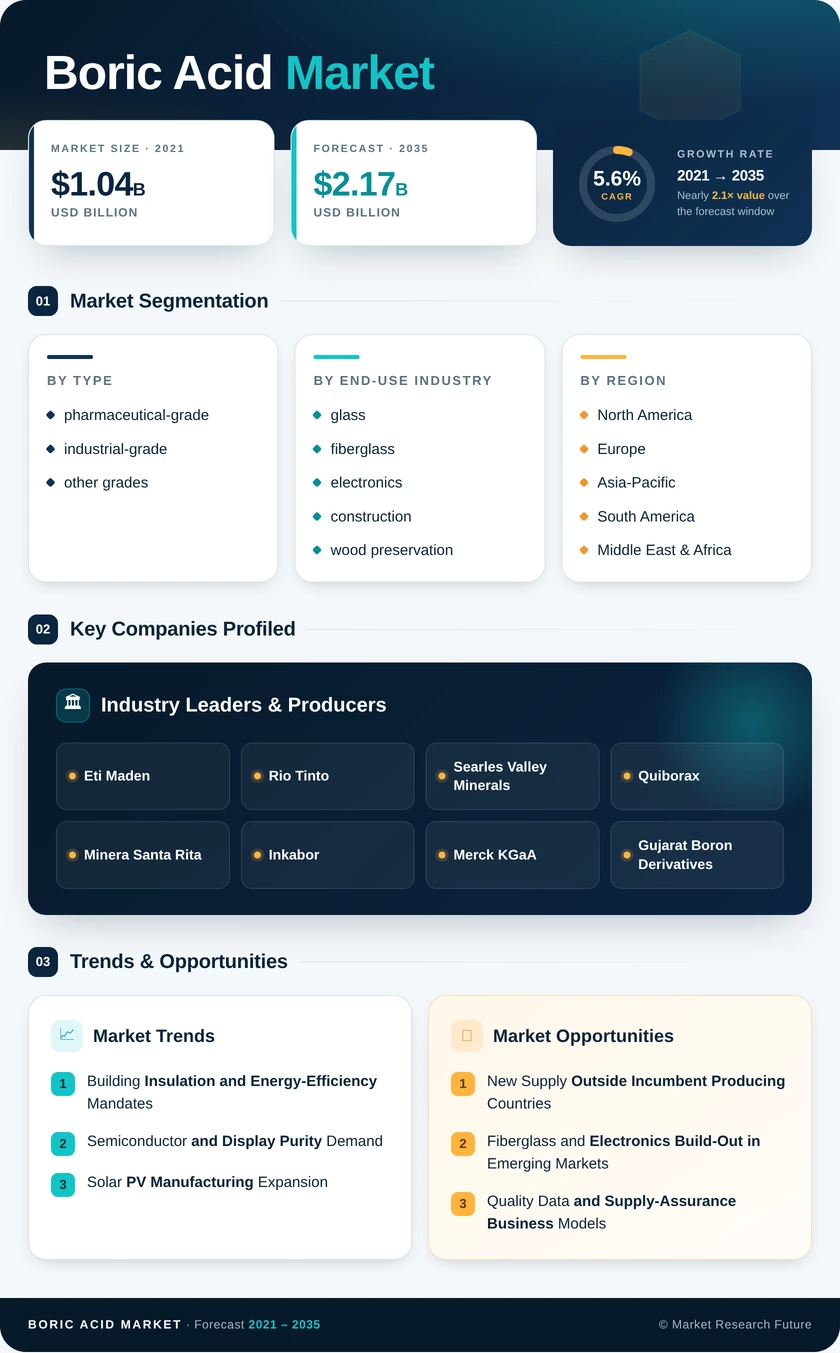
Boric Acid Market Research Report Information By Type (Pharmaceutical-Grade, Industrial-Grade, and Other Grades (Agricultural Granules, Laboratory-Grade, and Analytical Reagents)), By End-Use Industry (Glass and Fiberglass, Electronics, Construction, Wood Preservation, Pharmaceuticals, Cosmetics and Personal Care, Agriculture, and Others (Nuclear Coolant, Flame Retardants, and Metallurgy Fluxes)), And By Region (North America, Europe, Asia-Pacific, and Rest of the World) – Market Forecast Till 2035.
Boric Acid Market
Market Size
Forecast Period2026-2035
CAGR (2026-2035)5.6%
2025 Market SizeUSD 1.25 Billion
2035 Market SizeUSD 2.17 Billion
Key Players
Eti Maden
Rio Tinto
Searles Valley Minerals
Quiborax
Minera Santa Rita
Inkabor
Opportunities
  • New Supply Outside Incumbent Producing Countries
  • Fiberglass and Electronics Build-Out in Emerging Markets
  • Quality Data and Supply-Assurance Business Models
  1. 1 Market Summary | |
  2. 2 Key Report Takeaways | |
    1. 2.1 By Type | |
    2. 2.2 By End-use Industry | |
    3. 2.3 By Region | |
  3. 3 Market Size and Forecast (2021–2035) | |
  4. 4 Driver Impact Analysis | |
    1. 4.1 Building Insulation and Energy-Efficiency Mandates | |
    2. 4.2 Semiconductor and Display Purity Demand | |
    3. 4.3 Solar PV Manufacturing Expansion | |
    4. 4.4 Agricultural Boron Deficiency Correction | |
    5. 4.5 Pharmaceutical-Grade Qualification Demand | |
    6. 4.6 Nuclear Power New-Build | |
  5. 5 Restraints Impact Analysis | |
    1. 5.1 EU Reproductive-Toxicity Classification | |
    2. 5.2 Supply Concentration in a Few Producing Countries | |
    3. 5.3 Energy, Sulfuric Acid and Freight Cost Volatility | |
    4. 5.4 Substitution in Wood Preservation and Pest Control | |
    5. 5.5 Long Qualification Cycles for High-Purity Grades | |
  6. 6 Opportunities | |
    1. 6.1 New Supply Outside Incumbent Producing Countries | |
    2. 6.2 Fiberglass and Electronics Build-Out in Emerging Markets | |
    3. 6.3 Quality Data and Supply-Assurance Business Models | |
    4. 6.4 Lithium and Co-Product Recovery at Borate Operations | |
    5. 6.5 Nuclear-Grade and Boron-10 Enriched Products | |
  7. 7 Regional Market Share and Country-Level Analysis | |
    1. 7.1 North America | | |
      1. 7.1.1 US | | |
      2. 7.1.2 Canada | | |
      3. 7.1.3 Mexico | |
    2. 7.2 Europe | | |
      1. 7.2.1 Germany | | |
      2. 7.2.2 UK | | |
      3. 7.2.3 France | | |
      4. 7.2.4 Italy | | |
      5. 7.2.5 Spain | | |
      6. 7.2.6 Nordic Countries | | |
      7. 7.2.7 Russia | | |
      8. 7.2.8 Rest of Europe | |
    3. 7.3 Asia-Pacific | | |
      1. 7.3.1 China | | |
      2. 7.3.2 India | | |
      3. 7.3.3 Japan | | |
      4. 7.3.4 South Korea | | |
      5. 7.3.5 ASEAN | | |
      6. 7.3.6 Rest of Asia-Pacific | |
    4. 7.4 South America | | |
      1. 7.4.1 Brazil | | |
      2. 7.4.2 Argentina | | |
      3. 7.4.3 Rest of South America | |
    5. 7.5 Middle East & Africa | | |
      1. 7.5.1 Saudi Arabia | | |
      2. 7.5.2 UAE | | |
      3. 7.5.3 South Africa | | |
      4. 7.5.4 Egypt | | |
      5. 7.5.5 Rest of MEA | |
  8. 8 Future Outlook (2026–2035) | |
    1. 8.1 Electronics Capacity Reshapes the Grade Mix | |
    2. 8.2 Energy Transition Demand Through Solar and Nuclear | |
    3. 8.3 Building Decarbonization Keeps Fiberglass at the Core | |
    4. 8.4 Supply Security and Sustainability Reporting | |
  9. 9 Segmentation Analysis | |
    1. 9.1 By Type | | |
      1. 9.1.1 pharmaceutical-grade | | |
      2. 9.1.2 industrial-grade | | |
      3. 9.1.3 other grades | |
    2. 9.2 By End-use Industry | | |
      1. 9.2.1 glass and fiberglass | | |
      2. 9.2.2 electronics | | |
      3. 9.2.3 construction | | |
      4. 9.2.4 wood preservation | | |
      5. 9.2.5 pharmaceuticals | | |
      6. 9.2.6 cosmetics & personal care | | |
      7. 9.2.7 agriculture | | |
      8. 9.2.8 others | |
  10. 10 Competitive Landscape | |
    1. 10.1 Market Concentration Analysis | |
    2. 10.2 Competitive Benchmarking | |
    3. 10.3 Company Profiles | | |
      1. 10.3.1 Eti Maden | | |
      2. 10.3.2 Rio Tinto | | |
      3. 10.3.3 Searles Valley Minerals | | |
      4. 10.3.4 Quiborax | | |
      5. 10.3.5 Minera Santa Rita | | |
      6. 10.3.6 Inkabor | | |
      7. 10.3.7 Merck KGaA | | |
      8. 10.3.8 Gujarat Boron Derivatives | | |
      9. 10.3.9 Avantor | | |
      10. 10.3.10 5E Advanced Materials | |
  11. 11 Recent News & Developments | |
  12. 12 Report Scope and Methodology | |
  13. 13 Detailed Sources and Citations | |
  14. 14 Frequently Asked Questions (FAQs) | | LIST OF TABLES | |
  15. TABLE 1 Global Market Snapshot, 2025–2035 | |
  16. TABLE 2 Global Market Size & Forecast, by Revenue (USD Billion), 2021–2035 | |
  17. TABLE 3 Driver Impact Analysis, 2026–2035 | |
  18. TABLE 4 Restraints Impact Analysis, 2026–2035 | |
  19. TABLE 5 Regional Summary, 2025 | |
  20. TABLE 6 North America Market, by Country, 2025 | |
  21. TABLE 7 Europe Market, by Country, 2025 | |
  22. TABLE 8 Asia-Pacific Market, by Country, 2025 | |
  23. TABLE 9 South America Market, by Country, 2025 | |
  24. TABLE 10 Middle East & Africa Market, by Country, 2025 | |
  25. TABLE 11 Global Market, by Type, 2025 | |
  26. TABLE 12 Global Market, by End-use Industry, 2025 | |
  27. TABLE 13 Competitive Benchmarking of Key Players | |
  28. TABLE 14 Report Scope and Methodology | |
  29. TABLE 15 Detailed Sources and Citations | |
  30. TABLE 16 Segmentation Quick Reference | |
  31. TABLE 17 Market Segmentation Overview, by Type | |
  32. TABLE 18 Market Segmentation Overview, by End-use Industry | | LIST OF FIGURES | |
  33. FIGURE 1 Market Dynamics Overview — Drivers, Restraints and Opportunities | |
  34. FIGURE 2 Value Chain Analysis — Ore Mining to End-Use Industries | |
  35. FIGURE 3 Porter's Five Forces Analysis | |
  36. FIGURE 4 Global Market Size Trend, 2021–2035 (USD Billion) | |
  37. FIGURE 5 Year-over-Year Growth Rate, 2022–2035 | |
  38. FIGURE 6 Market Share by Type, 2025 | |
  39. FIGURE 7 Market Share by End-use Industry, 2025 | |
  40. FIGURE 8 Regional Market Share, 2025 | |
  41. FIGURE 9 Country-Level Share Within Asia-Pacific, 2025 | |
  42. FIGURE 10 Competitive Landscape — Estimated Revenue Share Ranges | |
  43. FIGURE 11 Market Concentration Profile (Top-5 Share and HHI)

Segmentation Quick Reference

DimensionSub-SegmentsDominant SegmentFastest Growing Segment
By Typepharmaceutical-grade, industrial-grade, other gradesindustrial-grade (68.0% share)pharmaceutical-grade (6.6% CAGR)
By End-use Industryglass and fiberglass, electronics, construction, wood preservation, pharmaceuticals, cosmetics & personal care, agriculture, othersglass and fiberglass (38.4% share)electronics (6.9% CAGR)
By RegionNorth America, Europe, Asia-Pacific, South America, Middle East & AfricaAsia-Pacific (47.5% share)Asia-Pacific (47.5% share; fastest-growing region)

Market Segmentation Overview

By Type

Sub-SegmentKey Trend
pharmaceutical-gradeRising cGMP and regulatory-filing requirements narrow the approved supplier base
industrial-gradeVolume anchor tied to glass, fiberglass and ceramics furnace capacity
other gradesSteady demand from agricultural granules and laboratory reagents

Industrial-grade leads with a 68.0% share because fiberglass and ceramics plants consume boric acid in bulk and rarely change their melt recipes. Pharmaceutical-grade grows fastest at a 6.6% CAGR, since ICH Q7 compliance and Drug Master File listings let qualified suppliers command premium pricing and long contracts. Other grades hold a stable niche in crop nutrition and analytical laboratories.

By End-use Industry

Sub-SegmentKey Trend
glass and fiberglassInsulation retrofits and specialty glass keep furnace demand locked in
electronicsSemiconductor, LCD and photovoltaic lines demand ultra-low impurity grades
constructionInsulation boards and fire-retardant materials track building codes
wood preservationDual fungicidal and insecticidal action sustains interior timber use
pharmaceuticalsAntiseptic, buffer and excipient-related uses grow with generic output
cosmetics & personal careEU concentration limits shift growth to other regions
agricultureBoron correction programs expand on deficient soils
othersNuclear coolant, flame retardants and metallurgical fluxes

Glass and fiberglass lead with a 38.4% share because furnace chemistry is engineered around boron inputs, making substitution costly. Electronics grows fastest at a 6.9% CAGR as new fabs and display plants require certified high-purity material. Agriculture and pharmaceuticals add steady growth, while cosmetics & personal care faces European regulatory limits.


Download PDF ×

We do not share your information with anyone. However, we may send you emails based on your report interest from time to time. You may contact us at any time to opt-out.