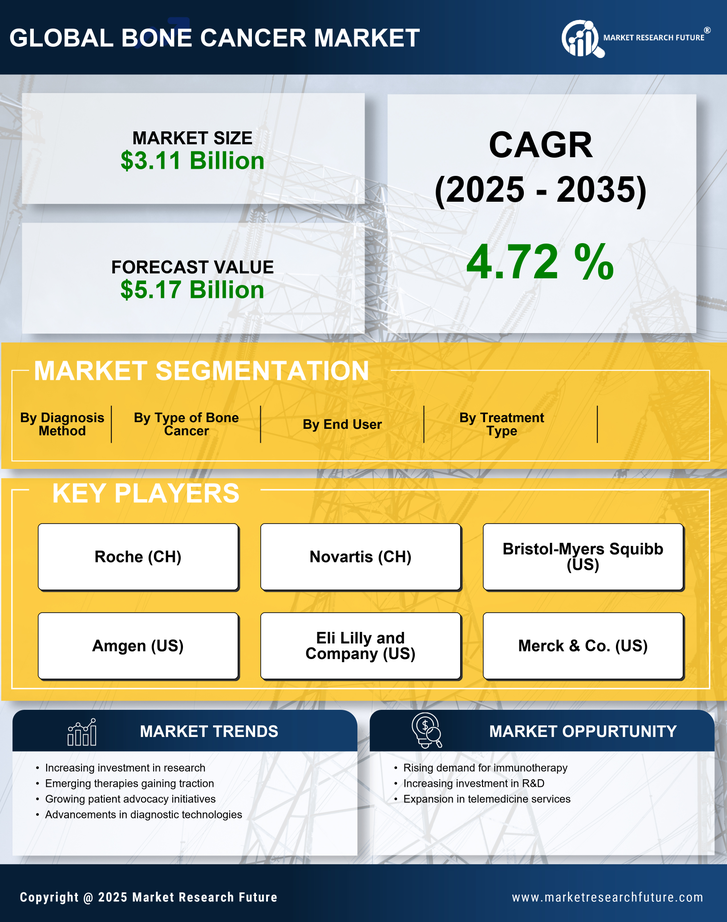
Table of Contents
Chapter 1. Executive Summary
Chapter 2. Market Introduction
2.1 Definition
2.2 Scope of the Study
2.2.1 Research Objective
2.2.2 Assumptions
2.2.3 Limitations
Chapter 3. Research Methodology
3.1 Overview
3.2 Primary Research
3.3 Secondary Research
3.4 Market Size Estimation
Chapter 4. Market Dynamics
4.1 Drivers
4.2 Restraints
4.3 Opportunities
Chapter 5. Market Factor Analysis
5.1 Porter’s Five Forces Analysis
5.1.1 Bargaining Power of Suppliers
5.1.2 Bargaining Power of Buyers
5.1.3 Threat of New Entrants
5.1.4 Threat of Substitutes
5.1.5 Intensity of Rivalry
5.2 Value Chain Analysis
5.2.1 R&D and Designing
5.2.2 Manufacturing
5.2.3 Distribution & Sales
5.2.4 Post-Sales Review
Chapter 6. Global Bone Cancer Market, by Type
6.1 Overview
6.2 Primary
Market Estimates & Forecast, by Region, 2023-2030
Market Estimates & Forecast, by Country, 2023-2030
6.2.1 Ewing Sarcoma
Market Estimates & Forecast, by Region, 2023-2030
Market Estimates & Forecast, by Country, 2023-2030
6.2.2 Osteosarcoma
Market Estimates & Forecast, by Region, 2023-2030
Market Estimates & Forecast, by Country, 2023-2030
6.2.3 Chondrosarcoma
Market Estimates & Forecast, by Region, 2023-2030
Market Estimates & Forecast, by Country, 2023-2030
6.2.4 Chordoma
Market Estimates & Forecast, by Region, 2023-2030
Market Estimates & Forecast, by Country, 2023-2030
6.2.5 Others
Market Estimates & Forecast, by Region, 2023-2030
Market Estimates & Forecast, by Country, 2023-2030
6.3 Secondary
Market Estimates & Forecast, by Region, 2023-2030
Market Estimates & Forecast, by Country, 2023-2030
Chapter 7. Global Bone Cancer Market, by Diagnostic Test & Treatment
7.1 Overview
7.2 Diagnostic Test
Market Estimates & Forecast, by Region, 2023-2030
Market Estimates & Forecast, by Country, 2023-2030
7.2.1 Blood Tests
Market Estimates & Forecast, by Region, 2023-2030
Market Estimates & Forecast, by Country, 2023-2030
7.2.2 Imaging
Market Estimates & Forecast, by Region, 2023-2030
Market Estimates & Forecast, by Country, 2023-2030
7.2.2.1 X-Ray
Market Estimates & Forecast, by Region, 2023-2030
Market Estimates & Forecast, by Country, 2023-2030
7.2.2.2 Bone Scan
Market Estimates & Forecast, by Region, 2023-2030
Market Estimates & Forecast, by Country, 2023-2030
7.2.2.3 Computed Tomography (CT) Scan
Market Estimates & Forecast, by Region, 2023-2030
Market Estimates & Forecast, by Country, 2023-2030
7.2.2.4 Magnetic Resonance Imaging (MRI) Scan
Market Estimates & Forecast, by Region, 2023-2030
Market Estimates & Forecast, by Country, 2023-2030
7.2.2.5 Positron Emission Tomography (PET) Scan
Market Estimates & Forecast, by Region, 2023-2030
Market Estimates & Forecast, by Country, 2023-2030
7.2.3 Biopsy
7.3 Treatment
Market Estimates & Forecast, by Region, 2023-2030
Market Estimates & Forecast, by Country, 2023-2030
7.3.1 Surgery
Market Estimates & Forecast, by Region, 2023-2030
Market Estimates & Forecast, by Country, 2023-2030
7.3.2 Therapy
Market Estimates & Forecast, by Region, 2023-2030
Market Estimates & Forecast, by Country, 2023-2030
7.3.2.1 Chemotherapy
Market Estimates & Forecast, by Region, 2023-2030
Market Estimates & Forecast, by Country, 2023-2030
7.3.2.1.1 Cisplatin
Market Estimates & Forecast, by Region, 2023-2030
Market Estimates & Forecast, by Country, 2023-2030
7.3.2.1.2 Doxorubicin
Market Estimates & Forecast, by Region, 2023-2030
Market Estimates & Forecast, by Country, 2023-2030
7.3.2.1.3 Ifosfamide
Market Estimates & Forecast, by Region, 2023-2030
Market Estimates & Forecast, by Country, 2023-2030
7.3.2.1.4 Cyclophosphamide
Market Estimates & Forecast, by Region, 2023-2030
Market Estimates & Forecast, by Country, 2023-2030
7.3.2.1.5 Others
Market Estimates & Forecast, by Region, 2023-2030
Market Estimates & Forecast, by Country, 2023-2030
7.3.2.2 Targeted therapy
Market Estimates & Forecast, by Region, 2023-2030
Market Estimates & Forecast, by Country, 2023-2030
7.3.2.3 Immunotherapy
Market Estimates & Forecast, by Region, 2023-2030
Market Estimates & Forecast, by Country, 2023-2030
7.3.2.4 Radiation Therapy
Market Estimates & Forecast, by Region, 2023-2030
Market Estimates & Forecast, by Country, 2023-2030
Chapter 8. Global Bone Cancer Market, by End User
8.1 Overview
8.2 Hospitals & Clinics
Market Estimates & Forecast, by Region, 2023-2030
Market Estimates & Forecast, by Country, 2023-2030
8.3 Diagnostic Centers
Market Estimates & Forecast, by Region, 2023-2030
Market Estimates & Forecast, by Country, 2023-2030
8.4 Academic & Research Organizations
Market Estimates & Forecast, by Region, 2023-2030
Market Estimates & Forecast, by Country, 2023-2030
Chapter 9. Global Bone Cancer Market, by Region
9.1 Overview
9.2 Americas
9.2.1 North America
9.2.1.1 US
9.2.1.2 Canada
9.2.2 Latin America
9.3 Europe
9.3.1 Western Europe
9.3.1.1 Germany
9.3.1.2 France
9.3.1.3 Italy
9.3.1.4 Spain
9.3.1.5 UK
9.3.1.6 Rest of Western Europe
9.3.2 Eastern Europe
9.4 Asia-Pacific
9.4.1 Japan
9.4.2 China
9.4.3 India
9.4.4 Australia
9.4.5 South Korea
9.4.6 Rest of Asia-Pacific
9.5 Middle East & Africa
9.5.1 Middle East
9.5.2 Africa
Chapter 10. Company Landscape
10.1 Overview
10.2 Competitive Analysis
Chapter 11. Company Profile
11.1 Accord Healthcare Inc.
11.1.1 Company Overview
11.1.2 Products/Services Offered
11.1.3 Financial Overview
11.1.4 Key Developments
11.1.5 SWOT Analysis
11.1.6 Key Strategies
11.2 Amgen
11.2.1 Company Overview
11.2.2 Products/Services Offered
11.2.3 Financial Overview
11.2.4 Key Developments
11.2.5 SWOT Analysis
11.2.6 Key Strategies
11.3 Bayer AG
11.3.1 Company Overview
11.3.2 Products/Services Offered
11.3.3 Financial Overview
11.3.4 Key Development
11.3.5 SWOT Analysis
11.3.6 Key Strategies
11.4 Bristol-Myers Squibb Company
11.4.1 Company Overview
11.4.2 Products/Services Offered
11.4.3 Financial Overview
11.4.4 Key Development
11.4.5 SWOT Analysis
11.4.6 Key Strategies
11.5 Eli Lilly
11.5.1 Company Overview
11.5.2 Products/Services Offered
11.5.3 Financial overview
11.5.4 Key Developments
11.5.5 SWOT Analysis
11.5.6 Key Strategies
11.6 Fresenius Kabi USA, LLC
11.6.1 Company Overview
11.6.2 Products/Services Offered
11.6.3 Financial Overview
11.6.4 Key Developments
11.6.5 SWOT Analysis
11.6.6 Key Strategies
11.7 Hikma Pharmaceuticals
11.7.1 Overview
11.7.2 Products/Services Offered
11.7.3 Financial Overview
11.7.4 Key Developments
11.7.5 SWOT Analysis
11.7.6 Key Strategies
11.8 Johnson & Johnson
11.8.1 Overview
11.8.2 Products/Services Offered
11.8.3 Financial Overview
11.8.4 Key Developments
11.8.5 SWOT Analysis
11.8.6 Key Strategies
11.9 Merck & Co. Inc.
11.9.1 Overview
11.9.2 Products/Services Offered
11.9.3 Financial Overview
11.9.4 Key Developments
11.9.5 SWOT Analysis
11.9.6 Key Strategies
11.10 Mylan Pharmaceuticals Inc.
11.10.1 Overview
11.10.2 Products/Services Offered
11.10.3 Financial Overview
11.10.4 Key Developments
11.10.5 SWOT Analysis
11.10.6 Key Strategies
11.11 Pfizer Inc.
11.11.1 Overview
11.11.2 Products/Services Offered
11.11.3 Financial Overview
11.11.4 Key Developments
11.11.5 SWOT Analysis
11.11.6 Key Strategies
11.12 Recordati Group
11.12.1 Overview
11.12.2 Products/Services Offered
11.12.3 Financial Overview
11.12.4 Key Developments
11.12.5 SWOT Analysis
11.12.6 Key Strategies
11.13 Takeda Pharmaceutical Company
11.13.1 Overview
11.13.2 Products/Services Offered
11.13.3 Financial Overview
11.13.4 Key Developments
11.13.5 SWOT Analysis
11.13.6 Key Strategies
11.14 Teva Pharmaceuticals USA, Inc.
11.14.1 Overview
11.14.2 Products/Services Offered
11.14.3 Financial Overview
11.14.4 Key Developments
11.14.5 SWOT Analysis
11.14.6 Key Strategies
11.15 Others
Chapter 13 Appendix
13.1 References
13.2 Related Reports
LIST OF TABLES
Table 1 Global Bone Cancer Market Synopsis, 2023-2030
Table 2 Global Bone Cancer Market Estimates and Forecast, 2023-2030 (USD Million)
Table 3 Global Bone Cancer Market, by Type, 2023-2030 (USD Million)
Table 4 Global Bone Cancer Market, by Diagnostic Test & Treatment, 2023-2030 (USD Million)
Table 5 Global Bone Cancer Market, by End User, 2023-2030 (USD Million)
Table 6 Global Bone Cancer Market, by Region, 2023-2030 (USD Million)
Table 7 Americas: Bone Cancer Market, by Region, 2023 and 2025
Table 8 Americas: Bone Cancer Market, by Type, 2023-2030 (USD Million)
Table 9 Americas: Bone Cancer Market, by Diagnostic Test & Treatment, 2023-2030 (USD Million)
Table 10 Americas Bone Cancer Market, by End User, 2023-2030 (USD Million)
Table 11 North America: Bone Cancer Market, by Country, 2023-2030 (USD Million)
Table 12 North America: Bone Cancer Market, by Type, 2023-2030 (USD Million)
Table 13 North America: Bone Cancer Market, by Diagnostic Test & Treatment, 2023-2030 (USD Million)
Table 14 North Americas Bone Cancer Market, by End User, 2023-2030 (USD Million)
Table 15 US: Bone Cancer Market, by Type, 2023-2030 (USD Million)
Table 16 US: Bone Cancer Market, by Diagnostic Test & Treatment, 2023-2030 (USD Million)
Table 17 US: Bone Cancer Market, by End User, 2023-2030 (USD Million)
Table 18 Canada: Bone Cancer Market, by Type, 2023-2030 (USD Million)
Table 19 Canada: Bone Cancer Market, by Diagnostic Test & Treatment, 2023-2030 (USD Million)
Table 20 Canada: Bone Cancer Market, by End User, 2023-2030 (USD Million)
Table 21 Latin America: Bone Cancer Market, by Type, 2023-2030 (USD Million)
Table 22 Latin America: Bone Cancer Market, by Diagnostic Test & Treatment, 2023-2030 (USD Million)
Table 23 Latin America: Bone Cancer Market, by End User, 2023-2030 (USD Million)
Table 24 Europe: Bone Cancer Market, by Region, 2023-2030 (USD Million)
Table 25 Europe: Bone Cancer Market, by Type, 2023-2030 (USD Million)
Table 26 Europe: Bone Cancer Market, by Diagnostic Test & Treatment, 2023-2030 (USD Million)
Table 27 Europe: Bone Cancer Market, by End User, 2023-2030 (USD Million)
Table 28 Western Europe: Bone Cancer Market, by Country, 2023-2030 (USD Million)
Table 29 Western Europe: Bone Cancer Market, by Type, 2023-2030 (USD Million)
Table 30 Western Europe: Bone Cancer Market, by Diagnostic Test & Treatment, 2023-2030 (USD Million)
Table 31 Western Europe: Bone Cancer Market, by End User, 2023-2030 (USD Million)
Table 32 Eastern Europe: Bone Cancer Market, by Type, 2023-2030 (USD Million)
Table 33 Eastern Europe: Bone Cancer Market, by Diagnostic Test & Treatment, 2023-2030 (USD Million)
Table 34 Eastern Europe: Bone Cancer Market, by End User, 2023-2030 (USD Million)
Table 35 Asia-Pacific: Bone Cancer Market, by Country, 2023-2030 (USD Million)
Table 36 Asia-Pacific: Bone Cancer Market, by Type, 2023-2030 (USD Million)
Table 37 Asia-Pacific: Bone Cancer Market, by Diagnostic Test & Treatment, 2023-2030 (USD Million)
Table 38 Asia-Pacific: Bone Cancer Market, by End User, 2023-2030 (USD Million)
Table 39 Middle East & Africa: Bone Cancer Market, by Region, 2023-2030 (USD Million)
Table 40 Middle East & Africa: Bone Cancer Market, by Type, 2023-2030 (USD Million)
Table 41 Middle East & Africa: Bone Cancer Market, by Diagnostic Test & Treatment, 2023-2030 (USD Million)
Table 42 Middle East & Africa: Bone Cancer Market, by End User, 2023-2030 (USD Million)
LIST OF FIGURES
Figure 1 Research Process
Figure 2 Market Structure of the Global Bone Cancer Market
Figure 3 Market Dynamics of the Global Bone Cancer Market
Figure 4 Global Bone Cancer Market Share, by Type, 2023 (%)
Figure 5 Global Bone Cancer Market Share, by Type, 2023 (USD Million)
Figure 6 Global Bone Cancer Market Share, by Diagnostic Test & Treatment, 2023 (%)
Figure 7 Global Bone Cancer Market Share, by Diagnostic Test & Treatment, 2023 (USD Million)
Figure 8 Global Bone Cancer Market Share, by End User, 2023 (%)
Figure 9 Global Bone Cancer Market Share, by End User, 2023 (USD Million)
Figure 10 Global Bone Cancer Market Share, by Region, 2023 (%)
Figure 11 Americas: Bone Cancer Market Share, by Region, 2023 (%)
Figure 12 North America: Bone Cancer Market Share, by Country, 2023 (%)
Figure 13 Europe: Bone Cancer Market Share, by Region, 2023 (%)
Figure 14 Asia-Pacific: Bone Cancer Market Share, by Country, 2023 (%)
Figure 15 Middle East & Africa: Bone Cancer Market Share, by Region, 2023 (%)
Figure 16 Global Bone Cancer Market: Company Share Analysis, 2023 (%)
Figure 17 Accord Healthcare Inc.: Key Financials
Figure 18 Accord Healthcare Inc.: Segmental Revenue
Figure 19 Accord Healthcare Inc.: Regional Revenue
Figure 20 Amgen: Key Financials
Figure 21 Amgen: Segmental Revenue
Figure 22 Amgen: Regional Revenue
Figure 23 Bayer AG: Key Financials
Figure 24 Bayer AG: Segmental Revenue
Figure 25 Bayer AG: Regional Revenue
Figure 26 Bristol-Myers Squibb Company: Key Financials
Figure 27 Bristol-Myers Squibb Company: Segmental Revenue
Figure 28 Bristol-Myers Squibb Company: Regional Revenue
Figure 29 Eli Lilly: Key Financials
Figure 30 Eli Lilly: Segmental Revenue
Figure 31 Eli Lilly: Regional Revenue
Figure 32 Fresenius Kabi USA, LLC: Key Financials
Figure 33 Fresenius Kabi USA, LLC: Segmental Revenue
Figure 34 Fresenius Kabi USA, LLC: Regional Revenue
Figure 35 Hikma Pharmaceuticals: Key Financials
Figure 36 Hikma Pharmaceuticals: Segmental Revenue
Figure 37 Hikma Pharmaceuticals: Regional Revenue
Figure 38 Johnson & Johnson: Key Financials
Figure 39 Johnson & Johnson: Segmental Revenue
Figure 40 Johnson & Johnson: Regional Revenue
Figure 41 Merck & Co. Inc.: Key Financials
Figure 42 Merck & Co. Inc.: Segmental Revenue
Figure 43 Merck & Co. Inc.: Regional Revenue