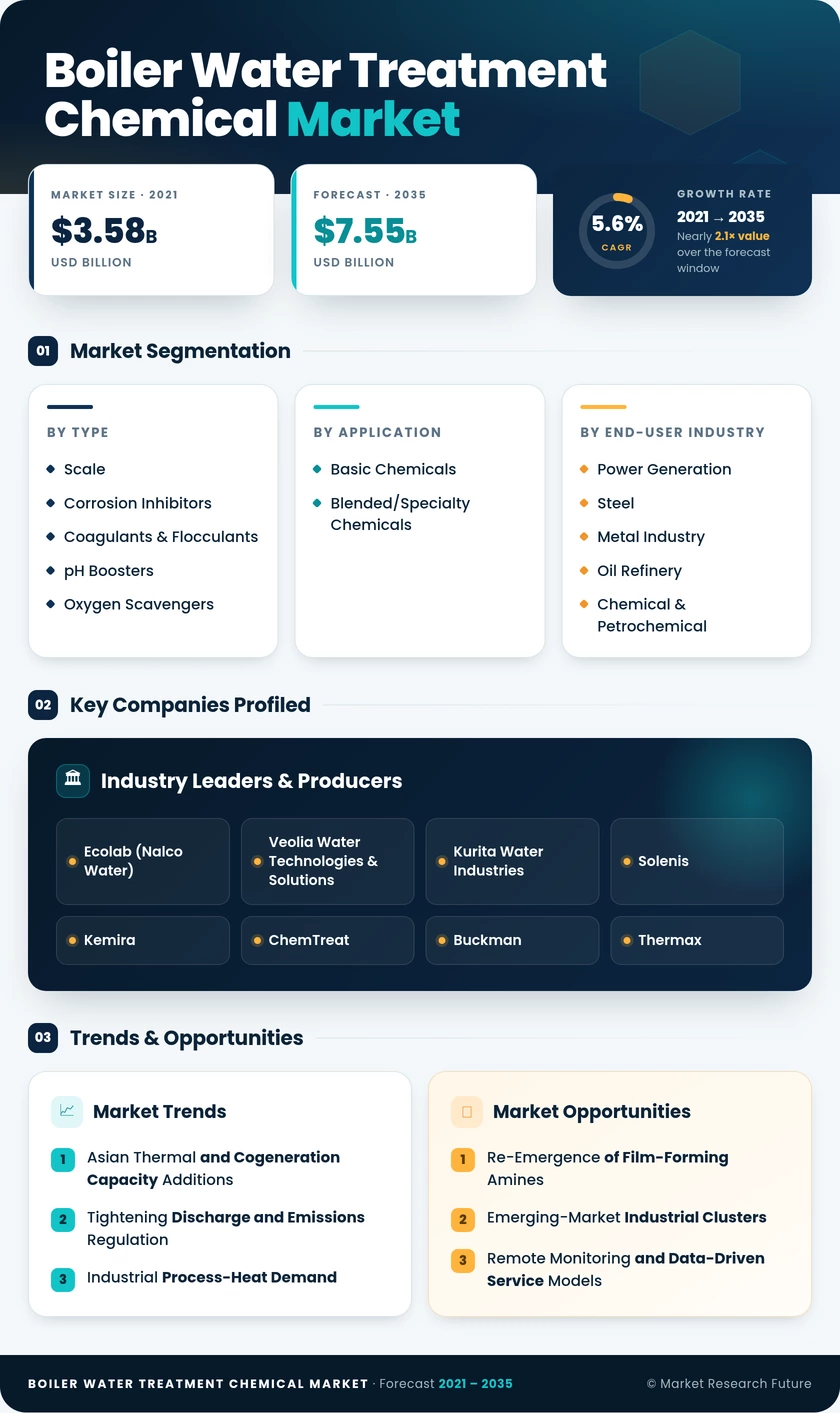
Boiler Water Treatment Chemical Market (2026 - 2035)

ID: MRFR/CnM/4722-HCR 100 Pages Chitranshi Jaiswal Last Updated: October 27, 2026
Boiler Water Treatment Chemical Market Research Report Information By Type (Scale and Corrosion Inhibitors, Coagulants & Flocculants, pH Boosters, Oxygen Scavengers, and Others), By Application (Basic Chemicals and Blended/Specialty Chemicals), and By End-user Industry (Power Generation, Steel and Metal Industry, Oil Refinery, Chemical & Petrochemical, Textile and Dye Industry, Sugar Mill, Food and Beverage, and Other End-user Industries) – Forecast Till 2035.
Boiler Water Treatment Chemical Market
Market Size
Forecast Period2026-2035
CAGR (2026-2035)5.60%
2025 Market SizeUSD 4.38 Billion
2035 Market SizeUSD 7.55 Billion
Key Players
Ecolab
Veolia Water Technologies & Solutions
Kurita Water Industries
Solenis
Kemira
ChemTreat
Opportunities
  • Re-Emergence of Film-Forming Amines
  • Emerging-Market Industrial Clusters
  • Remote Monitoring and Data-Driven Service Models
  1. 1 Market Summary | |
  2. 2 Key Report Takeaways | |
    1. 2.1 By Type | |
    2. 2.2 By Application | |
    3. 2.3 By End-user Industry | |
    4. 2.4 By Region | |
  3. 3 Market Size and Forecast (2021–2035) | |
  4. 4 Driver Impact Analysis | |
    1. 4.1 Asian Thermal and Cogeneration Capacity Additions | |
    2. 4.2 Tightening Discharge and Emissions Regulation | |
    3. 4.3 Industrial Process-Heat Demand | |
    4. 4.4 Shift to Supercritical and High-Pressure Boilers | |
    5. 4.5 Fuel-Efficiency and Lifecycle-Cost Focus | |
    6. 4.6 Food, Beverage and Pharmaceutical Process-Steam Growth | |
  5. 5 Restraints Impact Analysis | |
    1. 5.1 Low Treatment Awareness Among Small Operators | |
    2. 5.2 Coal Phase-Down in OECD Economies | |
    3. 5.3 Hydrazine Restrictions and Reformulation Costs | |
    4. 5.4 Raw Material Price Volatility | |
    5. 5.5 Electrification of Low-Temperature Industrial Heat | |
  6. 6 Opportunities | |
    1. 6.1 Re-Emergence of Film-Forming Amines | |
    2. 6.2 Emerging-Market Industrial Clusters | |
    3. 6.3 Remote Monitoring and Data-Driven Service Models | |
    4. 6.4 Biomass, Waste-to-Energy and Hydrogen-Ready Boilers | |
    5. 6.5 Water Reuse and Zero-Liquid-Discharge Integration | |
  7. 7 Regional Market Share and Country-Level Analysis | |
    1. 7.1 Asia-Pacific | | |
      1. 7.1.1 China | | |
      2. 7.1.2 India | | |
      3. 7.1.3 Japan | | |
      4. 7.1.4 South Korea | | |
      5. 7.1.5 ASEAN Countries | | |
      6. 7.1.6 Rest of Asia-Pacific | |
    2. 7.2 North America | | |
      1. 7.2.1 United States | | |
      2. 7.2.2 Canada | | |
      3. 7.2.3 Mexico | |
    3. 7.3 Europe | | |
      1. 7.3.1 Germany | | |
      2. 7.3.2 United Kingdom | | |
      3. 7.3.3 France | | |
      4. 7.3.4 Italy | | |
      5. 7.3.5 Rest of the Europe | |
    4. 7.4 South America | | |
      1. 7.4.1 Brazil | | |
      2. 7.4.2 Argentina | | |
      3. 7.4.3 Rest of South America | |
    5. 7.5 Middle-East & Africa | | |
      1. 7.5.1 Saudi Arabia | | |
      2. 7.5.2 South Africa | | |
      3. 7.5.3 Rest of Middle-East & Africa | |
  8. 8 Future Outlook (2026–2035) | |
    1. 8.1 Digital Chemistry Control and Predictive Operations | |
    2. 8.2 Decarbonization of Industrial Heat | |
    3. 8.3 Water Stress and Circular Water Use | |
    4. 8.4 ESG Reporting and Greener Formulations | |
  9. 9 Segmentation Analysis | |
    1. 9.1 By Type | | |
      1. 9.1.1 Scale and Corrosion Inhibitors | | |
      2. 9.1.2 Coagulants & Flocculants | | |
      3. 9.1.3 pH Boosters | | |
      4. 9.1.4 Oxygen Scavengers | | |
      5. 9.1.5 Others | |
    2. 9.2 By Application | | |
      1. 9.2.1 Basic Chemicals | | |
      2. 9.2.2 Blended/Specialty Chemicals | |
    3. 9.3 By End-user Industry | | |
      1. 9.3.1 Power Generation | | |
      2. 9.3.2 Steel and Metal Industry | | |
      3. 9.3.3 Oil Refinery | | |
      4. 9.3.4 Chemical & Petrochemical | | |
      5. 9.3.5 Textile and Dye Industry | | |
      6. 9.3.6 Sugar Mill | | |
      7. 9.3.7 Food and Beverage | | |
      8. 9.3.8 Other End-user Industries | |
  10. 10 Competitive Landscape | |
  11. 11 Recent News & Developments | |
  12. 12 Report Scope and Methodology | |
  13. 13 Detailed Sources and Citations | |
  14. 14 Frequently Asked Questions (FAQs) | | LIST OF TABLES | |
  15. TABLE 1 Report Snapshot — Key Market Parameters, 2025–2035 | |
  16. TABLE 2 Global Market Size & Forecast, by Revenue (USD Billion), 2021–2035 | |
  17. TABLE 3 Driver Impact Analysis on CAGR, 2026–2035 | |
  18. TABLE 4 Restraints Impact Analysis on CAGR, 2026–2035 | |
  19. TABLE 5 Regional Summary — Key Metrics and Investment Themes, 2025 | |
  20. TABLE 6 Asia-Pacific Country-Level Analysis, 2025 | |
  21. TABLE 7 North America Country-Level Analysis, 2025 | |
  22. TABLE 8 Europe Country-Level Analysis, 2025 | |
  23. TABLE 9 South America Country-Level Analysis, 2025 | |
  24. TABLE 10 Middle-East & Africa Country-Level Analysis, 2025 | |
  25. TABLE 11 Segmentation by Type, 2025 | |
  26. TABLE 12 Segmentation by Application, 2025 | |
  27. TABLE 13 Segmentation by End-user Industry, 2025 | |
  28. TABLE 14 Competitive Benchmarking Matrix, 2025 | |
  29. TABLE 15 Report Scope and Methodology | |
  30. TABLE 16 Detailed Sources and Citations | |
  31. TABLE 17 Segmentation Quick Reference | |
  32. TABLE 18 Type — Sub-Segment Key Trends | |
  33. TABLE 19 Application — Sub-Segment Key Trends | |
  34. TABLE 20 End-user Industry — Sub-Segment Key Trends | | LIST OF FIGURES | |
  35. FIGURE 1 Market Dynamics Overview — Drivers, Restraints and Opportunities | |
  36. FIGURE 2 Industry Value Chain Analysis | |
  37. FIGURE 3 Porter's Five Forces Analysis | |
  38. FIGURE 4 Global Market Size Trend, 2021–2035 (USD Billion) | |
  39. FIGURE 5 Market Share by Type, 2025 (%) | |
  40. FIGURE 6 Market Share by Application, 2025 (%) | |
  41. FIGURE 7 Market Share by End-user Industry, 2025 (%) | |
  42. FIGURE 8 Regional Market Share, 2025 (%) | |
  43. FIGURE 9 Asia-Pacific Country Share, 2025 (%) | |
  44. FIGURE 10 Competitive Landscape Positioning Matrix, 2025 | |
  45. FIGURE 11 Top-5 Supplier Revenue Share Estimate, 2025

Segmentation Quick Reference

DimensionSub-SegmentsDominant SegmentFastest Growing Segment
By TypeScale and Corrosion Inhibitors; Coagulants & Flocculants; pH Boosters; Oxygen Scavengers; OthersScale and Corrosion Inhibitors (38.6% share)Oxygen Scavengers (6.4% CAGR)
By ApplicationBasic Chemicals; Blended/Specialty ChemicalsBasic Chemicals (USD 2.49 Billion)Blended/Specialty Chemicals (6.3% CAGR)
By End-user IndustryPower Generation; Steel and Metal Industry; Oil Refinery; Chemical & Petrochemical; Textile and Dye Industry; Sugar Mill; Food and Beverage; Other End-user IndustriesPower Generation (34.2% share)Food and Beverage (6.8% CAGR)
By RegionAsia-Pacific; North America; Europe; South America; Middle-East & AfricaAsia-Pacific (41.2% share)Asia-Pacific (6.6% CAGR)


Market Segmentation Overview

By Type

Sub-SegmentKey Trend
Scale and Corrosion InhibitorsShift from phosphate to all-polymer and phosphonate-free programs
Coagulants & FlocculantsPretreatment demand rises with lower-quality makeup water
pH BoostersHigh-purity amines replace caustic in supercritical units
Oxygen ScavengersCarbohydrazide and DEHA displace hydrazine
OthersFilm-forming amines gain acceptance for cycling plants


Scale and Corrosion Inhibitors lead at a 38.6% share because deposit and metal-loss control is required across every boiler pressure class. Oxygen Scavengers grow fastest at a 6.4% CAGR, as REACH pressure on hydrazine forces reformulation to carbohydrazide and DEHA. pH Boosters are gaining importance in drumless supercritical units where tight cation conductivity limits rule out solid-based treatment.

By Application

Sub-SegmentKey Trend
Basic ChemicalsUtilities retain in-house dosing of commodity caustic and sulfite
Blended/Specialty ChemicalsMulti-functional programs bundled with monitoring services


Basic Chemicals remain the larger application at USD 2.49 billion, supported by large utilities with in-house chemistry teams that buy commodity inputs. Blended/Specialty Chemicals grow faster at a 6.3% CAGR because single-product programs cut dosing points and simplify compliance documentation. Smaller industrial operators without laboratory staff drive most of that shift.

By End-user Industry

Sub-SegmentKey Trend
Power GenerationSupercritical additions in Asia offset OECD coal retirements
Steel and Metal IndustryWaste-heat recovery boilers expand captive steam
Oil RefineryHydrotreating capacity raises high-pressure steam needs
Chemical & PetrochemicalIntegrated complexes demand continuous monitored programs
Textile and Dye IndustryCost-driven small boilers with low treatment penetration
Sugar MillSeasonal bagasse cogeneration creates layup-corrosion risk
Food and BeverageFood-contact additive compliance drives premium programs
Other End-user IndustriesPulp mills and pharmaceutical clean steam add niche demand


Power Generation leads at a 34.2% share, as utility boilers consume the largest chemical volumes and require the strictest cycle chemistry. Food and Beverage grows fastest at a 6.8% CAGR, driven by new processing capacity and limits on amines permitted in culinary steam. Sugar Mill and Textile and Dye Industry users remain underpenetrated, offering volume upside as treatment awareness improves.




Download PDF ×

We do not share your information with anyone. However, we may send you emails based on your report interest from time to time. You may contact us at any time to opt-out.