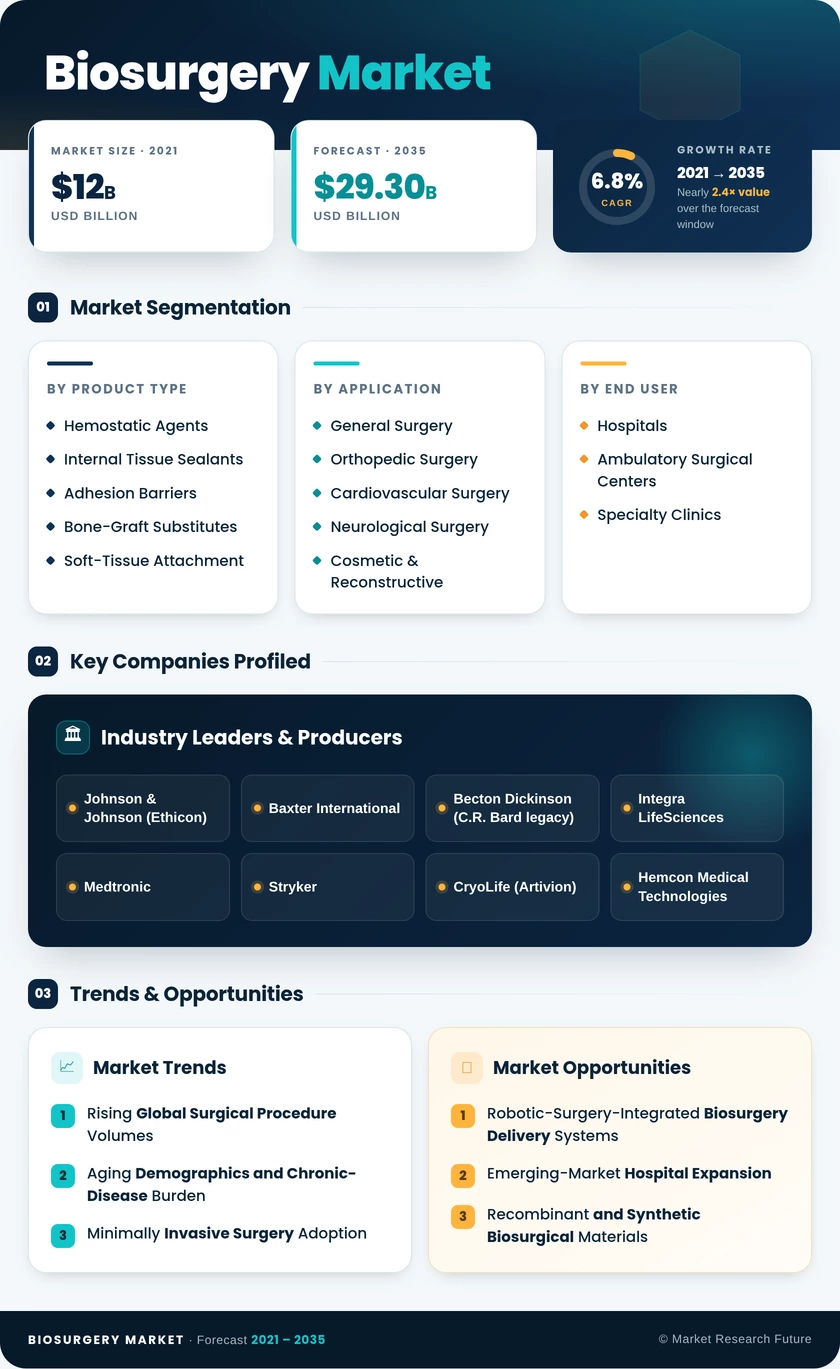
Certified Global Research Member
Isomar fd.webp Wcrc 57.webp
Key Questions Answered
  • Global Market Outlook
  • In-depth analysis of global and regional trends
  • Analyze and identify the major players in the market, their market share, key developments, etc.
  • To understand the capability of the major players based on products offered, financials, and strategies.
  • Identify disrupting products, companies, and trends.
  • To identify opportunities in the market.
  • Analyze the key challenges in the market.
  • Analyze the regional penetration of players, products, and services in the market.
  • Comparison of major playersโ€™ financial performance.
  • Evaluate strategies adopted by major players.
  • Recommendations
Why Choose Market Research Future?
  • Vigorous research methodologies for specific market.
  • Knowledge partners across the globe
  • Large network of partner consultants.
  • Ever-increasing/ Escalating data base with quarterly monitoring of various markets
  • Trusted by fortune 500 companies/startups/ universities/organizations
  • Large database of 5000+ markets reports.
  • Effective and prompt pre- and post-sales support.

Biosurgery Market Size, Growth and Analysis by Product (Bone-Graft Substitutes, Hemostatic Agents, Soft-Tissue Attachments, and Others), Source (Biological Products, Synthetic Products), Application (Neurological Surgery and Others)โ€”Global Forecast till 2032


ID: MRFR/MED/4785-HCR | 100 Pages | Author: Rahul Gotadki| April 2024
Leading companies partner with us for data-driven Insights
client_1 client_2 client_3 client_4 client_5 client_6 client_7 client_8 client_9 client_10
Please fill in Business Email for Quick Response

Table of Contents:

Chapter 1. Report Prologue

Chapter 2. Market Introduction

2.1 Definition

2.2 Scope of the Study

2.2.1 Research Objective

2.2.2 Assumptions

2.2.3 Limitations

Chapter 3. Research Methodology

3.1 Introduction

3.2 Primary Research

3.3 Secondary Research

3.4 Market Size Estimation

Chapter 4. Market Dynamics

4.1 Drivers

4.2 Restraints

4.3 Opportunities

4.4 Challenges

4.5 Macroeconomic Indicators

4.6 Technology Trends & Assessment

Chapter 5. Market Factor Analysis

5.1 Porterโ€™s Five Forces Analysis

5.1.1 Bargaining Power of Suppliers

5.1.2 Bargaining Power of Buyers

5.1.3 Threat of New Entrants

5.1.4 Threat of Substitutes

5.1.5 Intensity of Rivalry

5.2 Value Chain Analysis

5.3 Investment Feasibility Analysis

5.4 Pricing Analysis

Chapter 6. Global Biosurgery Market, by Product

6.1 Introduction

6.2 Bone-Graft Substitutes

6.2.1 Demineralized Bone Matrix

Market Estimates & Forecast, by Region, 2018โ€“2023

Market Estimates & Forecast, by Country, 2018โ€“2023

6.2.2 Synthetic Bone Grafts

Market Estimates & Forecast, by Region, 2018โ€“2023

Market Estimates & Forecast, by Country, 2018โ€“2023

6.2.3 Bone Morphogenetic Proteins

Market Estimates & Forecast, by Region, 2018โ€“2023

Market Estimates & Forecast, by Country, 2018โ€“2023

6.2.4 Other Bone-Graft Substitutes

Market Estimates & Forecast, by Region, 2018โ€“2023

Market Estimates & Forecast, by Country, 2018โ€“2023

6.3 Hemostatic Agents

6.3.1 Thrombin-Based Hemostatic Agents

Market Estimates & Forecast, by Region, 2018โ€“2023

Market Estimates & Forecast, by Country, 2018โ€“2023

6.3.2 Oxidized Regenerated Cellulose-Based Hemostatic Agents

Market Estimates & Forecast, by Region, 2018โ€“2023

Market Estimates & Forecast, by Country, 2018โ€“2023

6.3.3 Combination Hemostatic Agents

Market Estimates & Forecast, by Region, 2018โ€“2023

Market Estimates & Forecast, by Country, 2018โ€“2023

6.4 Soft-Tissue Attachments

6.4.1 Synthetic Meshes

Market Estimates & Forecast, by Region, 2018โ€“2023

Market Estimates & Forecast, by Country, 2018โ€“2023

6.4.2 Biological Meshes

Market Estimates & Forecast, by Region, 2018โ€“2023

Market Estimates & Forecast, by Country, 2018โ€“2023

6.5 Surgical Sealants and Adhesives

6.5.1 Natural Sealants and Adhesives

6.5.1.1 Fibrin Sealants

Market Estimates & Forecast, by Region, 2018โ€“2023

Market Estimates & Forecast, by Country, 2018โ€“2023

6.5.1.2 Collagen-Based Sealants

Market Estimates & Forecast, by Region, 2018โ€“2023

Market Estimates & Forecast, by Country, 2018โ€“2023

6.5.1.3 Gelatin-Based Sealants

Market Estimates & Forecast, by Region, 2018โ€“2023

Market Estimates & Forecast, by Country, 2018โ€“2023

6.5.1.4 Albumin-Based Sealants

Market Estimates & Forecast, by Region, 2018โ€“2023

Market Estimates & Forecast, by Country, 2018โ€“2023

6.5.1.5 Other Natural Sealants

Market Estimates & Forecast, by Region, 2018โ€“2023

Market Estimates & Forecast, by Country, 2018โ€“2023

6.5.2 Synthetic Sealants and Adhesives

6.5.2.1 Peg Hydrogels

Market Estimates & Forecast, by Region, 2018โ€“2023

Market Estimates & Forecast, by Country, 2018โ€“2023

6.5.2.2 Cyanoacrylate-Based Sealants and Adhesives

Market Estimates & Forecast, by Region, 2018โ€“2023

Market Estimates & Forecast, by Country, 2018โ€“2023

6.5.2.3 Urethane-Based Sealants and Adhesives

Market Estimates & Forecast, by Region, 2018โ€“2023

Market Estimates & Forecast, by Country, 2018โ€“2023

6.5.2.4 Other Synthetic Sealants and Adhesives

Market Estimates & Forecast, by Region, 2018โ€“2023

Market Estimates & Forecast, by Country, 2018โ€“2023

6.6 Adhesion Barriers

6.6.1 Synthetic Adhesion Barriers

6.6.1.1 Hyaluronic Acid-Based Adhesion Barriers

Market Estimates & Forecast, by Region, 2018โ€“2023

Market Estimates & Forecast, by Country, 2018โ€“2023

6.6.1.2 Regenerated Cellulose-Based Adhesion Barriers

Market Estimates & Forecast, by Region, 2018โ€“2023

Market Estimates & Forecast, by Country, 2018โ€“2023

6.6.1.3 Peg-Based Adhesion Barriers

Market Estimates & Forecast, by Region, 2018โ€“2023

Market Estimates & Forecast, by Country, 2018โ€“2023

6.6.1.4 Ther Synthetic Adhesion Barriers

Market Estimates & Forecast, by Region, 2018โ€“2023

Market Estimates & Forecast, by Country, 2018โ€“2023

6.6.2 Natural Adhesion Barriers

6.6.2.1 Collagen & Protein Adhesion Barriers

Market Estimates & Forecast, by Region, 2018โ€“2023

Market Estimates & Forecast, by Country, 2018โ€“2023

6.6.2.2 Fibrin-Based Adhesion Barriers

Market Estimates & Forecast, by Region, 2018โ€“2023

Market Estimates & Forecast, by Country, 2018โ€“2023

6.7 Staple-Line Reinforcement Agents

Market Estimates & Forecast, by Region, 2018โ€“2023

Market Estimates & Forecast, by Country, 2018โ€“2023

Chapter 7. Global Biosurgery Market, by Source

7.1 Introduction

7.2 Biologics Products

Market Estimates & Forecast, by Region, 2018โ€“2023

Market Estimates & Forecast, by Country, 2018โ€“2023

7.3 Synthetic Products

Market Estimates & Forecast, by Region, 2018โ€“2023

Market Estimates & Forecast, by Country, 2018โ€“2023

Chapter 8. Global Biosurgery Market, by Application

8.1 Introduction

8.2 Neurological Surgery

Market Estimates & Forecast, by Region, 2018โ€“2023

Market Estimates & Forecast, by Country, 2018โ€“2023

8.3 General Surgery

Market Estimates & Forecast, by Region, 2018โ€“2023

Market Estimates & Forecast, by Country, 2018โ€“2023

8.4 Cardiovascular Surgery

Market Estimates & Forecast, by Region, 2018โ€“2023

Market Estimates & Forecast, by Country, 2018โ€“2023

8.5 Orthopedic Surgery

Market Estimates & Forecast, by Region, 2018โ€“2023

Market Estimates & Forecast, by Country, 2018โ€“2023

8.6 Thoracic Surgery

Market Estimates & Forecast, by Region, 2018โ€“2023

Market Estimates & Forecast, by Country, 2018โ€“2023

8.7 Gynecology Surgery

Market Estimates & Forecast, by Region, 2018โ€“2023

Market Estimates & Forecast, by Country, 2018โ€“2023

8.8 Reconstructive Surgery

Market Estimates & Forecast, by Region, 2018โ€“2023

Market Estimates & Forecast, by Country, 2018โ€“2023

8.9 Urology Surgery

Market Estimates & Forecast, by Region, 2018โ€“2023

Market Estimates & Forecast, by Country, 2018โ€“2023

Chapter 9. Global Biosurgery Market, by Region

9.1 Introduction

9.2 Americas

9.2.1 North America

9.2.1.1 US

9.2.1.2 Canada

9.2.2 South America

9.3 Europe

9.3.1 Western Europe

9.3.1.1 Germany

9.3.1.2 France

9.3.1.3 Italy

9.3.1.4 Spain

9.3.1.5 UK

9.3.1.6 Rest of Western Europe

9.3.2 Eastern Europe

9.4 Asia-Pacific

9.4.1 Japan

9.4.2 China

9.4.3 India

9.4.4 Australia

9.4.5 South Korea

9.4.6 Rest of Asia-Pacific

9.5 Middle East & Africa

9.5.1 Middle East

9.5.2 Africa

Chapter 10. Company Landscape

10.1 Introduction

10.2 Market Share Analysis

10.3 Key Development & Strategies

Chapter 11. Company Profiles

11.1 B.Braun Melsungen AG

11.1.1 Company Overview

11.1.2 Product Overview

11.1.3 Financials Overview

11.1.4 Key Developments

11.1.5 SWOT Analysis

11.2 Baxter International, Inc.

11.2.1 Company Overview

11.2.2 Product Overview

11.2.3 Financial Overview

11.2.4 Key Developments

11.2.5 SWOT Analysis

11.3 Johnson & Johnson

11.3.1 Company Overview

11.3.2 Product Overview

11.3.3 Financial Overview

11.3.4 Key Development

11.3.5 SWOT Analysis

11.4 C.R. Bard

11.4.1 Company Overview

11.4.2 Technology/Business Segment Overview

11.4.3 Financial Overview

11.4.4 Key Development

11.4.5 SWOT Analysis

11.5 Medtronic, PLC.

11.5.1 Company Overview

11.5.2 Product Overview

11.5.3 Financial overview

11.5.4 Key Developments

11.5.5 SWOT Analysis

11.6 MAQUET Holding B.V. & Co. Kg. (Getinge Group)

11.6.1 Company Overview

11.6.2 Product Overview

11.6.3 Financial Overview

11.6.4 Key Developments

11.6.5 SWOT Analysis

11.7 Cohera Medical Inc.

11.7.1 Overview

11.7.2 Product Overview

11.7.3 Financial Overview

11.7.4 Key Developments

11.7.5 SWOT Analysis

11.8 Integra Lifesciences Holdings Corporation

11.8.1 Overview

11.8.2 Product/ Technology Overview

11.8.3 Financials

11.8.4 Key Developments

11.8.5 SWOT Analysis

11.9 Commonwealth Serum Laboratories (CSL)

11.9.1 Overview

11.9.2 Product Overview

11.9.3 Financials

11.9.4 Key Developments

11.9.5 SWOT Analysis

11.10 Hemostasis, LLC

11.10.1 Overview

11.10.2 Product Overview

11.10.3 Financials

11.10.4 Key Developments

11.10.5 SWOT Analysis

11.11 Sanofi

11.11.1 Overview

11.11.2 Product Overview

11.11.3 Financials

11.11.4 Key Developments

11.11.5 SWOT Analysis

11.12 Stryker Corporation

11.12.1 Overview

11.12.2 Product Overview

11.12.3 Financials

11.12.4 Key Developments

11.12.5 SWOT Analysis

11.13 Pfizer Inc.

11.13.1 Overview

11.13.2 Product Overview

11.13.3 Financials

11.13.4 Key Developments

11.13.5 SWOT Analysis

11.14 Cryolife, Inc.

11.14.1 Overview

11.14.2 Product Overview

11.14.3 Financials

11.14.4 Key Developments

11.14.5 SWOT Analysis

11.15 Kuros Biosciences Ltd.

11.15.1 Overview

11.15.2 Product Overview

11.15.3 Financials

11.15.4 Key Developments

11.15.5 SWOT Analysis

Chapter 12 MRFR Conclusion

12.1 Key Findings

12.1.1 From CEOโ€™s Viewpoint

12.1.2 Unmet Needs of the Market

12.2 Key Companies to Watch

12.3 Predictions for the Biosurgery Industry

Chapter 13. Appendix

LIST OF TABLES

Table 1 Global Biosurgery Market Synopsis, 2018โ€“2023

Table 2 Global Biosurgery Market Estimates and Forecast, 2018โ€“2023 (USD Million)

Table 3 Global Biosurgery Market, by Region, 2018โ€“2023 (USD Million)

Table 4 Global Biosurgery Market, by Product, 2018โ€“2023 (USD Million)

Table 5 Global Biosurgery Market, by Source, 2018โ€“2023 (USD Million)

Table 6 Global Biosurgery Market, by Application, 2018โ€“2023 (USD Million)

Table 7 North America: Biosurgery Market, by Product, 2018โ€“2023 (USD

Million)

Table 8 North America: Biosurgery Market, by Source, 2018โ€“2023 (USD

Million)

Table 9 North America: Biosurgery Market, by Application, 2018โ€“2023 (USD

Million)

Table 10 US: Biosurgery Market, by Product, 2018โ€“2023 (USD Million)

Table 11 US: Biosurgery Market, by Source, 2018โ€“2023 (USD Million)

Table 12 US: Biosurgery Market, by Application, 2018โ€“2023 (USD Million)

Table 13 Canada: Biosurgery Market, by Product, 2018โ€“2023 (USD Million)

Table 14 Canada: Biosurgery Market, by Source, 2018โ€“2023 (USD Million)

Table 15 Canada: Biosurgery Market, by Application, 2018โ€“2023 (USD

Million)

Table 16 South America: Biosurgery Market, by Product, 2018โ€“2023 (USD

Million)

Table 17 South America: Biosurgery Market, by Source, 2018โ€“2023 (USD

Million)

Table 18 South America: Biosurgery Market, by Application, 2018โ€“2023 (USD

Million)

Table 19 Europe: Biosurgery Market, by Product, 2018โ€“2023 (USD Million)

Table 20 Europe: Biosurgery Market, by Source, 2018โ€“2023 (USD Million)

Table 21 Europe: Biosurgery Market, by Application, 2018โ€“2023 (USD Million)

Table 22 Western Europe: Biosurgery Market, by Product, 2018โ€“2023 (USD

Million)

Table 23 Western Europe: Biosurgery Market, by Source, 2018โ€“2023 (USD

Million)

Table 24 Western Europe: Biosurgery Market, by Application, 2018โ€“2023

(USD Million)

Table 25 Eastern Europe: Biosurgery Market, by Product, 2018โ€“2023 (USD

Million)

Table 26 Eastern Europe: Biosurgery Market, by Source, 2018โ€“2023 (USD

Million)

Table 27 Eastern Europe: Biosurgery Market, by Application, 2018โ€“2023

(USD Million)

Table 28 Asia-Pacific: Biosurgery Market, by Product, 2018โ€“2023 (USD

Million)

Table 29 Asia-Pacific: Biosurgery Market, by Source, 2018โ€“2023 (USD

Million)

Table 30 Asia-Pacific: Biosurgery Market, by Application, 2018โ€“2023 (USD

Million)

Table 31 Middle East & Africa: Biosurgery Market, by Product, 2018โ€“2023

(USD Million)

Table 32 Middle East & Africa: Biosurgery Market, by Source, 2018โ€“2023

(USD Million)

Table 33 Middle East & Africa: Biosurgery Market, by Application, 2018โ€“2023

(USD Million)

LIST OF FIGURES

Figure 1 Research Process

Figure 2 Segmentation for Global Biosurgery Market

Figure 3 Segmentation Market Dynamics for Global Biosurgery Market

Figure 4 Global Biosurgery Market Share, by Product, 2020

Figure 5 Global Biosurgery Market Share, by Source, 2020

Figure 6 Global Biosurgery Market Share, by Application, 2020

Figure 7 Global Biosurgery Market Share, by Region, 2020

Figure 8 North America: Biosurgery Market Share, by Country, 2020

Figure 9 Europe: Biosurgery Market Share, by Country, 2020

Figure 10 Asia-Pacific: Biosurgery Market Share, by Country, 2020

Figure 11 Middle East & Africa: Biosurgery Market Share, by Country, 2020

Figure 12 Global Biosurgery Market: Company Share Analysis, 2020 (%)

Figure 13 B.Braun Melsungen AG: Key Financials

Figure 14 B.Braun Melsungen AG: Segmental Revenue

Figure 15 B.Braun Melsungen AG: Geographical Revenue

Figure 16 Baxter International, Inc.: Key Financials

Figure 17 Baxter International, Inc.: Segmental Revenue

Figure 18 Baxter International, Inc.: Geographical Revenue

Figure 19 Johnson & Johnson: Key Financials

Figure 20 Johnson & Johnson: Segmental Revenue

Figure 21 Johnson & Johnson: Geographical Revenue

Figure 22 C.R. Bard: Key Financials

Figure 23 C.R. Bard: Segmental Revenue

Figure 24 C.R. Bard: Geographical Revenue

Figure 25 Medtronic, PLC.: Key Financials

Figure 26 Medtronic, PLC.: Segmental Revenue

Figure 27 Medtronic, PLC.. Geographical Revenue

Figure 28 MAQUET Holding B.V. & Co. Kg. (Getinge Group): Key Financials

Figure 29 MAQUET Holding B.V. & Co. Kg. (Getinge Group): Segmental Revenue

Figure 30 MAQUET Holding B.V. & Co. Kg. (Getinge Group): Geographical Revenue

Figure 31 Cohera Medical Inc.: Key Financials

Figure 32 Cohera Medical Inc.: Segmental Revenue

Figure 33 Cohera Medical Inc.: Geographical Revenue

Figure 34 Integra Lifesciences Holdings Corporation: Key Financials

Figure 35 Integra Lifesciences Holdings Corporation: Segmental Revenue

Figure 36 Integra Lifesciences Holdings Corporation: Geographical Revenue

Figure 37 Commonwealth Serum Laboratories (CSL) : Key Financials

Figure 38 Commonwealth Serum Laboratories (CSL) : Segmental Revenue

Figure 39 Commonwealth Serum Laboratories (CSL) : Geographical Revenue

Figure 40 Hemostasis, LLC: Key Financials

Figure 41 Hemostasis, LLC: Segmental Revenue

Figure 42 Hemostasis, LLC: Geographical Revenue

Figure 43 Sanofi: Key Financials

Figure 44 Sanofi: Segmental Revenue

Figure 45 Sanofi: Geographical Revenue

Figure 46 Stryker Corporation: Key Financials

Figure 47 Stryker Corporation: Segmental Revenue

Figure 48 Stryker Corporation: Geographical Revenue

Figure 49 Pfizer, Inc.: Key Financials

Figure 50 Pfizer, Inc.: Segmental Revenue

Figure 51 Pfizer, Inc.: Geographical Revenue

Figure 52 Cryolife, Inc.: Key Financials

Figure 53 Cryolife, Inc.: Segmental Revenue

Figure 54 Cryolife, Inc.: Geographical Revenue

Figure 55 Kuros Biosciences Ltd.: Key Financials

Figure 56 Kuros Biosciences Ltd.: Segmental Revenue

Figure 57 Kuros Biosciences Ltd.: Geographical Revenue

Purchase Option
Single User $ 4,950
Multiuser License $ 5,950
Enterprise User $ 7,250
Compare Licenses
Tailored for You
  • Dedicated Research on any specifics segment or region.
  • Focused Research on specific players in the market.
  • Custom Report based only on your requirements.
  • Flexibility to add or subtract any chapter in the study.
  • Historic data from 2014 and forecasts outlook till 2040.
  • Flexibility of providing data/insights in formats (PDF, PPT, Excel).
  • Provide cross segmentation in applicable scenario/markets.