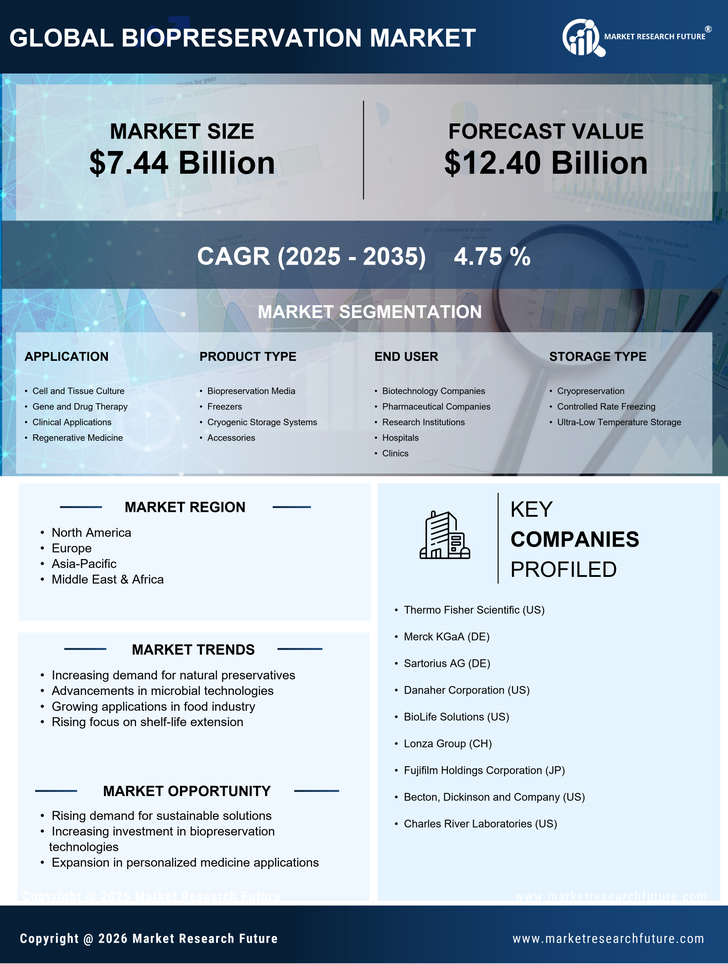
Certified Global Research Member
Isomar fd.webp Wcrc 57.webp
Key Questions Answered
  • Global Market Outlook
  • In-depth analysis of global and regional trends
  • Analyze and identify the major players in the market, their market share, key developments, etc.
  • To understand the capability of the major players based on products offered, financials, and strategies.
  • Identify disrupting products, companies, and trends.
  • To identify opportunities in the market.
  • Analyze the key challenges in the market.
  • Analyze the regional penetration of players, products, and services in the market.
  • Comparison of major players’ financial performance.
  • Evaluate strategies adopted by major players.
  • Recommendations
Why Choose Market Research Future?
  • Vigorous research methodologies for specific market.
  • Knowledge partners across the globe
  • Large network of partner consultants.
  • Ever-increasing/ Escalating data base with quarterly monitoring of various markets
  • Trusted by fortune 500 companies/startups/ universities/organizations
  • Large database of 5000+ markets reports.
  • Effective and prompt pre- and post-sales support.

Biopreservation Market Research Information: By Product (Media, Equipment), Biospecimen (Human Tissue Sample, Stem Cell), Application (Regenerative Medicine (Gene Therapy, Cell Therapy), Biobanking (Human Egg), Drug Discovery)–Global Forecast Till 2032


ID: MRFR/MED/4946-HCR | 100 Pages | Author: Rahul Gotadki| April 2024
Leading companies partner with us for data-driven Insights
client_1 client_2 client_3 client_4 client_5 client_6 client_7 client_8 client_9 client_10
Please fill in Business Email for Quick Response

Table of Contents:

Chapter 1. Report Prologue

Chapter 2. Market Introduction

2.1 Definition

2.2 Scope of the Study

2.2.1 Research Objective

2.2.2 Assumptions

2.2.3 Limitations

Chapter 3. Research Methodology

3.1 Introduction

3.2 Primary Research

3.3 Secondary Research

3.4 Market Size Estimation

Chapter 4. Market Dynamics

4.1 Drivers

4.2 Restraints

4.3 Opportunities

4.4 Challenges

4.5 Macroeconomic Indicators

4.6 Technology Trends & Assessment

Chapter 5. Market Factor Analysis

5.1 Porter’s Five Forces Analysis

5.1.1 Bargaining Power of Suppliers

5.1.2 Bargaining Power of Buyers

5.1.3 Threat of New Entrants

5.1.4 Threat of Substitutes

5.1.5 Intensity of Rivalry

5.2 Value Chain Analysis

5.3 Investment Feasibility Analysis

5.4 Pricing Analysis

Chapter 6. Global Biopreservation Market, by Product

6.1 Introduction

6.2 Media

6.2.1 Nutrient Media

Market Estimates & Forecast, by Region, 2023-2032

Market Estimates & Forecast, by Country, 2023-2032

6.2.2 Sera

Market Estimates & Forecast, by Region, 2023-2032

Market Estimates & Forecast, by Country, 2023-2032

6.2.3 Growth Factors and Supplements

Market Estimates & Forecast, by Region, 2023-2032

Market Estimates & Forecast, by Country, 2023-2032

6.3 Equipment

6.3.1 Temperature Control Systems

6.3.1.1 Freezers

Market Estimates & Forecast, by Region, 2023-2032

Market Estimates & Forecast, by Country, 2023-2032

6.3.1.2 Cryogenic Storage Systems

Market Estimates & Forecast, by Region, 2023-2032

Market Estimates & Forecast, by Country, 2023-2032

6.3.1.3 Thawing Equipment

Market Estimates & Forecast, by Region, 2023-2032

Market Estimates & Forecast, by Country, 2023-2032

6.3.1.4 Refrigerators

Market Estimates & Forecast, by Region, 2023-2032

Market Estimates & Forecast, by Country, 2023-2032

6.3.2 Accessories

Market Estimates & Forecast, by Region, 2023-2032

Market Estimates & Forecast, by Country, 2023-2032

6.3.3 Alarms & Monitoring Systems

Market Estimates & Forecast, by Region, 2023-2032

Market Estimates & Forecast, by Country, 2023-2032

6.3.4 Incubators

Market Estimates & Forecast, by Region, 2023-2032

Market Estimates & Forecast, by Country, 2023-2032

6.3.5 Centrifuges

Market Estimates & Forecast, by Region, 2023-2032

Market Estimates & Forecast, by Country, 2023-2032

6.3.6 Other Equipment

Market Estimates & Forecast, by Region, 2023-2032

Market Estimates & Forecast, by Country, 2023-2032

Chapter 7. Global Biopreservation Market, by Biospecimen

7.1 Introduction

7.2 Human Tissue Samples

Market Estimates & Forecast, by Region, 2023-2032

Market Estimates & Forecast, by Country, 2023-2032

7.3 Organs

Market Estimates & Forecast, by Region, 2023-2032

Market Estimates & Forecast, by Country, 2023-2032

7.4 Stem Cells

Market Estimates & Forecast, by Region, 2023-2032

Market Estimates & Forecast, by Country, 2023-2032

7.5 Other Biospecimens

Market Estimates & Forecast, by Region, 2023-2032

Market Estimates & Forecast, by Country, 2023-2032

Chapter 8. Global Biopreservation Market, by Application

8.1 Introduction

8.2 Regenerative Medicine

8.2.1 Cell Therapy

Market Estimates & Forecast, by Region, 2023-2032

Market Estimates & Forecast, by Country, 2023-2032

8.2.2 Gene Therapy

Market Estimates & Forecast, by Region, 2023-2032

Market Estimates & Forecast, by Country, 2023-2032

8.2.3 Others

Market Estimates & Forecast, by Region, 2023-2032

Market Estimates & Forecast, by Country, 2023-2032

8.3 Biobanking

8.3.1 Human Eggs

Market Estimates & Forecast, by Region, 2023-2032

Market Estimates & Forecast, by Country, 2023-2032

8.3.2 Human Sperm

Market Estimates & Forecast, by Region, 2023-2032

Market Estimates & Forecast, by Country, 2023-2032

8.3.3 Veterinary IVF

Market Estimates & Forecast, by Region, 2023-2032

Market Estimates & Forecast, by Country, 2023-2032

8.4 Drug Discovery

Market Estimates & Forecast, by Region, 2023-2032

Market Estimates & Forecast, by Country, 2023-2032

Chapter 9. Global Biopreservation Market, by Region

9.1 Introduction

9.2 Americas

9.2.1 North America

9.2.1.1 US

9.2.1.2 Canada

9.2.2 South America

9.3 Europe

9.3.1 Western Europe

9.3.1.1 Germany

9.3.1.2 France

9.3.1.3 Italy

9.3.1.4 Spain

9.3.1.5 UK

9.3.1.6 Rest of Western Europe

9.3.2 Eastern Europe

9.4 Asia-Pacific

9.4.1 Japan

9.4.2 China

9.4.3 India

9.4.4 Australia

9.4.5 South Korea

9.4.6 Rest of Asia-Pacific

9.5 Middle East & Africa

9.5.1 Middle East

9.5.2 Africa

Chapter 10. Company Landscape

10.1 Introduction

10.2 Market Share Analysis

10.3 Key Development & Strategies

Chapter 11. Company Profiles

11.1 Thermo Fisher Scientific, Inc.

11.1.1 Company Overview

11.1.2 Product Overview

11.1.3 Financials Overview

11.1.4 Key Developments

11.1.5 SWOT Analysis

11.2 VWR International, LLC.

11.2.1 Company Overview

11.2.2 Product Overview

11.2.3 Financial Overview

11.2.4 Key Developments

11.2.5 SWOT Analysis

11.3 CUSTOM BIOGENIC SYSTEMS.

11.3.1 Company Overview

11.3.2 Product Overview

11.3.3 Financial Overview

11.3.4 Key Development

11.3.5 SWOT Analysis

11.4 BioLife Solutions, Inc

11.4.1 Company Overview

11.4.2 Technology/Business Segment Overview

11.4.3 Financial Overview

11.4.4 Key Development

11.4.5 SWOT Analysis

11.5 BioCision

11.5.1 Company Overview

11.5.2 Product Overview

11.5.3 Financial overview

11.5.4 Key Developments

11.5.5 SWOT Analysis

11.6 Sigma-Aldrich Co

11.6.1 Company Overview

11.6.2 Product Overview

11.6.3 Financial Overview

11.6.4 Key Developments

11.6.5 SWOT Analysis

11.7 QIAGEN

11.7.1 Overview

11.7.2 Product Overview

11.7.3 Financial Overview

11.7.4 Key Developments

11.7.5 SWOT Analysis

11.8 Lifeline Scientific

11.8.1 Overview

11.8.2 Product/ Technology Overview

11.8.3 Financials

11.8.4 Key Developments

11.8.5 SWOT Analysis

11.9 Cesca Therapeutics

11.9.1 Overview

11.9.2 Product Overview

11.9.3 Financials

11.9.4 Key Developments

11.9.5 SWOT Analysis

11.10 Core Dynamics, Ltd.

11.10.1 Overview

11.10.2 Product Overview

11.10.3 Financials

11.10.4 Key Developments

11.10.5 SWOT Analysis

11.11 Princeton CryoTech

11.11.1 Overview

11.11.2 Product Overview

11.11.3 Financials

11.11.4 Key Developments

11.11.5 SWOT Analysis

11.12 Biomatrica, Inc.

11.12.1 Overview

11.12.2 Product Overview

11.12.3 Financials

11.12.4 Key Developments

11.12.5 SWOT Analysis

11.13 Panasonic Biomedical, Inc.,

11.13.1 Overview

11.13.2 Product Overview

11.13.3 Financials

11.13.4 Key Developments

11.13.5 SWOT Analysis

11.14 Chart Industries

11.14.1 Overview

11.14.2 Product Overview

11.14.3 Financials

11.14.4 Key Developments

11.14.5 SWOT Analysis

11.15 Atlanta Biologicals

11.15.1 Overview

11.15.2 Product Overview

11.15.3 Financials

11.15.4 Key Developments

11.15.5 SWOT Analysis

Chapter 12 MRFR Conclusion

12.1 Key Findings

12.1.1 From CEO’s Viewpoint

12.1.2 Unmet Needs of the Market

12.2 Key Companies to Watch

12.3 Predictions for the Biopreservation Industry

Chapter 13. Appendix

LIST OF TABLES

Table 1 Global Biopreservation Market Synopsis, 2023-2032

Table 2 Global Biopreservation Market Estimates and Forecast, 2023-2032 (USD Million)

Table 3 Global Biopreservation Market, by Region, 2023-2032 (USD Million)

Table 4 Global Biopreservation Market, by Product, 2023-2032 (USD Million)

Table 5 Global Biopreservation Market, by Biospecimen, 2023-2032 (USD Million)

Table 6 Global Biopreservation Market, by Application, 2023-2032 (USD Million)

Table 7 North America: Biopreservation Market, by Product, 2023-2032 (USD

Million)

Table 8 North America: Biopreservation Market, by Biospecimen, 2023-2032 (USD

Million)

Table 9 North America: Biopreservation Market, by Application, 2023-2032 (USD

Million)

Table 10 US: Biopreservation Market, by Product, 2023-2032 (USD Million)

Table 11 US: Biopreservation Market, by Biospecimen, 2023-2032 (USD Million)

Table 12 US: Biopreservation Market, by Application, 2023-2032 (USD Million)

Table 13 Canada: Biopreservation Market, by Product, 2023-2032 (USD Million)

Table 14 Canada: Biopreservation Market, by Biospecimen, 2023-2032 (USD Million)

Table 15 Canada: Biopreservation Market, by Application, 2023-2032 (USD

Million)

Table 16 South America: Biopreservation Market, by Product, 2023-2032 (USD

Million)

Table 17 South America: Biopreservation Market, by Biospecimen, 2023-2032 (USD

Million)

Table 18 South America: Biopreservation Market, by Application, 2023-2032 (USD

Million)

Table 19 Europe: Biopreservation Market, by Product, 2023-2032 (USD Million)

Table 20 Europe: Biopreservation Market, by Biospecimen, 2023-2032 (USD Million)

Table 21 Europe: Biopreservation Market, by Application, 2023-2032 (USD Million)

Table 22 Western Europe: Biopreservation Market, by Product, 2023-2032 (USD

Million)

Table 23 Western Europe: Biopreservation Market, by Biospecimen, 2023-2032 (USD

Million)

Table 24 Western Europe: Biopreservation Market, by Application, 2023-2032

(USD Million)

Table 25 Eastern Europe: Biopreservation Market, by Product, 2023-2032 (USD

Million)

Table 26 Eastern Europe: Biopreservation Market, by Biospecimen, 2023-2032 (USD

Million)

Table 27 Eastern Europe: Biopreservation Market, by Application, 2023-2032

(USD Million)

Table 28 Asia-Pacific: Biopreservation Market, by Product, 2023-2032 (USD

Million)

Table 29 Asia-Pacific: Biopreservation Market, by Biospecimen , 2023-2032 (USD

Million)

Table 30 Asia-Pacific: Biopreservation Market, by Application, 2023-2032 (USD

Million)

Table 31 Middle East & Africa: Biopreservation Market, by Product, 2023-2032

(USD Million)

Table 32 Middle East & Africa: Biopreservation Market, by Biospecimen, 2023-2032

(USD Million)

Table 33 Middle East & Africa: Biopreservation Market, by Application, 2023-2032

(USD Million)

LIST OF FIGURES

Figure 1 Research Process

Figure 2 Segmentation for Global Biopreservation Market

Figure 3 Segmentation Market Dynamics for Global Biopreservation Market

Figure 4 Global Biopreservation Market Share, by Product, 2023

Figure 5 Global Biopreservation Market Share, by Biospecimen , 2023

Figure 6 Global Biopreservation Market Share, by Application, 2023

Figure 7 Global Biopreservation Market Share, by Region, 2023

Figure 8 North America: Biopreservation Market Share, by Country, 2023

Figure 9 Europe: Biopreservation Market Share, by Country, 2023

Figure 10 Asia-Pacific: Biopreservation Market Share, by Country, 2023

Figure 11 Middle East & Africa: Biopreservation Market Share, by Country, 2023

Figure 12 Global Biopreservation Market: Company Share Analysis, 2023 (%)

Figure 13 Thermo Fisher Scientific, Inc.: Key Financials

Figure 14 Thermo Fisher Scientific, Inc.: Segmental Revenue

Figure 15 Thermo Fisher Scientific, Inc.: Geographical Revenue

Figure 16 VWR International, LLC.: Key Financials

Figure 17 VWR International, LLC.: Segmental Revenue

Figure 18 VWR International, LLC.: Geographical Revenue

Figure 19 CUSTOM BIOGENIC SYSTEMS. : Key Financials

Figure 20 CUSTOM BIOGENIC SYSTEMS. : Segmental Revenue

Figure 21 CUSTOM BIOGENIC SYSTEMS. : Geographical Revenue

Figure 22 BioLife Solutions, Inc: Key Financials

Figure 23 BioLife Solutions, Inc: Segmental Revenue

Figure 24 BioLife Solutions, Inc: Geographical Revenue

Figure 25 BioCision: Key Financials

Figure 26 BioCision: Segmental Revenue

Figure 27 BioCision. Geographical Revenue

Figure 28 Sigma-Aldrich Co: Key Financials

Figure 29 Sigma-Aldrich Co: Segmental Revenue

Figure 30 Sigma-Aldrich Co: Geographical Revenue

Figure 31 QIAGEN: Key Financials

Figure 32 QIAGEN: Segmental Revenue

Figure 33 QIAGEN: Geographical Revenue

Figure 34 Lifeline Scientific: Key Financials

Figure 35 Lifeline Scientific: Segmental Revenue

Figure 36 Lifeline Scientific: Geographical Revenue

Figure 37 Cesca Therapeutics: Key Financials

Figure 38 Cesca Therapeutics: Segmental Revenue

Figure 39 Cesca Therapeutics: Geographical Revenue

Figure 40 Core Dynamics, Ltd.: Key Financials

Figure 41 Core Dynamics, Ltd.: Segmental Revenue

Figure 42 Core Dynamics, Ltd.: Geographical Revenue

Figure 43 Princeton CryoTech : Key Financials

Figure 44 Princeton CryoTech : Segmental Revenue

Figure 45 Princeton CryoTech : Geographical Revenue

Figure 46 Biomatrica, Inc.: Key Financials

Figure 47 Biomatrica, Inc.: Segmental Revenue

Figure 48 Biomatrica, Inc.: Geographical Revenue

Figure 49 Panasonic Biomedical, Inc.: Key Financials

Figure 50 Panasonic Biomedical, Inc.: Segmental Revenue

Figure 51 Panasonic Biomedical, Inc.: Geographical Revenue

Figure 52 Chart Industries: Key Financials

Figure 53 Chart Industries: Segmental Revenue

Figure 54 Chart Industries: Geographical Revenue

Figure 55 Atlanta Biologicals: Key Financials

Figure 56 Atlanta Biologicals: Segmental Revenue

Figure 57 Atlanta Biologicals: Geographical Revenue

Purchase Option
Single User $ 4,950
Multiuser License $ 5,950
Enterprise User $ 7,250
Compare Licenses
Tailored for You
  • Dedicated Research on any specifics segment or region.
  • Focused Research on specific players in the market.
  • Custom Report based only on your requirements.
  • Flexibility to add or subtract any chapter in the study.
  • Historic data from 2014 and forecasts outlook till 2040.
  • Flexibility of providing data/insights in formats (PDF, PPT, Excel).
  • Provide cross segmentation in applicable scenario/markets.