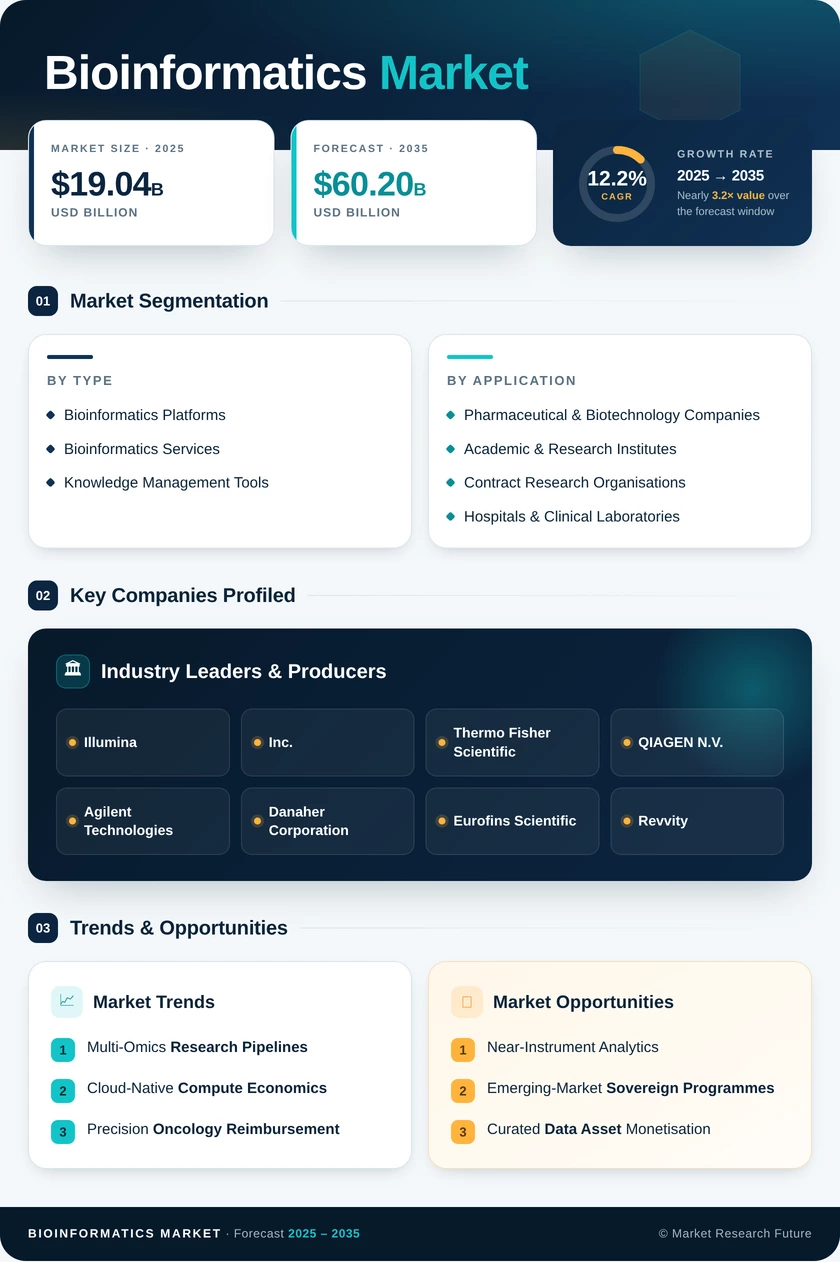
Bioinformatics Market (2026 - 2035)

ID: MRFR/HC/1664-HCR 200 Pages Rahul Gotadki Last Updated: September 15, 2026
Bioinformatics Market Research Report: Size, Share, Trend Analysis By Applications (Genomics, Proteomics, Metabolomics, Translational Bioinformatics, Cheminformatics), By Deployment Type (On-Premise, Cloud-Based, Web-Based), By End-user (Academics, Pharmaceutical Companies, Biotechnology Companies, Research Organizations), By Product Type (Bioinformatics Tools, Bioinformatics Services, Bioinformatics Platforms), and By Regional (North America, Europe, South America, Asia Pacific, Middle East and Africa) - Growth Outlook & Industry Forecast 2025 To 2035
Bioinformatics Market
Market Size
Forecast Period2026-2035
CAGR (2026-2035)12.2%
2025 Market SizeUSD 19.04 Billion
2035 Market SizeUSD 60.20 Billion
Key Players
Illumina, Inc.
Thermo Fisher Scientific
QIAGEN N.V.
Agilent Technologies
Danaher Corporation
Eurofins Scientific
Opportunities
  • Near-Instrument Analytics
  • Emerging-Market Sovereign Programmes
  • Curated Data Asset Monetisation
  1. 1 Market Summary |
    1. 1.1 Study Assumptions & Market Definition |
    2. 1.2 Scope of the Study |
    3. 1.3 Research Methodology
  2. 2 Key Report Takeaways
  3. 3 Market Size & Forecast (2021–2035) |
    1. 3.1 Historical Market Size (2021–2025) |
    2. 3.2 Current & Forecast Market Size (2026–2035) |
    3. 3.3 Year-over-Year Growth Analysis
  4. 4 Driver Impact Analysis |
    1. 4.1 Multi-Omics Research Pipelines |
    2. 4.2 Cloud-Native Compute Economics |
    3. 4.3 Precision Oncology Reimbursement |
    4. 4.4 Population Genomics Programmes
  5. 5 Restraints Impact Analysis |
    1. 5.1 Data Sovereignty Friction |
    2. 5.2 Talent Scarcity |
    3. 5.3 Interoperability Gaps
  6. 6 Opportunities |
    1. 6.1 Near-Instrument Analytics |
    2. 6.2 Emerging-Market Sovereign Programmes |
    3. 6.3 Curated Data Asset Monetisation |
    4. 6.4 Regulated AI Diagnostic Software |
    5. 6.5 CRO Platform Partnerships
  7. 7 Regional Market Share & Country-Level Analysis |
    1. 7.1 North America | |
      1. 7.1.1 US | |
      2. 7.1.2 Canada | |
      3. 7.1.3 Mexico |
    2. 7.2 Europe | |
      1. 7.2.1 Germany | |
      2. 7.2.2 UK | |
      3. 7.2.3 France | |
      4. 7.2.4 Italy | |
      5. 7.2.5 Spain | |
      6. 7.2.6 Nordic Countries | |
      7. 7.2.7 Russia | |
      8. 7.2.8 Rest of Europe |
    3. 7.3 Asia-Pacific | |
      1. 7.3.1 China | |
      2. 7.3.2 India | |
      3. 7.3.3 Japan | |
      4. 7.3.4 South Korea | |
      5. 7.3.5 ASEAN | |
      6. 7.3.6 Rest of Asia-Pacific |
    4. 7.4 South America | |
      1. 7.4.1 Brazil | |
      2. 7.4.2 Argentina | |
      3. 7.4.3 Rest of South America |
    5. 7.5 Middle East & Africa | |
      1. 7.5.1 Saudi Arabia | |
      2. 7.5.2 UAE | |
      3. 7.5.3 South Africa | |
      4. 7.5.4 Egypt | |
      5. 7.5.5 Rest of Middle East & Africa
  8. 8 Future Outlook (2026–2035) |
    1. 8.1 Foundation Models Become Infrastructure |
    2. 8.2 Consumption Pricing Displaces Licensing |
    3. 8.3 Clinical-Grade Validation as Moat |
    4. 8.4 Federated Analysis Across Sovereign Borders
  9. 9 Market Segmentation Analysis |
    1. 9.1 By Products and Services | |
      1. 9.1.1 Knowledge Management Tools | |
      2. 9.1.2 Bioinformatics Platforms | |
      3. 9.1.3 Bioinformatics Services |
    2. 9.2 By Application | |
      1. 9.2.1 Genomics & Transcriptomics | |
      2. 9.2.2 Proteomics & Metabolomics | |
      3. 9.2.3 Chemoinformatics & Drug Design | |
      4. 9.2.4 Other Applications |
    3. 9.3 By End User | |
      1. 9.3.1 Pharmaceutical & Biotechnology Companies | |
      2. 9.3.2 Academic & Research Institutes | |
      3. 9.3.3 Contract Research Organisations | |
      4. 9.3.4 Hospitals & Clinical Laboratories
  10. 10 Competitive Landscape |
    1. 10.1 Market Concentration Analysis (2026) |
    2. 10.2 Competitive Benchmarking Matrix |
    3. 10.3 Company Profiles
  11. 11 Recent News & Developments
  12. 12 Report Scope & Methodology
  13. 13 Detailed Sources & Citations
  14. 14 Frequently Asked Questions
  15. 15 LIST OF TABLES |
  16. TABLE 1 Global Bioinformatics Market Size & Forecast, by Revenue (USD Billion), 2021–2035 |
  17. TABLE 2 Global Bioinformatics Market — Year-over-Year Growth Analysis, 2021–2035 |
  18. TABLE 3 Driver Impact Analysis — Global Bioinformatics Market, 2026–2035 |
  19. TABLE 4 Restraint Impact Analysis — Global Bioinformatics Market, 2026–2035 |
  20. TABLE 5 Global Bioinformatics Market Size, by Region, 2021–2035 (USD Billion) |
  21. TABLE 6 North America Bioinformatics Market Size, by Country, 2021–2035 (USD Billion) |
  22. TABLE 7 Europe Bioinformatics Market Size, by Country, 2021–2035 (USD Billion) |
  23. TABLE 8 Asia-Pacific Bioinformatics Market Size, by Country, 2021–2035 (USD Billion) |
  24. TABLE 9 South America Bioinformatics Market Size, by Country, 2021–2035 (USD Billion) |
  25. TABLE 10 Middle East & Africa Bioinformatics Market Size, by Country, 2021–2035 (USD Billion) |
  26. TABLE 11 Global Bioinformatics Market Size, by Products and Services, 2021–2035 (USD Billion) |
  27. TABLE 12 Global Bioinformatics Market Size, by Application, 2021–2035 (USD Billion) |
  28. TABLE 13 Global Bioinformatics Market Size, by End User, 2021–2035 (USD Billion) |
  29. TABLE 14 North America Bioinformatics Market Size, by Products and Services, 2021–2035 (USD Billion) |
  30. TABLE 15 North America Bioinformatics Market Size, by Application, 2021–2035 (USD Billion) |
  31. TABLE 16 Europe Bioinformatics Market Size, by Products and Services, 2021–2035 (USD Billion) |
  32. TABLE 17 Europe Bioinformatics Market Size, by End User, 2021–2035 (USD Billion) |
  33. TABLE 18 Asia-Pacific Bioinformatics Market Size, by Application, 2021–2035 (USD Billion) |
  34. TABLE 19 Asia-Pacific Bioinformatics Market Size, by End User, 2021–2035 (USD Billion) |
  35. TABLE 20 South America Bioinformatics Market Size, by Products and Services, 2021–2035 (USD Billion) |
  36. TABLE 21 Middle East & Africa Bioinformatics Market Size, by Application, 2021–2035 (USD Billion) |
  37. TABLE 22 Competitive Benchmarking Matrix — Global Bioinformatics Market, 2026 |
  38. TABLE 23 Company Profiles — Key Players, Global Bioinformatics Market |
  39. TABLE 24 Recent Developments & Strategic Announcements, 2023–2025 |
  40. TABLE 25 Report Scope & Methodology Summary |
  41. TABLE 26 Detailed Sources & Citations Index
  42. 16 LIST OF FIGURES |
  43. FIGURE 1 Global Bioinformatics Market — Market Dynamics Overview (Drivers, Restraints, Opportunities) |
  44. FIGURE 2 Industry Value Chain Analysis — Bioinformatics Market |
  45. FIGURE 3 Porter's Five Forces Analysis — Bioinformatics Market |
  46. FIGURE 4 Global Bioinformatics Market Size Trend, 2021–2035 (USD Billion) |
  47. FIGURE 5 Year-over-Year Growth Trajectory, 2022–2035 (%) |
  48. FIGURE 6 Market Share by Products and Services, 2025 vs 2035 (%) |
  49. FIGURE 7 Market Share by Application, 2025 vs 2035 (%) |
  50. FIGURE 8 Market Share by End User, 2025 vs 2035 (%) |
  51. FIGURE 9 Regional Revenue Share Distribution, 2025 (%) |
  52. FIGURE 10 Regional CAGR Comparison, 2026–2035 (%) |
  53. FIGURE 11 North America Country-Level Revenue Split, 2025 (%) |
  54. FIGURE 12 Asia-Pacific Country-Level Revenue Split, 2025 (%) |
  55. FIGURE 13 Competitive Landscape — Estimated Revenue Share Bands, 2026 (%) |
  56. FIGURE 14 Competitive Positioning Matrix — Capability Depth vs Regulatory Readiness |
  57. FIGURE 15 Technology Adoption Curve — Cloud, AI Models and Federated Analysis, 2026–2035

Segmentation Quick Reference

DimensionSub-SegmentsDominant SegmentFastest Growing Segment
By Products and ServicesKnowledge Management Tools; Bioinformatics Platforms; Bioinformatics ServicesBioinformatics PlatformsBioinformatics Services
By ApplicationGenomics & Transcriptomics; Proteomics & Metabolomics; Chemoinformatics & Drug Design; Other ApplicationsGenomics & TranscriptomicsProteomics & Metabolomics
By End UserPharmaceutical & Biotechnology Companies; Academic & Research Institutes; Contract Research Organisations; Hospitals & Clinical LaboratoriesPharmaceutical & Biotechnology CompaniesContract Research Organisations
By GeographyNorth America; Europe; Asia-Pacific; South America; Middle East & AfricaNorth AmericaAsia-Pacific


Market Segmentation Overview

By Products and Services

Sub-SegmentKey Trend
Knowledge Management ToolsCurated evidence corpora shift to subscription licensing with tiered clinical and research access
Bioinformatics PlatformsConsolidation of fragmented tool estates into single validated environments with audit trails
Bioinformatics ServicesManaged interpretation contracts expand as institutions rent expertise they cannot hire


Buyers are converging on fewer suppliers with deeper stacks. Validation burden, not feature count, now decides most competitive evaluations, and vendors that document reproducibility win renewals even where cheaper alternatives exist.

By Application

Sub-SegmentKey Trend
Genomics & TranscriptomicsClinical sequencing volume growth sustains the largest analytical workload pool
Proteomics & MetabolomicsInstrument sensitivity gains push functional validation into mainstream discovery pipelines
Chemoinformatics & Drug DesignGenerative models compress lead optimisation cycles from months toward weeks
Other ApplicationsAgrigenomics, microbiome and forensic use cases diversify demand beyond human health


Application breadth is widening faster than depth. Sponsors that once bought a single genomics tool now specify integrated environments spanning at least three modalities, which raises the technical bar for point-solution vendors.

By End User

Sub-SegmentKey Trend
Pharmaceutical & Biotechnology CompaniesEnterprise informatics budgets shift from project to platform funding
Academic & Research InstitutesGrant-linked purchasing favours consumption pricing over capital equipment
Contract Research OrganisationsSponsor outsourcing makes CROs a primary distribution channel for software vendors
Hospitals & Clinical LaboratoriesReimbursement expansion converts genomic interpretation into recurring billable service


End-user economics diverge sharply. Clinical buyers optimise for turnaround and regulatory defensibility, while discovery buyers optimise for flexibility and model access, and few vendors serve both without separate product lines.


 

Download PDF ×

We do not share your information with anyone. However, we may send you emails based on your report interest from time to time. You may contact us at any time to opt-out.