ID: MRFR/AM/5811-HCR | February 2021 | Region: Global | 100 pages
Market Synopsis:
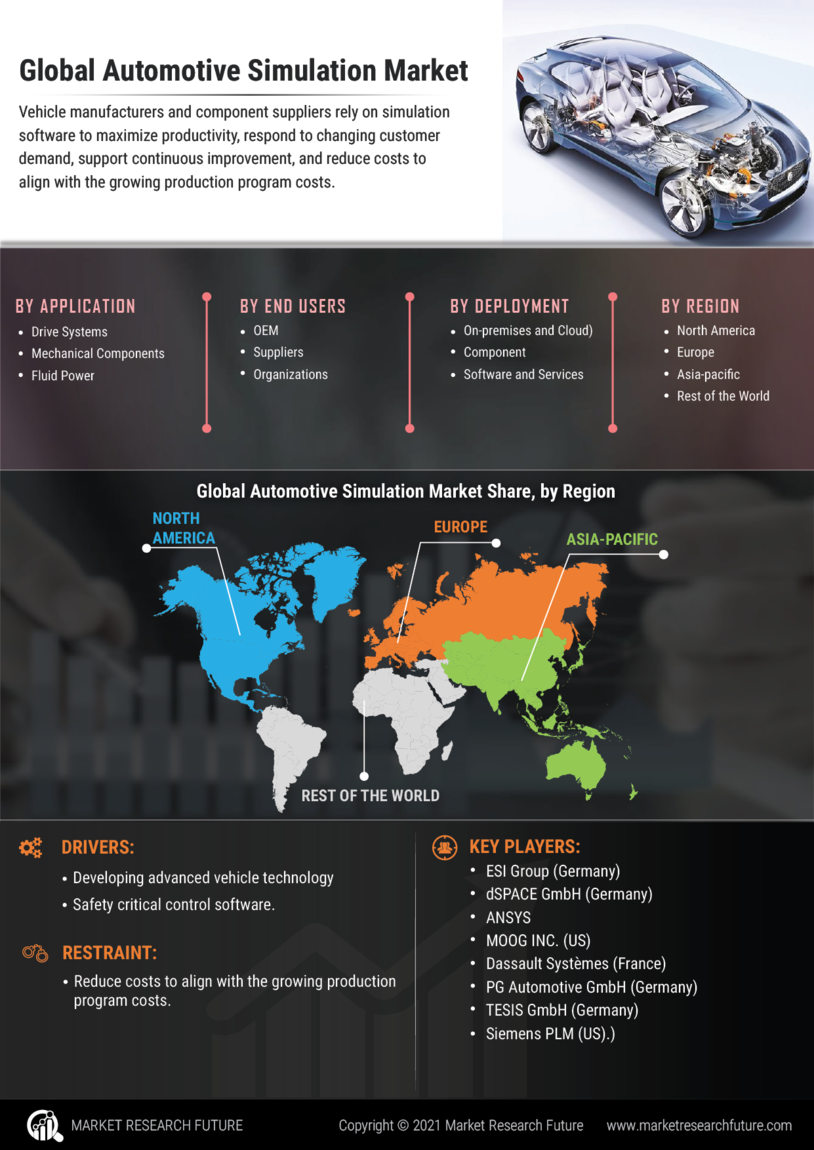
Innovation and continuous improvement have always been the core of the automotive industry. Vehicle manufacturers and component suppliers rely on simulation software to maximize productivity, respond to changing customer demand, support continuous improvement, and reduce costs to align with the growing production program costs.
The need for new and demanding vehicle test applications that require more innovative approaches, high-performance equipment, and new solutions is growing due to dramatic change in environment. Automotive simulator and its software elements are controlled through real-time simulation and modeling system that helps in easy configuration and coordination of the vehicle’s monitoring, dynamics, and driver feedback through graphical interface.
The increasing investments by automobile OEMs in developing advanced vehicle technology such as safety critical control software, smart electronics, and autonomous driving systems is attributed to the need of automotive simulation coupled with improvement of fuel efficiency and emission reduction. Moreover, automotive simulation enables to re-engineer different vehicle parts and deliver innovations faster through rapid virtual prototyping and testing for smart controls, electrification, energy efficiency, and light-weighting.
Some of the key factors driving the market growth are rising demand for environmental friendly simulation program generators which tend to provide information at the macro level; designing simulators to control traffic, weather, wildlife, pedestrians, and other vehicles; and improvement in the analysis and understanding of the decision-making processes in the assembly plants.
The global automotive simulation market is projected to witness a significant growth during the study period. The rising production of automobiles is estimated to accelerate the growth of automotive simulation market. Furthermore, preliminary design and evaluation of electric, hybrid, and conventional drive systems including operating strategies and thermal management is expected to augment the growth of automotive simulation market.
Segmentation: Automotive Simulation Market
The global Automotive Simulation Market is segmented on the basis of application, end users, deployment, component, and region. On the basis of application, the market has been segmented into drive systems, mechanical components, and fluid power. On the basis of end users, the market has been segmented into OEM, component suppliers, and research & engineering organizations. On the basis of deployment, the market has been segmented into on-premises and cloud. On the basis of component, the market has been segmented into software and services.
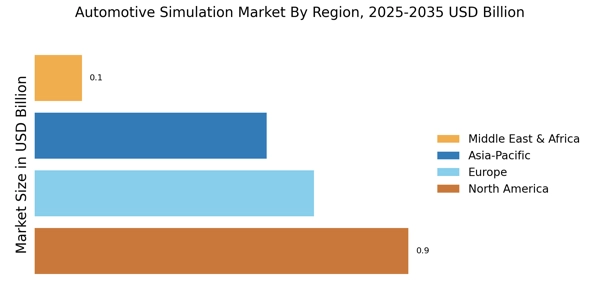
Geographically, the global Automotive Simulation Market has been segmented into four major regions namely North America, Europe, Asia-Pacific, and the Rest of the World. The Europe region is estimated to hold the prominent market share during the forecast period owing to growing investment by major OEMs in the region and stringent safety standards for vehicle manufacturing and testing. Moreover, increased production and sales of electric vehicle is expected to boost the demand for automotive software market in Asia Pacific region. Furthermore, investments by OEMs, component suppliers, and governmental bodies across North America to drive the automotive simulation market during the forecast period.
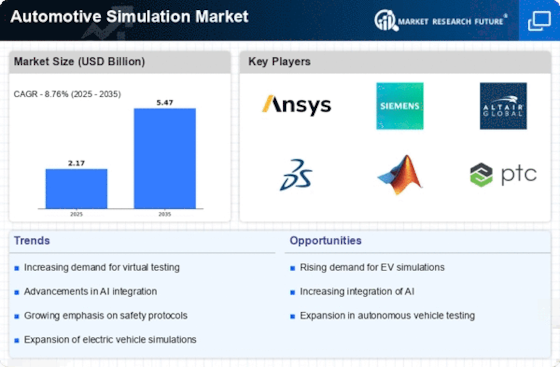
The prominent players in the global Automotive Simulation Market include ESI Group (Germany), dSPACE GmbH (Germany), ANSYS, Inc. (US), MOOG INC. (US), Dassault Systèmes (France), PG Automotive GmbH (Germany), TESIS GmbH (Germany), Siemens PLM (US).
The report for global Automotive Simulation Market of market research future covers extensive primary research. This is accompanied with detailed analysis of qualitative and quantitative aspects by various industry experts and key opinion leaders to gain deeper insights into the market and industry performance. The report gives a clear picture of the current market scenario, which includes the historical and forecasted market size, in terms of value and volume, technological advancement, macroeconomic, and governing factors of the market. The report provides comprehensive information about the strategies of the top companies in the industry, along with a broad study of the different market segments and regions.
Frequently Asked Questions (FAQ) :
The automotive simulation market can surge at 10% CAGR by 2023.
By the end of review period, the automotive simulation market can attain a lucrative valuation.
Dassault Systèmes (France), TESIS GmbH (Germany), Siemens PLM (US), and PG Automotive GmbH (Germany) are some reputed names in the automotive simulation market.
The hike in electric vehicle sales can prompt the global automotive simulation market growth.
The presence of numerous OEMs in North America can impel the regional market growth.
Table of Contents
1. Executive Summary
2. Scope of the Report
2.1. Market Definition
2.2. Scope of the Study
2.2.1. Definition
2.2.2. Research Objective
2.2.3. Assumptions
2.2.4. Limitations
2.3. Research Process
2.3.1. Primary Research
2.3.2. Secondary Research
2.4. Market size Estimation
2.5. Forecast Model
3. Market Landscape
3.1. Porter’s Five Forces Analysis
3.1.1. Threat of New Entrants
3.1.2. Bargaining power of buyers
3.1.3. Threat of substitutes
3.1.4. Segment rivalry
3.1.5. Bargaining Power of Buyers
3.2. Value Chain/Supply Chain Analysis
4. Market Dynamics
4.1. Introduction
4.2. Market Drivers
4.3. Market Restraints
4.4. Market Opportunities
4.5. Market Trends
5. Global Automotive Simulation Market, By Application
5.1. Introduction
5.2. Drive Systems
5.2.1. Market Estimates & Forecast, 2018-2023
5.2.2. Market Estimates & Forecast by Region, 2018-2023
5.3. Mechanical Components
5.3.1. Market Estimates & Forecast, 2018-2023
5.3.2. Market Estimates & Forecast by Region, 2018-2023
5.4. Fluid Power
5.4.1. Market Estimates & Forecast, 2018-2023
5.4.2. Market Estimates & Forecast by Region, 2018-2023
6. Global Automotive Simulation Market, By End Users
6.1. OEM
6.1.1. Market Estimates & Forecast, 2018-2023
6.1.2. Market Estimates & Forecast by Region, 2018-2023
6.2. Component Suppliers
6.2.1. Market Estimates & Forecast, 2018-2023
6.2.2. Market Estimates & Forecast by Region, 2018-2023
6.3. Research & Engineering Organizations
6.3.1. Market Estimates & Forecast, 2018-2023
6.3.2. Market Estimates & Forecast by Region, 2018-2023
7. Global Automotive Simulation Market, By Deployment
7.1. Introduction
7.2. On-premises
7.2.1. Market Estimates & Forecast, 2018-2023
7.2.2. Market Estimates & Forecast by Region, 2018-2023
7.3. Cloud
7.3.1. Market Estimates & Forecast, 2018-2023
7.3.2. Market Estimates & Forecast by Region, 2018-2023
8. Global Automotive Simulation Market, By Component
8.1. Introduction
8.2. Software
8.2.1. Market Estimates & Forecast, 2018-2023
8.2.2. Market Estimates & Forecast by Region, 2018-2023
8.3. Services
8.3.1. Market Estimates & Forecast, 2018-2023
8.3.2. Market Estimates & Forecast by Region, 2018-2023
9. Global Automotive Simulation Market, By Region
9.1. Introduction
9.2. North America
9.2.1. Market Estimates & Forecast, 2018-2023
9.2.2. Market Estimates & Forecast By Application, 2018-2023
9.2.3. Market Estimates & Forecast by End Users, 2018-2023
9.2.4. Market Estimates & Forecast by Component, 2018-2023
9.2.5. Market Estimates & Forecast by Deployment, 2018-2023
9.2.6. Market Estimates & Forecast by Application, 2018-2023
9.2.7. US
9.2.7.1. Market Estimates & Forecast By Application, 2018-2023
9.2.7.2. Market Estimates & Forecast by End Users, 2018-2023
9.2.7.3. Market Estimates & Forecast by Component, 2018-2023
9.2.7.4. Market Estimates & Forecast by Deployment, 2018-2023
9.2.8. Canada
9.2.8.1. Market Estimates & Forecast By Application, 2018-2023
9.2.8.2. Market Estimates & Forecast by End Users, 2018-2023
9.2.8.3. Market Estimates & Forecast by Component, 2018-2023
9.2.8.4. Market Estimates & Forecast by Deployment, 2018-2023
9.3. Europe
9.3.1. Market Estimates & Forecast By Application, 2018-2023
9.3.2. Market Estimates & Forecast by End Users, 2018-2023
9.3.3. Market Estimates & Forecast by Component, 2018-2023
9.3.4. Market Estimates & Forecast by Deployment, 2018-2023
9.3.5. UK
9.3.5.1. Market Estimates & Forecast By Application, 2018-2023
9.3.5.2. Market Estimates & Forecast by End Users, 2018-2023
9.3.5.3. Market Estimates & Forecast by Component, 2018-2023
9.3.5.4. Market Estimates & Forecast by Deployment, 2018-2023
9.3.6. Germany
9.3.6.1. Market Estimates & Forecast By Application, 2018-2023
9.3.6.2. Market Estimates & Forecast by End Users, 2018-2023
9.3.6.3. Market Estimates & Forecast by Component, 2018-2023
9.3.6.4. Market Estimates & Forecast by Deployment, 2018-2023
9.3.7. France
9.3.7.1. Market Estimates & Forecast By Application, 2018-2023
9.3.7.2. Market Estimates & Forecast by End Users, 2018-2023
9.3.7.3. Market Estimates & Forecast by Component, 2018-2023
9.3.7.4. Market Estimates & Forecast by Deployment, 2018-2023
9.3.8. Italy
9.3.8.1. Market Estimates & Forecast By Application, 2018-2023
9.3.8.2. Market Estimates & Forecast by End Users, 2018-2023
9.3.8.3. Market Estimates & Forecast by Component, 2018-2023
9.3.8.4. Market Estimates & Forecast by Deployment, 2018-2023
9.3.9. Rest of Europe
9.3.9.1. Market Estimates & Forecast By Application, 2018-2023
9.3.9.2. Market Estimates & Forecast by End Users, 2018-2023
9.3.9.3. Market Estimates & Forecast by Component, 2018-2023
9.3.9.4. Market Estimates & Forecast by Deployment, 2018-2023
9.4. Asia-Pacific
9.4.1. Market Estimates & Forecast By Application, 2018-2023
9.4.2. Market Estimates & Forecast by End Users, 2018-2023
9.4.3. Market Estimates & Forecast by Component, 2018-2023
9.4.4. Market Estimates & Forecast by Deployment, 2018-2023
9.4.5. China
9.4.5.1. Market Estimates & Forecast By Application, 2018-2023
9.4.5.2. Market Estimates & Forecast by End Users, 2018-2023
9.4.5.3. Market Estimates & Forecast by Component, 2018-2023
9.4.5.4. Market Estimates & Forecast by Deployment, 2018-2023
9.4.6. Japan
9.4.6.1. Market Estimates & Forecast By Application, 2018-2023
9.4.6.2. Market Estimates & Forecast by End Users, 2018-2023
9.4.6.3. Market Estimates & Forecast by Component, 2018-2023
9.4.6.4. Market Estimates & Forecast by Deployment, 2018-2023
9.4.7. India
9.4.7.1. Market Estimates & Forecast By Application, 2018-2023
9.4.7.2. Market Estimates & Forecast by End Users, 2018-2023
9.4.7.3. Market Estimates & Forecast by Component, 2018-2023
9.4.7.4. Market Estimates & Forecast by Deployment, 2018-2023
9.4.8. Rest of Asia-Pacific
9.4.8.1. Market Estimates & Forecast By Application, 2018-2023
9.4.8.2. Market Estimates & Forecast by End Users, 2018-2023
9.4.8.3. Market Estimates & Forecast by Component, 2018-2023
9.4.8.4. Market Estimates & Forecast by Deployment, 2018-2023
9.4.8.5.
9.5. Rest of the World
9.5.1. Market Estimates & Forecast By Application, 2018-2023
9.5.2. Market Estimates & Forecast by End Users, 2018-2023
9.5.3. Market Estimates & Forecast by Component, 2018-2023
9.5.4. Market Estimates & Forecast by Deployment, 2018-2023
9.5.5.
9.5.6. Middle East & Africa
9.5.6.1. Market Estimates & Forecast By Application, 2018-2023
9.5.6.2. Market Estimates & Forecast by End Users, 2018-2023
9.5.6.3. Market Estimates & Forecast by Component, 2018-2023
9.5.6.4. Market Estimates & Forecast by Deployment, 2018-2023
9.5.7. South America
9.5.7.1. Market Estimates & Forecast By Application, 2018-2023
9.5.7.2. Market Estimates & Forecast by End Users, 2018-2023
9.5.7.3. Market Estimates & Forecast by Component, 2018-2023
9.5.7.4. Market Estimates & Forecast by Deployment, 2018-2023
9.5.7.5.
10. Competitive Landscape
11. Company Profile
11.1. ESI Group
11.1.1. Company Overview
11.1.2. Products/Services Offering
11.1.3. Financial Overview
11.1.4. Key Developments
11.1.5. Strategy
11.1.6. SWOT Analysis
11.2. dSPACE GmbH
11.2.1. Company Overview
11.2.2. Products/Services Offering
11.2.3. Financial Overview
11.2.4. Key Developments
11.2.5. Strategy
11.2.6. SWOT Analysis
11.3. ANSYS, Inc.
11.3.1. Company Overview
11.3.2. Products/Services Offering
11.3.3. Financial Overview
11.3.4. Key Developments
11.3.5. Strategy
11.3.6. SWOT Analysis
11.4. MOOG INC.
11.4.1. Company Overview
11.4.2. Products/Services Offering
11.4.3. Financial Overview
11.4.4. Key Developments
11.4.5. Strategy
11.4.6. SWOT Analysis
11.5. Dassault Systèmes
11.5.1. Company Overview
11.5.2. Products/Services Offering
11.5.3. Financial Overview
11.5.4. Key Developments
11.5.5. Strategy
11.5.6. SWOT Analysis
11.6. PG Automotive GmbH
11.6.1. Company Overview
11.6.2. Products/Services Offering
11.6.3. Financial Overview
11.6.4. Key Developments
11.6.5. Strategy
11.6.6. SWOT Analysis
11.7. TESIS GmbH
11.7.1. Company Overview
11.7.2. Products/Services Offering
11.7.3. Financial Overview
11.7.4. Key Developments
11.7.5. Strategy
11.7.6. SWOT Analysis
11.8. Siemens PLM
11.8.1. Company Overview
11.8.2. Products/Services Offering
11.8.3. Financial Overview
11.8.4. Key Developments
11.8.5. Strategy
11.8.6. SWOT Analysis
11.9. Ansys
11.9.1. Company Overview
11.9.2. Products/Services Offering
11.9.3. Financial Overview
11.9.4. Key Developments
11.9.5. Strategy
11.9.6. SWOT Analysis
11.10. Altair
11.10.1. Company Overview
11.10.2. Products/Services Offering
11.10.3. Financial Overview
11.10.4. Key Developments
11.10.5. Strategy
11.10.6. SWOT Analysis
List of Tables
Table 1 Global Automotive Simulation Market: By Region, 2018-2023
Table 2 North America: Automotive Simulation Market: By Country, 2018-2023
Table 3 Europe: Automotive Simulation Market: By Country, 2018-2023
Table 4 Asia-Pacific: Automotive Simulation Market: By Country, 2018-2023
Table 5 RoW: Automotive Simulation Market: By Region, 2018-2023
Table 6 Global Automotive Simulation Market, By Application, By Regions, 2018-2023
Table 7 North America: Automotive Simulation Market, By Application, By Country, 2018-2023
Table 8 Europe: Automotive Simulation Market, By Application, By Country, 2018-2023
Table 9 Asia-Pacific: Automotive Simulation Market, By Application, By Country, 2018-2023
Table 10 RoW: Automotive Simulation Market, By Application, By Country, 2018-2023
Table 11 Global Automotive Simulation Market by End Users: By Regions, 2018-2023
Table 12 North America: Automotive Simulation Market by End Users: By Country, 2018-2023
Table 13 Europe: Automotive Simulation Market by End Users: By Country, 2018-2023
Table 14 Asia-Pacific: Automotive Simulation Market by End Users: By Country, 2018-2023
Table 15 RoW: Automotive Simulation Market by End Users: By Country, 2018-2023
Table 16 Global Automotive Simulation Market by Deployment: By Regions, 2018-2023
Table 17 North America: Automotive Simulation Market by Deployment: By Country, 2018-2023
Table 18 Europe: Automotive Simulation Market by Deployment: By Country, 2018-2023
Table 19 Asia-Pacific: Automotive Simulation Market by Deployment: By Country, 2018-2023
Table 20 RoW: Automotive Simulation Market by Deployment: By Country, 2018-2023
Table 21 Global Automotive Software by Component Market: By Regions, 2018-2023
Table 22 North America: Automotive Simulation Market by Component: By Country, 2018-2023
Table 23 Europe: Automotive Simulation Market by Component: By Country, 2018-2023
Table 24 Asia-Pacific: Automotive Simulation Market by Component: By Country, 2018-2023
Table 25 RoW: Automotive Simulation Market by Component: By Country, 2018-2023
Table 26 Global Automotive Simulation Market: By Region, 2018-2023
Table 27 Global Automotive Simulation Market: By Application, 2018-2023
Table 28 Global Automotive Simulation Market: By End Users, 2018-2023
Table 29 Global Automotive Simulation Market: By Deployment, 2018-2023
Table 30 Global Automotive Simulation Market: By Component, 2018-2023
List of Figures
FIGURE 1 Research Process of MRFR
FIGURE 2 Top-down & Bottom-up Approach
FIGURE 3 Market Dynamics
FIGURE 4 Impact Analysis: Market Drivers
FIGURE 5 Impact Analysis: Market Restraints
FIGURE 6 Porter's five forces analysis
FIGURE 7 Value chain analysis
FIGURE 8 Global Automotive Simulation Market Share, By Application, 2017 (%)
FIGURE 9 Global Automotive Simulation Market, By Application, 2018-2023 (USD MILLION)
FIGURE 10 Global Automotive Simulation Market Share, By End Users, 2017 (%)
FIGURE 11 Global Automotive Simulation Market, By End Users, 2018-2023 (USD MILLION)
FIGURE 12 Global Automotive Simulation Market Share, By Deployment, 2017 (%)
FIGURE 13 Global Automotive Simulation Market, By Deployment, 2018-2023 (USD MILLION)
FIGURE 14 Global Automotive Simulation Market Share, By Component, 2017 (%)
FIGURE 15 Global Automotive Simulation Market, By Component, 2018-2023 (USD MILLION)
FIGURE 16 Global Automotive Simulation Market Share (%), BY REGION, 2017
FIGURE 17 Global Automotive Simulation Market, BY Region, 2018-2023 (USD MILLION)
FIGURE 18 North America: Automotive Simulation Market Share (%), 2017
FIGURE 19 North America: Automotive Simulation Market by Country, 2018-2023 (USD MILLION)
FIGURE 20 Europe: Automotive Simulation Market Share (%), 2017
FIGURE 21 Europe: Automotive Simulation Market BY Country, 2018-2023 (USD MILLION)
FIGURE 22 Asia-Pacific: Automotive Simulation Market Share (%), 2017
FIGURE 23 Asia-Pacific: Automotive Simulation Market BY Country, 2018-2023 (USD MILLION)
FIGURE 24 Rest of the World Automotive Simulation Market Share (%), 2017
FIGURE 25 Rest of the World Automotive Simulation Market BY Country, 2018-2023 (USD MILLION)