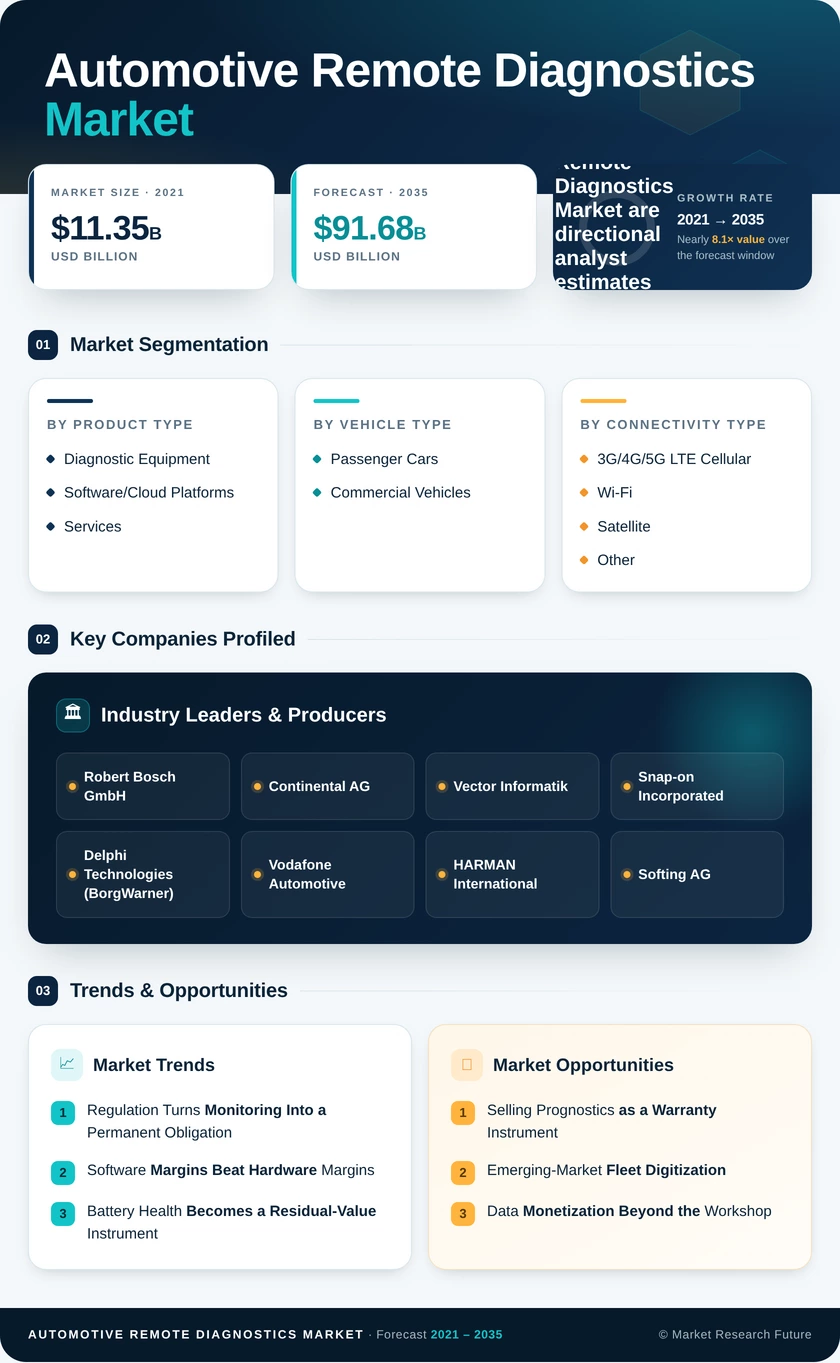
Automotive Remote Diagnostics Market (2026 - 2035)

ID: MRFR/AT/1310-CR 200 Pages Shubham Munde Last Updated: October 16, 2026
Automotive Remote Diagnostics Market Research Report By Product Type (Diagnostic Equipment, Software/Cloud Platforms, Services), By Vehicle Type (Passenger Cars, Commercial Vehicles), By Connectivity Type (3G/4G/5G LTE Cellular, Wi-Fi, Satellite and Other), By Application (Vehicle Health Tracking and Prognostics, Vehicle System and Component Access, Over-the-Air Updates, Roadside Assistance and Emergency Response), By End-User (OEM-Installed, Aftermarket) and By Regional (North America, Europe, South America, Asia Pacific, Middle East and Africa) - Forecast to 2035
Automotive Remote Diagnostics Market
Market Size
Forecast Period2026-2035
CAGR (2026-2035)16.1%
2025 Market SizeUSD 20.72 Billion
2035 Market SizeUSD 91.68 billion
Key Players
Robert Bosch GmbH
Continental AG
Vector Informatik
Snap-on Incorporated
Delphi Technologies
Vodafone Automotive
Opportunities
  • Selling Prognostics as a Warranty Instrument
  • Emerging-Market Fleet Digitization
  • Data Monetization Beyond the Workshop
  1. 1 Market Summary |
    1. 1.1 Study Assumptions & Market Definition |
    2. 1.2 Scope of the Study |
    3. 1.3 Research Methodology
  2. 2 Key Report Takeaways |
    1. 2.1 By Technology |
    2. 2.2 By Sector |
    3. 2.3 By Geography
  3. 3 Market Size & Forecast (2021–2035) |
    1. 3.1 Historical Market Size (2021–2025) |
    2. 3.2 Current & Forecast Market Size (2026–2035) |
    3. 3.3 Year-over-Year Growth Analysis
  4. 4 Driver Impact Analysis |
    1. 4.1 Regulation Turns Monitoring Into a Permanent Obligation |
    2. 4.2 Software Margins Beat Hardware Margins |
    3. 4.3 Battery Health Becomes a Residual-Value Instrument |
    4. 4.4 Fleets Buy Uptime, Not Diagnostics
  5. 5 Restraints Impact Analysis |
    1. 5.1 Cybersecurity and Attack-Surface Exposure |
    2. 5.2 Data Privacy and Ownership Disputes |
    3. 5.3 Protocol Fragmentation Across OEMs
  6. 6 Opportunities |
    1. 6.1 Prognostics as a Warranty Instrument |
    2. 6.2 Emerging-Market Fleet Digitization |
    3. 6.3 Data Monetization Beyond the Workshop |
    4. 6.4 Second-Life Battery Certification |
    5. 6.5 Remote Supervision for Autonomous Fleets
  7. 7 Regional Market Share & Country-Level Analysis |
    1. 7.1 North America | |
      1. 7.1.1 US | |
      2. 7.1.2 Canada | |
      3. 7.1.3 Mexico |
    2. 7.2 Europe | |
      1. 7.2.1 Germany | |
      2. 7.2.2 UK | |
      3. 7.2.3 France | |
      4. 7.2.4 Italy | |
      5. 7.2.5 Spain | |
      6. 7.2.6 Nordic Countries | |
      7. 7.2.7 Russia | |
      8. 7.2.8 Rest of Europe |
    3. 7.3 Asia-Pacific | |
      1. 7.3.1 China | |
      2. 7.3.2 India | |
      3. 7.3.3 Japan | |
      4. 7.3.4 South Korea | |
      5. 7.3.5 ASEAN | |
      6. 7.3.6 Rest of Asia-Pacific |
    4. 7.4 South America | |
      1. 7.4.1 Brazil | |
      2. 7.4.2 Argentina | |
      3. 7.4.3 Rest of South America |
    5. 7.5 Middle East & Africa | |
      1. 7.5.1 Saudi Arabia | |
      2. 7.5.2 UAE | |
      3. 7.5.3 South Africa | |
      4. 7.5.4 Egypt | |
      5. 7.5.5 Rest of Middle East & Africa
  8. 8 Future Outlook (2026–2035) |
    1. 8.1 Autonomy Reframes the Buyer |
    2. 8.2 Platform Economics Consolidate the Middle |
    3. 8.3 Electrification Rewrites the Fault Taxonomy |
    4. 8.4 Sustainability Reporting Pulls Diagnostics Into Finance
  9. 9 Market Segmentation Analysis |
    1. 9.1 By Product Type | |
      1. 9.1.1 Diagnostic Equipment | |
      2. 9.1.2 Software/Cloud Platforms | |
      3. 9.1.3 Services |
    2. 9.2 By Vehicle Type | |
      1. 9.2.1 Passenger Cars | |
      2. 9.2.2 Commercial Vehicles |
    3. 9.3 By Connectivity Type | |
      1. 9.3.1 3G/4G/5G LTE Cellular | |
      2. 9.3.2 Wi-Fi | |
      3. 9.3.3 Satellite and Other |
    4. 9.4 By Application | |
      1. 9.4.1 Vehicle Health Tracking and Prognostics | |
      2. 9.4.2 Vehicle System and Component Access | |
      3. 9.4.3 Over-the-Air Updates | |
      4. 9.4.4 Roadside Assistance and Emergency Response |
    5. 9.5 By End-User | |
      1. 9.5.1 OEM-Installed | |
      2. 9.5.2 Aftermarket
  10. 10 Competitive Landscape |
    1. 10.1 Market Concentration Analysis (2026) |
    2. 10.2 Competitive Benchmarking Matrix |
    3. 10.3 Company Profiles
  11. 11 Recent News & Developments
  12. 12 Report Scope & Methodology
  13. 13 Detailed Sources & Citations
  14. 14 Frequently Asked Questions (FAQs)
  15. 15 LIST OF TABLES |
  16. TABLE 1 Global Automotive Remote Diagnostics Market Size & Forecast, by Revenue (USD Billion), 2021–2035 |
  17. TABLE 2 Global Automotive Remote Diagnostics Market – Year-over-Year Growth Analysis, 2021–2035 |
  18. TABLE 3 Driver Impact Analysis Matrix, 2026–2035 |
  19. TABLE 4 Restraint Impact Analysis Matrix, 2026–2035 |
  20. TABLE 5 Global Market Size, by Region, 2021–2035 (USD Billion) |
  21. TABLE 6 North America Market Size, by Country, 2021–2035 (USD Billion) |
  22. TABLE 7 Europe Market Size, by Country, 2021–2035 (USD Billion) |
  23. TABLE 8 Asia-Pacific Market Size, by Country, 2021–2035 (USD Billion) |
  24. TABLE 9 South America Market Size, by Country, 2021–2035 (USD Billion) |
  25. TABLE 10 Middle East & Africa Market Size, by Country, 2021–2035 (USD Billion) |
  26. TABLE 11 Global Market Size, by Product Type, 2021–2035 (USD Billion) |
  27. TABLE 12 Global Market Size, by Vehicle Type, 2021–2035 (USD Billion) |
  28. TABLE 13 Global Market Size, by Connectivity Type, 2021–2035 (USD Billion) |
  29. TABLE 14 Global Market Size, by Application, 2021–2035 (USD Billion) |
  30. TABLE 15 Global Market Size, by End-User, 2021–2035 (USD Billion) |
  31. TABLE 16 North America Market Size, by Product Type, 2021–2035 (USD Billion) |
  32. TABLE 17 Europe Market Size, by Application, 2021–2035 (USD Billion) |
  33. TABLE 18 Asia-Pacific Market Size, by End-User, 2021–2035 (USD Billion) |
  34. TABLE 19 Competitive Benchmarking Matrix, 2026 |
  35. TABLE 20 Company Profiles – Key Players |
  36. TABLE 21 Recent Developments & Strategic Announcements, 2023–2025 |
  37. TABLE 22 Report Scope & Methodology Summary |
  38. TABLE 23 Detailed Sources & Citations Index
  39. 16 LIST OF FIGURES |
  40. FIGURE 1 Market Dynamics – Drivers, Restraints, Opportunities and Challenges |
  41. FIGURE 2 Industry Value Chain Analysis |
  42. FIGURE 3 Porter's Five Forces Analysis |
  43. FIGURE 4 Global Market Size Trend, 2021–2035 (USD Billion) |
  44. FIGURE 5 Year-over-Year Growth Trajectory, 2022–2035 |
  45. FIGURE 6 Market Share by Product Type, 2025 vs 2035 |
  46. FIGURE 7 Market Share by Vehicle Type, 2025 |
  47. FIGURE 8 Market Share by Connectivity Type, 2025 |
  48. FIGURE 9 Market Share by Application, 2025 vs 2035 |
  49. FIGURE 10 Market Share by End-User, 2025 |
  50. FIGURE 11 Regional Revenue Share, 2025 |
  51. FIGURE 12 Regional CAGR Comparison, 2026–2035 |
  52. FIGURE 13 North America Country-Level Share, 2025 |
  53. FIGURE 14 Asia-Pacific Country-Level Share, 2025 |
  54. FIGURE 15 Competitive Landscape – Revenue Share Positioning, 2026 |
  55. FIGURE 16 Vendor Strategic Positioning Matrix, 2026

Segmentation Quick Reference

DimensionSub-SegmentsDominant SegmentFastest Growing Segment
By Product TypeDiagnostic Equipment; Software/Cloud Platforms; ServicesDiagnostic EquipmentServices
By Vehicle TypePassenger Cars; Commercial VehiclesPassenger CarsCommercial Vehicles
By Connectivity Type3G/4G/5G LTE Cellular; Wi-Fi; Satellite and Other3G/4G/5G LTE Cellular3G/4G/5G LTE Cellular
By ApplicationVehicle Health Tracking and Prognostics; Vehicle System and Component Access; Over-the-Air Updates; Roadside Assistance and Emergency ResponseVehicle Health Tracking and PrognosticsOver-the-Air Updates
By End-UserOEM-Installed; AftermarketOEM-InstalledAftermarket
By GeographyNorth America; Europe; Asia-Pacific; South America; Middle East & AfricaNorth AmericaAsia-Pacific


Market Segmentation Overview

By Product Type

Sub-SegmentKey Trend
Diagnostic EquipmentRising module content per vehicle offsets falling unit prices
Software/Cloud PlatformsConsolidation around multi-brand normalization capability
ServicesMigration from license fees to managed, outcome-linked contracts


Hardware remains the entry point, but recurring revenue increasingly sits above it. Suppliers that treat equipment as a customer-acquisition cost rather than a profit center are gaining platform share.

By Vehicle Type

Sub-SegmentKey Trend
Passenger CarsSubscription attach rates diverge sharply between premium and volume brands.
Commercial VehiclesDowntime cost modeling makes ROI provable at the point of sale.


By Connectivity Type

Sub-SegmentKey Trend
3G/4G/5G LTE CellularRedCap modules reshape connectivity bill-of-materials from 2027
Wi-FiDepot offload retained for high-volume log transfers.
Satellite and OtherNiche strength in mining, agriculture, and remote freight corridors


Cellular sunset schedules for legacy 2G and 3G networks are forcing retrofit cycles that vendors are converting into upgrade revenue.

By Application

Sub-SegmentKey Trend
Vehicle Health Tracking and PrognosticsMoving from threshold alerts to remaining-useful-life scoring
Vehicle System and Component AccessRegulatory access rights widening the addressable user base
Over-the-Air UpdatesRecall remediation shifting from physical to software delivery.
Roadside Assistance and Emergency ResponseBundling with insurance and mobility subscriptions


Applications are converging: the same telemetry stream now serves maintenance, compliance, and underwriting simultaneously, which improves unit economics for whoever controls the pipe.

By End-User

Sub-SegmentKey Trend
OEM-InstalledFactory fitment approaching saturation in developed markets.
AftermarketData-access regulation unlocking multi-brand service propositions


Aftermarket growth depends less on technology than on whether gateway access rules are enforced consistently across jurisdictions.

By Geography

Sub-SegmentKey Trend
North AmericaFleet telematics maturity and insurance data integration
EuropeCompliance-led procurement under Euro 7 and data-access rules
Asia-PacificGovernment monitoring infrastructure creating commercial adjacency
South AmericaSecurity-driven telematics base upgrading toward diagnostics
Middle East & AfricaPublic fleet digitization and harsh-environment monitoring demand


Regional divergence is widening: North America buys on ROI, Europe buys on compliance, and Asia-Pacific scales on infrastructure that public policy already funded.




Download PDF ×

We do not share your information with anyone. However, we may send you emails based on your report interest from time to time. You may contact us at any time to opt-out.