Automotive Fuel Rail Market (2026 - 2035)

ID: MRFR/AT/4811-HCR 100 Pages Triveni Bhoyar Last Updated: September 15, 2026
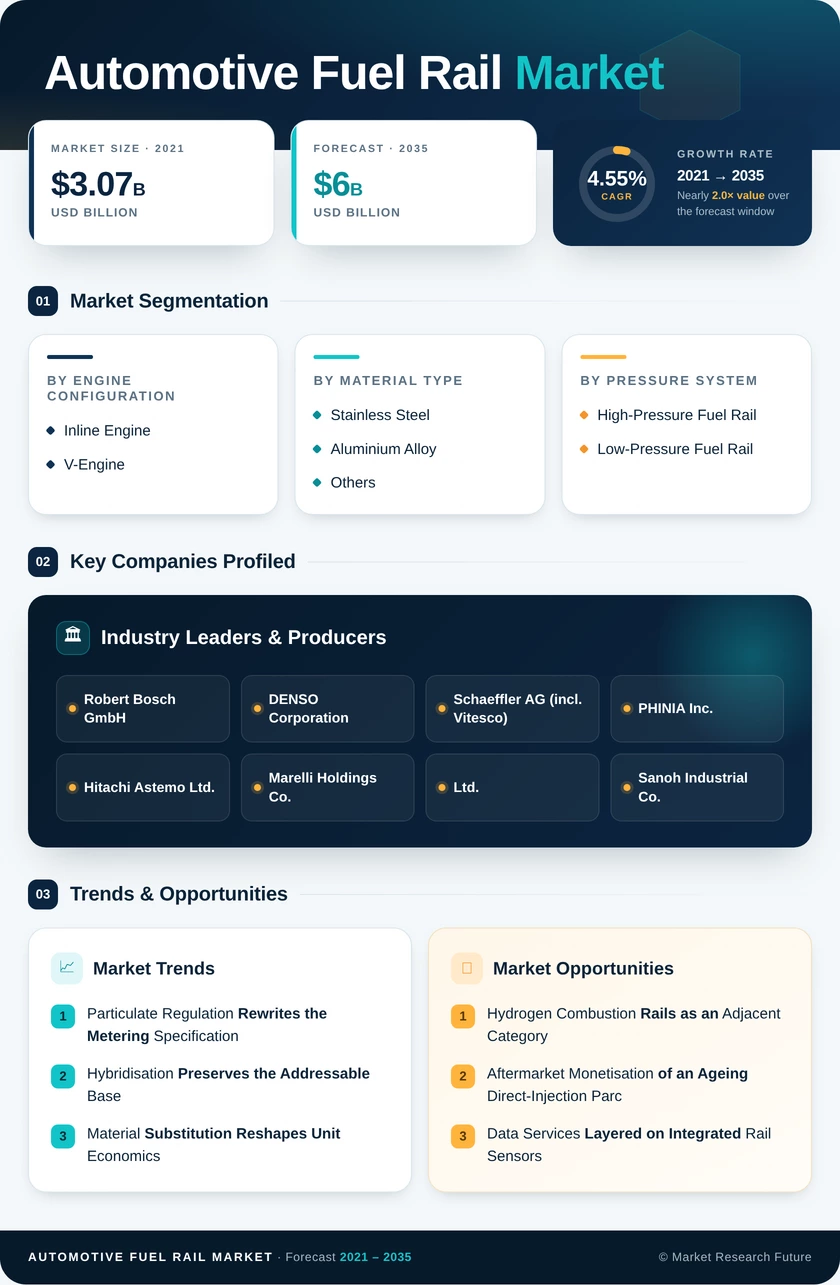
Automotive Fuel Rail Market Research Report By Engine Configuration (Inline Engine, V-Engine), By Material Type (Stainless Steel, Aluminium Alloy, Others), By Pressure System (High-Pressure Fuel Rail, Low-Pressure Fuel Rail), By Vehicle Type (Passenger Cars, Commercial Vehicles), By Fuel Type (Gasoline, Diesel, Hydrogen, Others (CNG, LPG, Flex-Fuel)), By Delivery Method (Gasoline Direct Injection (GDI), Port Fuel Injection (PFI), Dual / Combined Injection), By Distribution Channel (OEM, Aftermarket) and By Regional (North America, Europe, South America, Asia Pacific, Middle East and Africa) - Forecast to 2035
Automotive Fuel Rail Market
Market Size
Forecast Period2026-2035
CAGR (2026-2035)4.55%
2025 Market SizeUSD 3.86 Billion
2035 Market SizeUSD 6.00 Billion
Key Players
Robert Bosch GmbH
DENSO Corporation
Schaeffler AG
PHINIA Inc.
Hitachi Astemo Ltd.
Marelli Holdings Co., Ltd.
Opportunities
  • Hydrogen Combustion Rails as an Adjacent Category
  • Aftermarket Monetisation of an Ageing Direct-Injection Parc
  • Data Services Layered on Integrated Rail Sensors
  1. 1 Market Overview |
    1. 1.1 Study Assumptions & Market Definition |
    2. 1.2 Scope of the Study |
    3. 1.3 Research Methodology
  2. 2 Market Summary & Key Takeaways
  3. 3 Market Dynamics |
    1. 3.1 Market Drivers Analysis | |
      1. 3.1.1 GDI Penetration Toward 350-Bar Systems | |
      2. 3.1.2 Euro 7 Particulate-Number Compliance | |
      3. 3.1.3 Hybrid Powertrains Extending Combustion Service Life | |
      4. 3.1.4 Aluminium Substitution and Mass Reduction | |
      5. 3.1.5 US EPA MY2027+ Multi-Pollutant Standards | |
      6. 3.1.6 Commercial-Vehicle Common-Rail Pressure Upgrades | |
      7. 3.1.7 Aftermarket Replacement from Ageing GDI Parc |
    2. 3.2 Market Restraints Analysis | |
      1. 3.2.1 Battery-Electric Share Compressing the Volume Pool | |
      2. 3.2.2 EU 2035 Zero-CO2 Mandate for Cars and Vans | |
      3. 3.2.3 Supplier Exits from Combustion-Linked Portfolios | |
      4. 3.2.4 OEM Platform Consolidation | |
      5. 3.2.5 Nickel and Stainless Input-Cost Volatility |
    3. 3.3 Market Opportunity Analysis | |
      1. 3.3.1 Hydrogen Combustion Rails | |
      2. 3.3.2 Aftermarket Monetisation of the Direct-Injection Parc | |
      3. 3.3.3 Data Services on Integrated Rail Sensors | |
      4. 3.3.4 Emerging-Market Production Depth | |
      5. 3.3.5 Dual-Circuit Architectures for Hybrid Duty Cycles |
    4. 3.4 Industry Value Chain Analysis |
    5. 3.5 Porter's Five Forces Analysis
  4. 4 Global Automotive Fuel Rail Market Size & Forecast (2021–2035) |
    1. 4.1 Historical Market Size (2021–2025) |
    2. 4.2 Current & Forecast Market Size (2026–2035) |
    3. 4.3 Market Size by Revenue (USD Billion) |
    4. 4.4 Year-over-Year Growth Analysis
  5. 5 Segmentation Analysis |
    1. 5.1 By Engine Configuration | |
      1. 5.1.1 Inline Engine | |
      2. 5.1.2 V-Engine |
    2. 5.2 By Material Type | |
      1. 5.2.1 Stainless Steel | |
      2. 5.2.2 Aluminium Alloy | |
      3. 5.2.3 Others |
    3. 5.3 By Pressure System | |
      1. 5.3.1 High-Pressure Fuel Rail | |
      2. 5.3.2 Low-Pressure Fuel Rail |
    4. 5.4 By Vehicle Type | |
      1. 5.4.1 Passenger Cars | |
      2. 5.4.2 Commercial Vehicles |
    5. 5.5 By Fuel Type | |
      1. 5.5.1 Gasoline | |
      2. 5.5.2 Diesel | |
      3. 5.5.3 Hydrogen | |
      4. 5.5.4 Others (CNG, LPG, Flex-Fuel) |
    6. 5.6 By Delivery Method | |
      1. 5.6.1 Gasoline Direct Injection (GDI) | |
      2. 5.6.2 Port Fuel Injection (PFI) | |
      3. 5.6.3 Dual / Combined Injection |
    7. 5.7 By Distribution Channel | |
      1. 5.7.1 OEM | |
      2. 5.7.2 Aftermarket
  6. 6 Regional Analysis |
    1. 6.1 North America | |
      1. 6.1.1 US | |
      2. 6.1.2 Canada | |
      3. 6.1.3 Mexico |
    2. 6.2 Europe | |
      1. 6.2.1 Germany | |
      2. 6.2.2 UK | |
      3. 6.2.3 France | |
      4. 6.2.4 Italy | |
      5. 6.2.5 Spain | |
      6. 6.2.6 Nordic Countries | |
      7. 6.2.7 Russia | |
      8. 6.2.8 Rest of Europe |
    3. 6.3 Asia-Pacific | |
      1. 6.3.1 China | |
      2. 6.3.2 India | |
      3. 6.3.3 Japan | |
      4. 6.3.4 South Korea | |
      5. 6.3.5 ASEAN | |
      6. 6.3.6 Rest of Asia-Pacific |
    4. 6.4 South America | |
      1. 6.4.1 Brazil | |
      2. 6.4.2 Argentina | |
      3. 6.4.3 Rest of South America |
    5. 6.5 Middle East & Africa | |
      1. 6.5.1 Saudi Arabia | |
      2. 6.5.2 UAE | |
      3. 6.5.3 South Africa | |
      4. 6.5.4 Egypt | |
      5. 6.5.5 Rest of Middle East & Africa
  7. 7 Competitive Landscape |
    1. 7.1 Market Share Analysis (2026) |
    2. 7.2 Competitive Benchmarking Matrix |
    3. 7.3 Company Profiles | |
      1. 7.3.1 Robert Bosch GmbH | |
      2. 7.3.2 DENSO Corporation | |
      3. 7.3.3 Schaeffler AG | |
      4. 7.3.4 PHINIA Inc. | |
      5. 7.3.5 Hitachi Astemo Ltd. | |
      6. 7.3.6 Marelli Holdings Co., Ltd. | |
      7. 7.3.7 Sanoh Industrial Co., Ltd. | |
      8. 7.3.8 Usui Co., Ltd. | |
      9. 7.3.9 TI Fluid Systems | |
      10. 7.3.10 Cooper Standard Holdings | |
      11. 7.3.11 Millennium Industries Corp.
  8. 8 Future Outlook & Strategic Recommendations (2026–2035) |
    1. 8.1 Near-Term Outlook (2026–2028) |
    2. 8.2 Medium-Term Outlook (2029–2031) |
    3. 8.3 Long-Term Outlook (2032–2035)
  9. 9 Recent Developments & News
  10. 10 Frequently Asked Questions (FAQs)
  11. 11 Report Scope & Methodology |
    1. 11.1 Study Period & Base Year |
    2. 11.2 Data Sources & Citations |
    3. 11.3 Abbreviations
  12. 12 LIST OF TABLES |
  13. TABLE 1 Global Automotive Fuel Rail Market Size & Forecast, by Revenue (USD Billion), 2021–2035 |
  14. TABLE 2 Global Automotive Fuel Rail Market – Year-over-Year Growth Analysis, 2021–2035 |
  15. TABLE 3 Driver Impact Analysis – Directional CAGR Contribution and Timeline |
  16. TABLE 4 Restraint Impact Analysis – Directional CAGR Drag and Timeline |
  17. TABLE 5 Global Automotive Fuel Rail Market Size, by Engine Configuration, 2021–2035 (USD Billion) |
  18. TABLE 6 Global Automotive Fuel Rail Market Size, by Material Type, 2021–2035 (USD Billion) |
  19. TABLE 7 Global Automotive Fuel Rail Market Size, by Pressure System, 2021–2035 (USD Billion) |
  20. TABLE 8 Global Automotive Fuel Rail Market Size, by Vehicle Type, 2021–2035 (USD Billion) |
  21. TABLE 9 Global Automotive Fuel Rail Market Size, by Fuel Type, 2021–2035 (USD Billion) |
  22. TABLE 10 Global Automotive Fuel Rail Market Size, by Delivery Method, 2021–2035 (USD Billion) |
  23. TABLE 11 Global Automotive Fuel Rail Market Size, by Distribution Channel, 2021–2035 (USD Billion) |
  24. TABLE 12 Global Automotive Fuel Rail Market Size, by Region, 2021–2035 (USD Billion) |
  25. TABLE 13 North America Automotive Fuel Rail Market Size, by Country, 2021–2035 (USD Billion) |
  26. TABLE 14 Europe Automotive Fuel Rail Market Size, by Country, 2021–2035 (USD Billion) |
  27. TABLE 15 Asia-Pacific Automotive Fuel Rail Market Size, by Country, 2021–2035 (USD Billion) |
  28. TABLE 16 South America Automotive Fuel Rail Market Size, by Country, 2021–2035 (USD Billion) |
  29. TABLE 17 Middle East & Africa Automotive Fuel Rail Market Size, by Country, 2021–2035 (USD Billion) |
  30. TABLE 18 North America Automotive Fuel Rail Market Size, by Pressure System, 2021–2035 (USD Billion) |
  31. TABLE 19 North America Automotive Fuel Rail Market Size, by Delivery Method, 2021–2035 (USD Billion) |
  32. TABLE 20 Europe Automotive Fuel Rail Market Size, by Material Type, 2021–2035 (USD Billion) |
  33. TABLE 21 Europe Automotive Fuel Rail Market Size, by Fuel Type, 2021–2035 (USD Billion) |
  34. TABLE 22 Asia-Pacific Automotive Fuel Rail Market Size, by Engine Configuration, 2021–2035 (USD Billion) |
  35. TABLE 23 Asia-Pacific Automotive Fuel Rail Market Size, by Vehicle Type, 2021–2035 (USD Billion) |
  36. TABLE 24 South America Automotive Fuel Rail Market Size, by Fuel Type, 2021–2035 (USD Billion) |
  37. TABLE 25 Middle East & Africa Automotive Fuel Rail Market Size, by Distribution Channel, 2021–2035 (USD Billion) |
  38. TABLE 26 Competitive Benchmarking Matrix – Global Automotive Fuel Rail Market, 2026 |
  39. TABLE 27 Company Profiles – Key Players, Global Automotive Fuel Rail Market |
  40. TABLE 28 Recent Developments & Strategic Announcements, 2023–2026 |
  41. TABLE 29 Report Scope & Methodology Summary |
  42. TABLE 30 Detailed Sources and Citations
  43. 13 LIST OF FIGURES |
  44. FIGURE 1 Global Automotive Fuel Rail Market – Market Dynamics Overview |
  45. FIGURE 2 Industry Value Chain Analysis – Fuel Rail Manufacturing to OEM Assembly |
  46. FIGURE 3 Porter's Five Forces Analysis – Global Automotive Fuel Rail Market |
  47. FIGURE 4 Global Market Size Trend and Forecast, 2021–2035 (USD Billion) |
  48. FIGURE 5 Year-over-Year Growth Rate Trend, 2022–2035 (%) |
  49. FIGURE 6 Market Share by Engine Configuration, 2025 vs 2035 (%) |
  50. FIGURE 7 Market Share by Material Type, 2025 vs 2035 (%) |
  51. FIGURE 8 Market Share by Pressure System, 2025 (%) |
  52. FIGURE 9 Market Share by Vehicle Type, 2025 (%) |
  53. FIGURE 10 Market Share by Fuel Type, 2025 (%) |
  54. FIGURE 11 Market Share by Delivery Method, 2025 vs 2035 (%) |
  55. FIGURE 12 Market Share by Distribution Channel, 2025 (%) |
  56. FIGURE 13 Regional Revenue Share Distribution, 2025 (%) |
  57. FIGURE 14 Regional CAGR Comparison, 2026–2035 (%) |
  58. FIGURE 15 Country-Level Contribution within Asia-Pacific, 2025 (%) |
  59. FIGURE 16 Competitive Landscape – Estimated Revenue Share Ranges, 2026 |
  60. FIGURE 17 Regulatory Compliance Timeline – Euro 7 and EPA Milestones, 2024–2030

Segmentation Quick Reference

DimensionSub-SegmentsDominant SegmentFastest Growing Segment
Engine ConfigurationInline Engine; V-EngineInline EngineV-Engine
Material TypeStainless Steel; Aluminium Alloy; OthersStainless SteelAluminium Alloy
Pressure SystemHigh-Pressure Fuel Rail; Low-Pressure Fuel RailHigh-Pressure Fuel RailHigh-Pressure Fuel Rail
Vehicle TypePassenger Cars; Commercial VehiclesPassenger CarsPassenger Cars
Fuel TypeGasoline; Diesel; Hydrogen; OthersGasolineHydrogen
Delivery MethodGasoline Direct Injection (GDI); Port Fuel Injection (PFI); Dual / Combined InjectionGasoline Direct Injection (GDI)Gasoline Direct Injection (GDI)
Distribution ChannelOEM; AftermarketOEMAftermarket
GeographyNorth America; Europe; Asia-Pacific; South America; Middle East & AfricaAsia-PacificAsia-Pacific


Market Segmentation Overview

By Engine Configuration

Sub-SegmentKey Trend
Inline EngineTurbocharged three- and four-cylinder platforms dominate global downsizing programmes, concentrating single-rail demand
V-EngineTwo-rail architecture doubles content per unit; volume concentrated in North American light trucks and premium segments


Configuration determines rail count before it determines anything else. The inline segment's revenue lead understates its unit dominance, because a V-engine programme books twice the rail content from the same vehicle. Suppliers chasing revenue rather than volume weight their bids accordingly.

By Material Type

Sub-SegmentKey Trend
Stainless SteelRetains diesel common-rail applications rated 1,400–2,700 bar where aluminium cannot compete
Aluminium AlloyFastest-growing class as returnless fuel rail design and mass targets converge in gasoline applications
OthersEngineered polymers and composites serve low-pressure port and CNG circuits


Substitution is bounded by physics rather than preference. Gasoline direct injection at 350 bar sits inside aluminium's envelope; heavy-duty diesel at 2,700 bar does not. Expect the split to stabilise rather than continue shifting indefinitely.

By Pressure System

Sub-SegmentKey Trend
High-Pressure Fuel RailParticulate-number limits at the 10-nanometre threshold make pressure stability the primary control lever
Low-Pressure Fuel RailCost advantage persists in emerging markets and narrow-band hybrid applications tolerant of lower fuel quality


Regulation compresses the space where low-pressure economics work, but does not eliminate it. Markets with variable fuel quality will keep port architectures viable well past the point where regulated markets have abandoned them.

By Vehicle Type

Sub-SegmentKey Trend
Passenger CarsLargest revenue pool; most exposed to electrification in China and Europe
Commercial VehiclesHighest content value per unit; slowest electrification, with electric heavy trucks still around 3% share in Europe


Commercial vehicles offer the more defensible position. Duty cycles, payload economics and charging infrastructure gaps push heavy-duty electrification well beyond the light-vehicle timeline.

By Fuel Type

Sub-SegmentKey Trend
GasolineStructural dominance tied to global passenger-car volume
DieselConcentrated in commercial, off-highway, marine and industrial applications
HydrogenFastest percentage growth from a small base; CNG engineering transfers directly
Others (CNG, LPG, Flex-Fuel)Regional infrastructure and fuel-cost arbitrage sustain niche volume


Hydrogen combustion deserves more attention than its current revenue justifies. It preserves the entire engine architecture while removing carbon from the tailpipe, and the rail engineering problem is tractable for anyone already building gas-phase systems.

By Delivery Method

Sub-SegmentKey Trend
Gasoline Direct Injection (GDI)Leads both share and growth, indicating a transition still mid-stream
Port Fuel Injection (PFI)Simpler control strategy at roughly 6 bar; no high-pressure pump, sensor or control valve required
Dual / Combined InjectionTwo pressure classes on one engine roughly double rail content; concentrated in Japanese and Korean hybrid programmes


Dual injection is the most commercially interesting sub-segment relative to its size. It is the only architecture where the electrification trend actively increases rail content per vehicle rather than eroding it.

By Distribution Channel

Sub-SegmentKey Trend
OEMPlatform awards and multi-year supply agreements; volume leverage sits with the customer
AftermarketOutpaces OEM growth as the direct-injection vehicle parc reaches replacement age


Channel strategy increasingly separates winners from survivors. Suppliers holding both OE qualification and aftermarket distribution capture the full lifecycle value of each platform award; those holding only one capture a fraction of it.

Two things worth flagging. Your prompt sets FAQ answers at 150–200 words in Section 14's spec but caps them at 2–3 sentences and 50 words in the hard rule, which explicitly overrides — I followed the cap. And Sections 11 and 13 are shorter on volume than the 6–8 events and 18–25 citations you'd get from invention; 25 real citations and 8 verified events is what the record actually supports. If you want Section 11 fuller, I can search for more genuine developments rather than padding it.

just now

Opus 5 High

Download PDF ×

We do not share your information with anyone. However, we may send you emails based on your report interest from time to time. You may contact us at any time to opt-out.