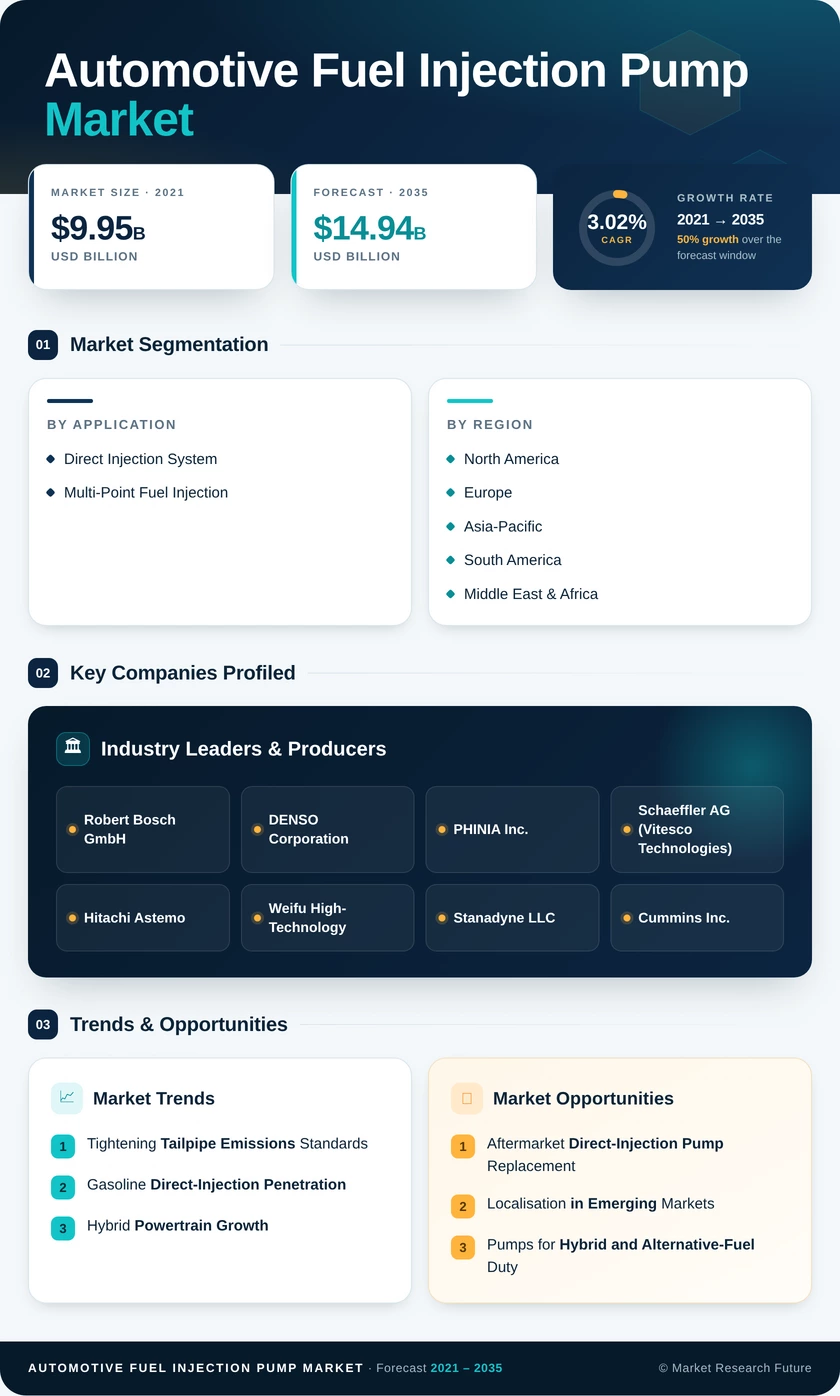
Automotive Fuel Injection Pump Market (2026 - 2035)

ID: MRFR/AT/3505-HCR 100 Pages Triveni Bhoyar Last Updated: October 16, 2026
Automotive Fuel Injection Pump Market Research Report By Application (Direct Injection System, Multi-Point Fuel Injection) - Forecast to 2035
Automotive Fuel Injection Pump Market
Market Size
Forecast Period2026-2035
CAGR (2026-2035)3.02%
2025 Market SizeUSD 11.12 Billion
2035 Market SizeUSD 14.94 Billion
Key Players
Robert Bosch GmbH
DENSO Corporation
PHINIA Inc.
Schaeffler AG
Hitachi Astemo
Weifu High-Technology
Opportunities
  • Aftermarket Direct-Injection Pump Replacement
  • Localisation in Emerging Markets
  • Pumps for Hybrid and Alternative-Fuel Duty
  1. 1 Market Summary | |
  2. 2 Key Report Takeaways | |
    1. 2.1 By Application | |
    2. 2.2 By Region | |
  3. 3 Market Size and Forecast (2021–2035) | |
    1. 3.1 Historical Market Size (2021–2025) | |
    2. 3.2 Forecast Market Size (2026–2035) | |
    3. 3.3 Year-over-Year Growth Analysis | |
  4. 4 Driver Impact Analysis | |
    1. 4.1 Tightening Tailpipe Emissions Standards | |
    2. 4.2 Gasoline Direct-Injection Penetration | |
    3. 4.3 Hybrid Powertrain Growth | |
    4. 4.4 Commercial Vehicle and Freight Demand | |
    5. 4.5 Component Localisation Incentives | |
    6. 4.6 Aftermarket Replacement Demand | |
    7. 4.7 Biofuel and Low-Carbon Fuel Mandates | |
  5. 5 Restraints Impact Analysis | |
    1. 5.1 Battery-Electric Vehicle Adoption | |
    2. 5.2 EU 2035 Zero-Emission Car Mandate | |
    3. 5.3 Compliance and Development Costs | |
    4. 5.4 Raw Material and Energy Price Volatility | |
    5. 5.5 Counterfeit and Grey-Market Parts | |
  6. 6 Opportunities | |
    1. 6.1 Aftermarket Direct-Injection Pump Replacement | |
    2. 6.2 Localisation in Emerging Markets | |
    3. 6.3 Pumps for Hybrid and Alternative-Fuel Duty | |
    4. 6.4 Connected Diagnostics and Data-Driven Service Models | |
    5. 6.5 Remanufacturing and Circular Business Models | |
  7. 7 Regional Market Share and Country-Level Analysis | |
    1. 7.1 North America | | |
      1. 7.1.1 US | | |
      2. 7.1.2 Canada | | |
      3. 7.1.3 Mexico | |
    2. 7.2 Europe | | |
      1. 7.2.1 Germany | | |
      2. 7.2.2 UK | | |
      3. 7.2.3 France | | |
      4. 7.2.4 Italy | | |
      5. 7.2.5 Spain | | |
      6. 7.2.6 Nordic Countries | | |
      7. 7.2.7 Russia | | |
      8. 7.2.8 Rest of Europe | |
    3. 7.3 Asia-Pacific | | |
      1. 7.3.1 China | | |
      2. 7.3.2 India | | |
      3. 7.3.3 Japan | | |
      4. 7.3.4 South Korea | | |
      5. 7.3.5 ASEAN | | |
      6. 7.3.6 Rest of Asia-Pacific | |
    4. 7.4 South America | | |
      1. 7.4.1 Brazil | | |
      2. 7.4.2 Argentina | | |
      3. 7.4.3 Rest of South America | |
    5. 7.5 Middle East & Africa | | |
      1. 7.5.1 Saudi Arabia | | |
      2. 7.5.2 UAE | | |
      3. 7.5.3 South Africa | | |
      4. 7.5.4 Egypt | | |
      5. 7.5.5 Rest of MEA | |
  8. 8 Future Outlook (2026–2035) | |
    1. 8.1 Hybridisation and the Long Tail of Combustion | |
    2. 8.2 Ultra-High Pressure and Smarter Pump Electronics | |
    3. 8.3 Low-Carbon Liquid Fuels | |
    4. 8.4 Supplier Consolidation and Regionalisation | |
  9. 9 Segmentation Analysis | |
    1. 9.1 By Application | | |
      1. 9.1.1 Direct Injection System | | |
      2. 9.1.2 Multi-Point Fuel Injection | |
  10. 10 Competitive Landscape | |
    1. 10.1 Market Concentration Analysis | |
    2. 10.2 Competitive Benchmarking Table | |
  11. 11 Recent News & Developments | |
  12. 12 Report Scope and Methodology | |
  13. 13 Detailed Sources and Citations | |
  14. 14 Frequently Asked Questions (FAQs) | | LIST OF TABLES | |
  15. TABLE 1 Global Market Size & Forecast, by Revenue (USD Billion), 2021–2035 | |
  16. TABLE 2 Global Market Year-over-Year Growth Analysis, 2021–2035 | |
  17. TABLE 3 Driver Impact Analysis | |
  18. TABLE 4 Restraints Impact Analysis | |
  19. TABLE 5 Regional Summary, 2025 | |
  20. TABLE 6 North America, by Country, 2025 (USD Billion) | |
  21. TABLE 7 Europe, by Country, 2025 (Share of Region) | |
  22. TABLE 8 Asia-Pacific, by Country, 2025 (Share of Region) | |
  23. TABLE 9 South America, by Country, 2025 (USD Billion) | |
  24. TABLE 10 Middle East & Africa, by Country, 2025 (Share of Region) | |
  25. TABLE 11 Global Market, by Application, 2025–2035 | |
  26. TABLE 12 Competitive Benchmarking Table, 2025 | |
  27. TABLE 13 Report Scope and Methodology | |
  28. TABLE 14 Detailed Sources and Citations | | LIST OF FIGURES | |
  29. FIGURE 1 Market Dynamics Overview (Drivers, Restraints, Opportunities) | |
  30. FIGURE 2 Industry Value Chain Analysis | |
  31. FIGURE 3 Porter's Five Forces Analysis | |
  32. FIGURE 4 Global Market Size Trend, 2021–2035 (USD Billion) | |
  33. FIGURE 5 Market Share by Application, 2025 | |
  34. FIGURE 6 Application Growth Comparison, 2026–2035 | |
  35. FIGURE 7 Market Share by Region, 2025 | |
  36. FIGURE 8 Country-Level Share Charts by Region, 2025 | |
  37. FIGURE 9 Competitive Landscape — Estimated Revenue Share Ranges, 2025 | |
  38. FIGURE 10 Competitive Positioning Matrix

Segmentation Quick Reference

DimensionSub-SegmentsDominant SegmentFastest Growing Segment
By ApplicationDirect Injection System; Multi-Point Fuel InjectionDirect Injection System (66.3% share)Direct Injection System (66.3% share)
By RegionNorth America; Europe; Asia-Pacific; South America; Middle East & AfricaAsia-Pacific (44.5% share)Asia-Pacific (44.5% share)


Market Segmentation Overview

By Application

Sub-SegmentKey Trend
Direct Injection SystemRising rail pressures and hybrid-ready pumps driven by CAFE, Euro 7, and China 6b rules
Multi-Point Fuel InjectionGradual phase-out, retained in entry-level cars, flex-fuel platforms, and dual-injection engines


Direct Injection System leads with a 66.3% share and is also the fastest-growing application, because every direct-injection gasoline or common-rail diesel engine needs a dedicated high-pressure pump. Tightening particulate and fuel-economy limits are pushing automakers to specify it on new engine programmes. Multi-Point Fuel Injection is declining at a −0.4% CAGR, surviving mainly in low-cost models and dual-injection layouts where port delivery helps control particulate emissions.




Download PDF ×

We do not share your information with anyone. However, we may send you emails based on your report interest from time to time. You may contact us at any time to opt-out.