Automotive Exhaust Aftertreatment System Market (2026 - 2035)

ID: MRFR/AT/32682-HCR 128 Pages Triveni Bhoyar Last Updated: October 16, 2026
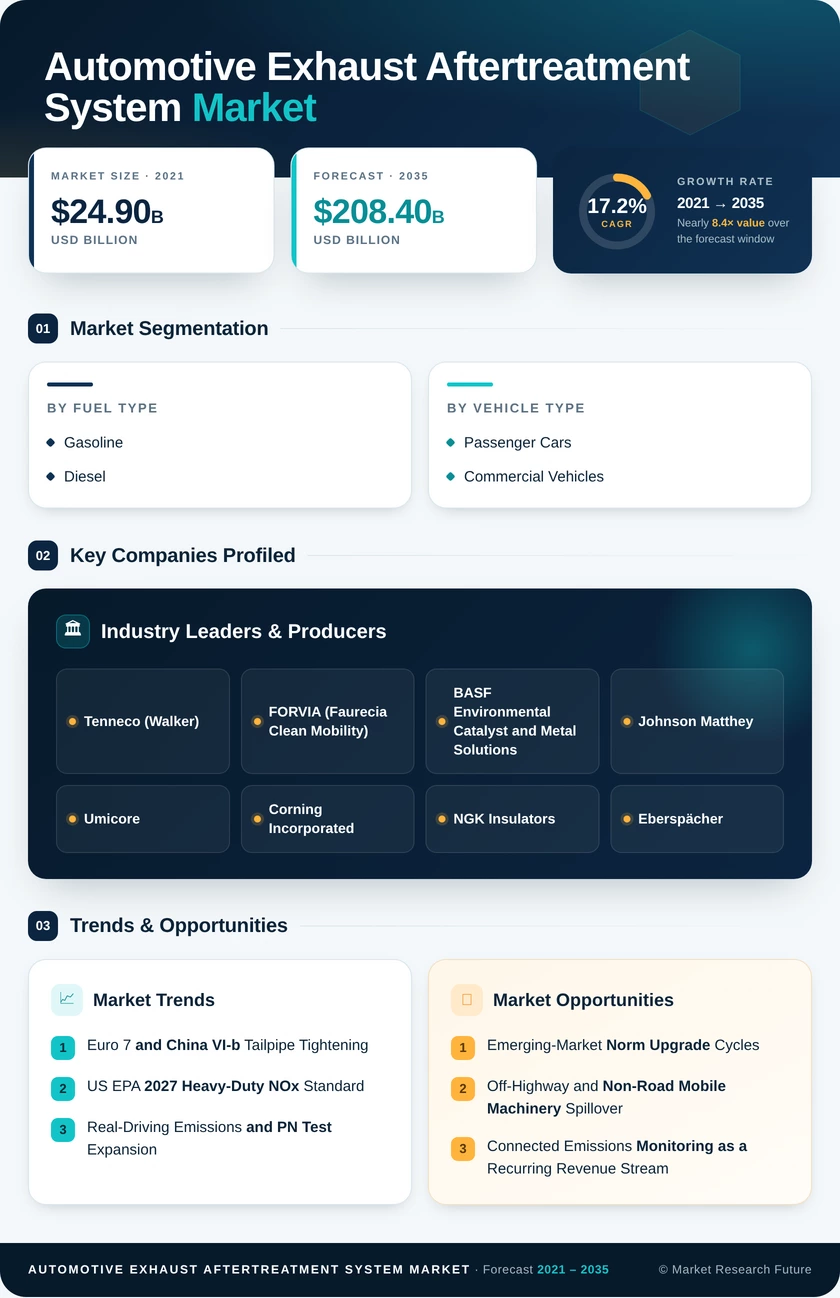
Automotive Exhaust Aftertreatment System Market Research Report By Fuel Type (Gasoline, Diesel), By Vehicle Type (Passenger Cars, Commercial Vehicles) - Forecast to 2035
Automotive Exhaust Aftertreatment System Market
Market Size
Forecast Period2026-2035
CAGR (2026-2035)17.2%
2025 Market SizeUSD 42.6 Billion
2035 Market SizeUSD 208.4 billion
Key Players
Tenneco
FORVIA
BASF Environmental Catalyst and Metal Solutions
Johnson Matthey
Umicore
Corning Incorporated
Opportunities
  • Emerging-Market Norm Upgrade Cycles
  • Off-Highway and Non-Road Mobile Machinery Spillover
  • Connected Emissions Monitoring as a Recurring Revenue Stream
  1. 1 Market Summary | |
    1. 1.1 Study Assumptions & Market Definition | |
    2. 1.2 Scope of the Study | |
    3. 1.3 Research Methodology | |
  2. 2 Key Report Takeaways | |
    1. 2.1 By Fuel Type | |
    2. 2.2 By Vehicle Type | |
    3. 2.3 By Region | |
  3. 3 Market Size and Forecast (2021–2035) | |
    1. 3.1 Historical Market Size (2021–2024) | |
    2. 3.2 Base Year Assessment (2025) | |
    3. 3.3 Current & Forecast Market Size (2026–2035) | |
    4. 3.4 Year-over-Year Growth Analysis | |
  4. 4 Driver Impact Analysis | |
    1. 4.1 Euro 7 and China VI-b Tailpipe Tightening | |
    2. 4.2 US EPA 2027 Heavy-Duty NOx Standard | |
    3. 4.3 Real-Driving Emissions and PN Test Expansion | |
    4. 4.4 Emerging-Market Norm Convergence | |
    5. 4.5 Hybrid Powertrain Proliferation | |
    6. 4.6 Aftermarket Replacement and Retrofit Demand | |
    7. 4.7 Catalyst Formulation and PGM-Thrifting Innovation | |
  5. 5 Restraints Impact Analysis | |
    1. 5.1 Battery-Electric Adoption Shrinking the ICE Parc | |
    2. 5.2 Platinum Group Metal Price and Supply Volatility | |
    3. 5.3 System Cost and Packaging Constraints | |
    4. 5.4 Urea Infrastructure Gaps and Regeneration Failures | |
    5. 5.5 Tampering, Defeat Devices and Warranty Liability | |
  6. 6 Opportunities | |
    1. 6.1 Emerging-Market Norm Upgrade Cycles | |
    2. 6.2 Off-Highway and Non-Road Mobile Machinery Spillover | |
    3. 6.3 Connected Emissions Monitoring as a Recurring Revenue Stream | |
    4. 6.4 Hydrogen and Ammonia Combustion Aftertreatment | |
    5. 6.5 Platinum Group Metal Recovery and Closed-Loop Supply | |
  7. 7 Regional Market Share and Country-Level Analysis | |
    1. 7.1 North America | | |
      1. 7.1.1 United States | | |
      2. 7.1.2 Canada | | |
      3. 7.1.3 Rest of North America | |
    2. 7.2 Europe | | |
      1. 7.2.1 Germany | | |
      2. 7.2.2 United Kingdom | | |
      3. 7.2.3 France | | |
      4. 7.2.4 Spain | | |
      5. 7.2.5 Rest of Europe | |
    3. 7.3 Asia-Pacific | | |
      1. 7.3.1 China | | |
      2. 7.3.2 Japan | | |
      3. 7.3.3 India | | |
      4. 7.3.4 South Korea | | |
      5. 7.3.5 Rest of Asia-Pacific | |
    4. 7.4 South America | | |
      1. 7.4.1 Brazil | | |
      2. 7.4.2 Argentina | | |
      3. 7.4.3 Rest of South America | |
    5. 7.5 Middle East & Africa | | |
      1. 7.5.1 Saudi Arabia | | |
      2. 7.5.2 United Arab Emirates | | |
      3. 7.5.3 South Africa | | |
      4. 7.5.4 Egypt | | |
      5. 7.5.5 Rest of Middle East & Africa | |
  8. 8 Future Outlook (2026–2035) | |
    1. 8.1 Sensor Fusion and Model-Based Emissions Control | |
    2. 8.2 The Internal Combustion Long Tail | |
    3. 8.3 Platinum Group Metal Circularity Economics | |
    4. 8.4 Lifecycle Accounting and Scope 3 Disclosure | |
  9. 9 Segmentation Analysis | |
    1. 9.1 By Fuel Type | | |
      1. 9.1.1 Gasoline | | |
      2. 9.1.2 Diesel | |
    2. 9.2 By Vehicle Type | | |
      1. 9.2.1 Passenger Cars | | |
      2. 9.2.2 Commercial Vehicles | |
  10. 10 Competitive Landscape | |
    1. 10.1 Market Concentration Analysis (2026) | |
    2. 10.2 Competitive Benchmarking Matrix | |
    3. 10.3 Company Profiles | | |
      1. 10.3.1 Tenneco | | |
      2. 10.3.2 FORVIA (Faurecia Clean Mobility) | | |
      3. 10.3.3 BASF Environmental Catalyst and Metal Solutions | | |
      4. 10.3.4 Johnson Matthey | | |
      5. 10.3.5 Umicore | | |
      6. 10.3.6 Corning Incorporated | | |
      7. 10.3.7 NGK Insulators | | |
      8. 10.3.8 Eberspächer | | |
      9. 10.3.9 Robert Bosch | | |
      10. 10.3.10 Cummins Emission Solutions | | |
      11. 10.3.11 Donaldson Company | |
  11. 11 Recent News & Developments | |
  12. 12 Report Scope and Methodology | |
  13. 13 Detailed Sources and Citations | |
  14. 14 Frequently Asked Questions (FAQs) | | LIST OF TABLES | |
  15. TABLE 1 Global Automotive Exhaust Aftertreatment System Market Size & Forecast, by Revenue (USD Billion), 2021–2035 | |
  16. TABLE 2 Global Automotive Exhaust Aftertreatment System Market – Year-over-Year Growth Analysis, 2021–2035 | |
  17. TABLE 3 Driver Impact Analysis – Estimated Contribution to CAGR, 2026–2035 | |
  18. TABLE 4 Restraint Impact Analysis – Estimated Drag on CAGR, 2026–2035 | |
  19. TABLE 5 Global Market Size, by Fuel Type, 2021–2035 (USD Billion) | |
  20. TABLE 6 Global Market Size, by Vehicle Type, 2021–2035 (USD Billion) | |
  21. TABLE 7 Global Market Size, by Region, 2021–2035 (USD Billion) | |
  22. TABLE 8 North America Market Size, by Country, 2021–2035 (USD Billion) | |
  23. TABLE 9 Europe Market Size, by Country, 2021–2035 (USD Billion) | |
  24. TABLE 10 Asia-Pacific Market Size, by Country, 2021–2035 (USD Billion) | |
  25. TABLE 11 South America Market Size, by Country, 2021–2035 (USD Billion) | |
  26. TABLE 12 Middle East & Africa Market Size, by Country, 2021–2035 (USD Billion) | |
  27. TABLE 13 North America Market Size, by Fuel Type, 2021–2035 (USD Billion) | |
  28. TABLE 14 North America Market Size, by Vehicle Type, 2021–2035 (USD Billion) | |
  29. TABLE 15 Europe Market Size, by Fuel Type, 2021–2035 (USD Billion) | |
  30. TABLE 16 Europe Market Size, by Vehicle Type, 2021–2035 (USD Billion) | |
  31. TABLE 17 Asia-Pacific Market Size, by Fuel Type, 2021–2035 (USD Billion) | |
  32. TABLE 18 Asia-Pacific Market Size, by Vehicle Type, 2021–2035 (USD Billion) | |
  33. TABLE 19 South America Market Size, by Fuel Type, 2021–2035 (USD Billion) | |
  34. TABLE 20 South America Market Size, by Vehicle Type, 2021–2035 (USD Billion) | |
  35. TABLE 21 Middle East & Africa Market Size, by Fuel Type, 2021–2035 (USD Billion) | |
  36. TABLE 22 Middle East & Africa Market Size, by Vehicle Type, 2021–2035 (USD Billion) | |
  37. TABLE 23 United States Market Size, by Vehicle Type, 2021–2035 (USD Billion) | |
  38. TABLE 24 China Market Size, by Fuel Type, 2021–2035 (USD Billion) | |
  39. TABLE 25 Germany Market Size, by Vehicle Type, 2021–2035 (USD Billion) | |
  40. TABLE 26 India Market Size, by Fuel Type, 2021–2035 (USD Billion) | |
  41. TABLE 27 Competitive Benchmarking Matrix, 2026 | |
  42. TABLE 28 Company Profiles – Key Players | |
  43. TABLE 29 Recent Developments & Strategic Announcements, 2023–2025 | |
  44. TABLE 30 Report Scope & Methodology Summary | |
  45. TABLE 31 Detailed Sources and Citations | | LIST OF FIGURES | |
  46. FIGURE 1 Market Dynamics – Drivers, Restraints, Opportunities and Challenges | |
  47. FIGURE 2 Industry Value Chain Analysis | |
  48. FIGURE 3 Porter's Five Forces Analysis | |
  49. FIGURE 4 Global Market Size Trend and Forecast, 2021–2035 (USD Billion) | |
  50. FIGURE 5 Year-over-Year Growth Rate Trend, 2022–2035 (%) | |
  51. FIGURE 6 Market Share by Fuel Type, 2025 vs 2035 (%) | |
  52. FIGURE 7 Market Share by Vehicle Type, 2025 vs 2035 (%) | |
  53. FIGURE 8 Regional Market Share Distribution, 2025 (%) | |
  54. FIGURE 9 Regional CAGR Comparison, 2026–2035 (%) | |
  55. FIGURE 10 North America Country-Level Share Breakdown, 2025 (%) | |
  56. FIGURE 11 Europe Country-Level Share Breakdown, 2025 (%) | |
  57. FIGURE 12 Asia-Pacific Country-Level Share Breakdown, 2025 (%) | |
  58. FIGURE 13 South America Country-Level Share Breakdown, 2025 (%) | |
  59. FIGURE 14 Middle East & Africa Country-Level Share Breakdown, 2025 (%) | |
  60. FIGURE 15 Competitive Landscape – Estimated Revenue Share Positioning, 2026 | |
  61. FIGURE 16 Content per Vehicle by Emissions Tier and Vehicle Class (USD) | |
  62. FIGURE 17 Platinum Group Metal Price Volatility and Supplier Margin Sensitivity

Segmentation Quick Reference

DimensionSub-SegmentsDominant SegmentFastest Growing Segment
By Fuel TypeGasoline; DieselDiesel (53.2% share, 2025)Gasoline (19.1% CAGR, 2026–2035)
By Vehicle TypePassenger Cars; Commercial VehiclesPassenger Cars (58.4% share, 2025)Commercial Vehicles (18.3% CAGR, 2026–2035)


Market Segmentation Overview

By Fuel Type

Sub-SegmentKey Trend
GasolineParticulate filtration becomes standard on direct-injection engines; three-way catalyst loading rises to meet 10 nm particle counting thresholds
DieselDual-dosing urea injection and heated dosers replace single-doser architectures to hold conversion efficiency at low exhaust temperatures


Diesel remains the larger fuel-type segment because a compliant diesel line carries four distinct devices in series where a gasoline line carries two, and because commercial diesel duty cycles drive replacement volume that gasoline passenger use does not. Gasoline is nonetheless the faster-growing sub-segment, since particulate number limits converted filtration from an option into a requirement across direct-injection platforms in Europe, China, and India within a single regulatory cycle. Buyers here are high-volume passenger car OEMs optimising for cold-start light-off within tight underbody packaging, which favours close-coupled placement and thinner-wall substrates. The gap narrows through 2035 without closing.

By Vehicle Type

Sub-SegmentKey Trend
Passenger CarsEuro 7 durability extension to 200,000 km raises substrate thermal specification and warranty provisioning
Commercial VehiclesUseful-life requirements up to 800,000 miles under EPA 2027 force durability re-engineering and higher-grade materials


Passenger cars lead on revenue share because global light-vehicle output exceeds commercial output by roughly four to one, and that volume advantage outweighs the higher per-unit content commercial systems carry. Commercial vehicles grow faster, however, because regulators concentrate stringency there: extended useful-life mandates in the United States and Euro 7 heavy-duty provisions in Europe both raise material specification and validation cost per unit. Fleet buyers in this sub-segment purchase on total cost of ownership rather than sticker price, which supports premium pricing for systems that demonstrably avoid derate events and warranty claims across an 800,000-mile service life.




Download PDF ×

We do not share your information with anyone. However, we may send you emails based on your report interest from time to time. You may contact us at any time to opt-out.