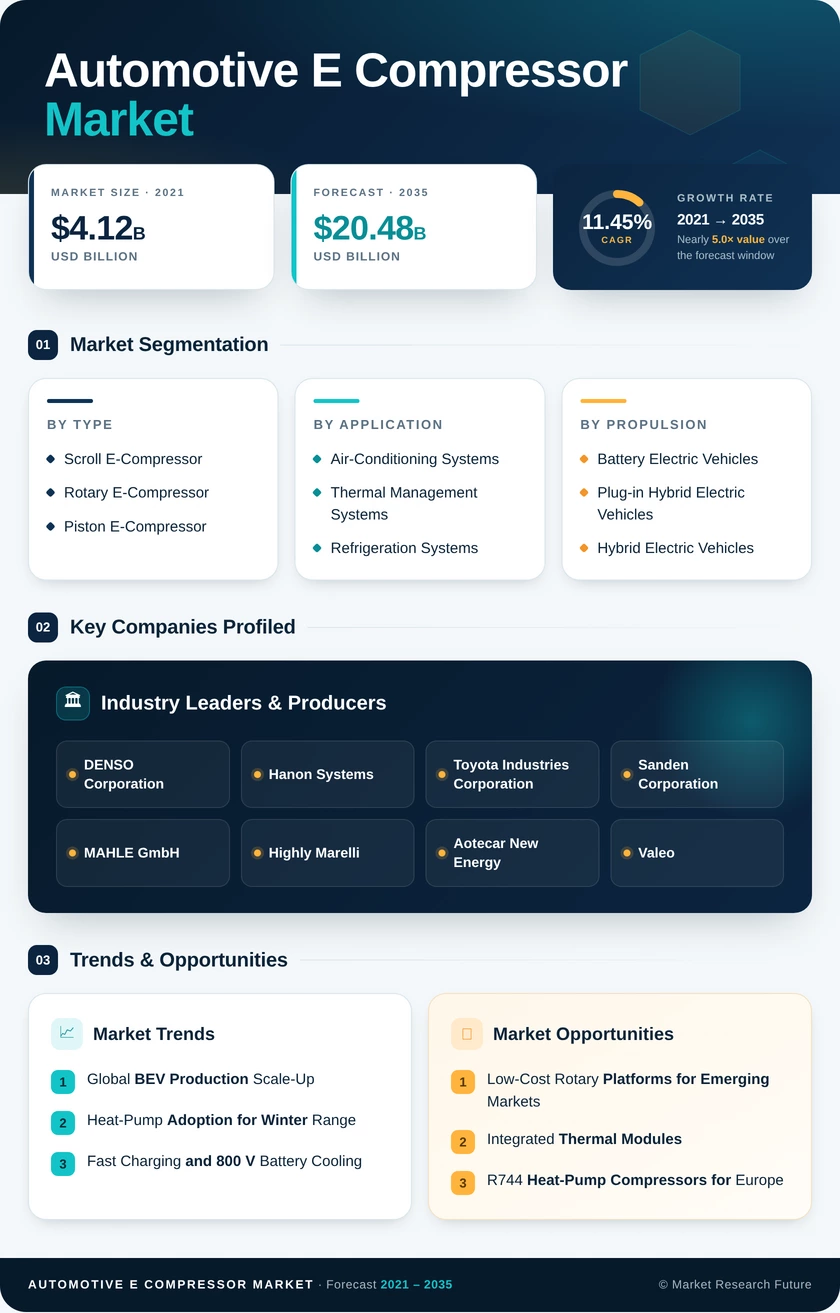
Automotive Electric Compressor Market (2026 - 2035)

ID: MRFR/AT/8961-HCR 100 Pages Triveni Bhoyar Last Updated: November 13, 2026
Automotive Electric Compressor Market Research Report By Type (Scroll E-Compressor, Rotary E-Compressor, Piston E-Compressor), By Application (Air-Conditioning Systems, Thermal Management Systems, Refrigeration Systems, Electric-Vehicle Heating Systems), By Propulsion (Battery Electric Vehicles, Plug-in Hybrid Electric Vehicles, Hybrid Electric Vehicles), By Vehicle Type (Passenger Cars, Light Commercial Vehicles, Medium and Heavy Commercial Vehicles) - Forecast to 2035
Automotive Electric Compressor Market
Market Size
Forecast Period2026-2035
CAGR (2026-2035)11.45%
2025 Market SizeUSD 6.93 Billion
2035 Market SizeUSD 20.48 Billion
Key Players
DENSO Corporation
Hanon Systems
Toyota Industries Corporation
Sanden Corporation
MAHLE GmbH
Highly Marelli
Opportunities
  • Low-Cost Rotary Platforms for Emerging Markets
  • Integrated Thermal Modules
  • R744 Heat-Pump Compressors for Europe
  1. 1 Market Summary | |
  2. 2 Key Report Takeaways | |
    1. 2.1 By Type | |
    2. 2.2 By Application | |
    3. 2.3 By Propulsion | |
    4. 2.4 By Vehicle Type | |
    5. 2.5 By Region | |
  3. 3 Market Size and Forecast (2021–2035) | |
  4. 4 Driver Impact Analysis | |
    1. 4.1 Global BEV Production Scale-Up | |
    2. 4.2 Heat-Pump Adoption for Winter Range | |
    3. 4.3 Fast Charging and 800 V Battery Cooling | |
    4. 4.4 Zero-Emission and CO2 Regulations | |
    5. 4.5 Commercial Fleet Electrification | |
    6. 4.6 Purchase Incentives and Industrial Programs | |
    7. 4.7 Transition to Low-GWP and Natural Refrigerants | |
  5. 5 Restraints Impact Analysis | |
    1. 5.1 High System Cost Versus Mechanical Units | |
    2. 5.2 Rare-Earth Magnet and Semiconductor Supply Concentration | |
    3. 5.3 Policy Volatility in North America | |
    4. 5.4 PFAS-Related Refrigerant Uncertainty | |
    5. 5.5 NVH and Durability Challenges at High Voltage | |
  6. 6 Opportunities | |
    1. 6.1 Low-Cost Rotary Platforms for Emerging Markets | |
    2. 6.2 Integrated Thermal Modules | |
    3. 6.3 R744 Heat-Pump Compressors for Europe | |
    4. 6.4 Connected Compressor Data and Fleet Service Models | |
    5. 6.5 Remanufacturing and Aftermarket Supply | |
  7. 7 Regional Market Share and Country-Level Analysis | |
    1. 7.1 North America | | |
      1. 7.1.1 US | | |
      2. 7.1.2 Canada | | |
      3. 7.1.3 Mexico | |
    2. 7.2 Europe | | |
      1. 7.2.1 Germany | | |
      2. 7.2.2 UK | | |
      3. 7.2.3 France | | |
      4. 7.2.4 Italy | | |
      5. 7.2.5 Spain | | |
      6. 7.2.6 Nordic Countries | | |
      7. 7.2.7 Russia | | |
      8. 7.2.8 Rest of Europe | |
    3. 7.3 Asia-Pacific | | |
      1. 7.3.1 China | | |
      2. 7.3.2 India | | |
      3. 7.3.3 Japan | | |
      4. 7.3.4 South Korea | | |
      5. 7.3.5 ASEAN | | |
      6. 7.3.6 Rest of Asia-Pacific | |
    4. 7.4 South America | | |
      1. 7.4.1 Brazil | | |
      2. 7.4.2 Argentina | | |
      3. 7.4.3 Rest of South America | |
    5. 7.5 Middle East & Africa | | |
      1. 7.5.1 Saudi Arabia | | |
      2. 7.5.2 UAE | | |
      3. 7.5.3 South Africa | | |
      4. 7.5.4 Egypt | | |
      5. 7.5.5 Rest of MEA | |
  8. 8 Future Outlook (2026–2035) | |
    1. 8.1 The 800 V and Silicon-Carbide Transition | |
    2. 8.2 Software-Defined Thermal Control | |
    3. 8.3 Natural Refrigerants and Sustainability Reporting | |
    4. 8.4 Supply Chain Regionalization | |
  9. 9 Segmentation Analysis | |
    1. 9.1 By Type | | |
      1. 9.1.1 Scroll E-Compressor | | |
      2. 9.1.2 Rotary E-Compressor | | |
      3. 9.1.3 Piston E-Compressor | |
    2. 9.2 By Application | | |
      1. 9.2.1 Air-Conditioning Systems | | |
      2. 9.2.2 Thermal Management Systems | | |
      3. 9.2.3 Refrigeration Systems | | |
      4. 9.2.4 Electric-Vehicle Heating Systems | |
    3. 9.3 By Propulsion | | |
      1. 9.3.1 Battery Electric Vehicles | | |
      2. 9.3.2 Plug-in Hybrid Electric Vehicles | | |
      3. 9.3.3 Hybrid Electric Vehicles | |
    4. 9.4 By Vehicle Type | | |
      1. 9.4.1 Passenger Cars | | |
      2. 9.4.2 Light Commercial Vehicles | | |
      3. 9.4.3 Medium and Heavy Commercial Vehicles | |
  10. 10 Competitive Landscape | |
    1. 10.1 Market Concentration Analysis | |
    2. 10.2 Competitive Benchmarking Matrix | |
    3. 10.3 Company Profiles | | |
      1. 10.3.1 DENSO Corporation | | |
      2. 10.3.2 Hanon Systems | | |
      3. 10.3.3 Toyota Industries Corporation | | |
      4. 10.3.4 Sanden Corporation | | |
      5. 10.3.5 MAHLE GmbH | | |
      6. 10.3.6 Highly Marelli | | |
      7. 10.3.7 Aotecar New Energy | | |
      8. 10.3.8 Valeo | | |
      9. 10.3.9 Mitsubishi Heavy Industries Thermal Systems | | |
      10. 10.3.10 Brose Fahrzeugteile | |
  11. 11 Recent News & Developments | |
  12. 12 Report Scope and Methodology | |
  13. 13 Detailed Sources and Citations | |
  14. 14 Frequently Asked Questions (FAQs) | | LIST OF TABLES | |
  15. TABLE 1 Market Snapshot – Study Period, Market Size, CAGR, and Regional Leaders | |
  16. TABLE 2 Global Market Size & Forecast, by Revenue (USD Billion), 2021–2035 | |
  17. TABLE 3 Driver Impact Analysis, 2026–2035 | |
  18. TABLE 4 Restraints Impact Analysis, 2026–2035 | |
  19. TABLE 5 Regional Summary, 2025 | |
  20. TABLE 6 North America Country-Level Analysis, 2025 | |
  21. TABLE 7 Europe Country-Level Analysis, 2025 | |
  22. TABLE 8 Asia-Pacific Country-Level Analysis, 2025 | |
  23. TABLE 9 South America Country-Level Analysis, 2025 | |
  24. TABLE 10 Middle East & Africa Country-Level Analysis, 2025 | |
  25. TABLE 11 Segmentation by Type, 2025 | |
  26. TABLE 12 Segmentation by Application, 2025 | |
  27. TABLE 13 Segmentation by Propulsion, 2025 | |
  28. TABLE 14 Segmentation by Vehicle Type, 2025 | |
  29. TABLE 15 Competitive Benchmarking Matrix, 2025 | |
  30. TABLE 16 Report Scope and Methodology | |
  31. TABLE 17 Detailed Sources and Citations | |
  32. TABLE 18 Segmentation Quick Reference | |
  33. TABLE 19 Key Trends by Type | |
  34. TABLE 20 Key Trends by Application | |
  35. TABLE 21 Key Trends by Propulsion | |
  36. TABLE 22 Key Trends by Vehicle Type | | LIST OF FIGURES | |
  37. FIGURE 1 Market Dynamics Overview – Drivers, Restraints, and Opportunities | |
  38. FIGURE 2 Industry Value Chain Analysis | |
  39. FIGURE 3 Porter's Five Forces Analysis | |
  40. FIGURE 4 Global Market Size Trend, 2021–2035 (USD Billion) | |
  41. FIGURE 5 Market Share by Type, 2025 | |
  42. FIGURE 6 Market Share by Application, 2025 | |
  43. FIGURE 7 Market Share by Propulsion, 2025 | |
  44. FIGURE 8 Market Share by Vehicle Type, 2025 | |
  45. FIGURE 9 Regional Market Share, 2025 | |
  46. FIGURE 10 Regional Growth Comparison, 2026–2035 | |
  47. FIGURE 11 Estimated Revenue Share of Key Players, 2025 | |
  48. FIGURE 12 Competitive Positioning Matrix

Segmentation Quick Reference

DimensionSub-SegmentsDominant SegmentFastest Growing Segment
By TypeScroll E-Compressor, Rotary E-Compressor, Piston E-CompressorScroll E-Compressor — 55.4% shareRotary E-Compressor — 11.47% CAGR
By ApplicationAir-Conditioning Systems, Thermal Management Systems, Refrigeration SystemsAir-Conditioning Systems — 44.0% shareThermal Management Systems — 11.56% CAGR
By PropulsionBattery Electric Vehicles, Plug-in Hybrid Electric Vehicles, Hybrid Electric VehiclesBattery Electric Vehicles — 57.7% shareBattery Electric Vehicles — 57.7% share
By Vehicle TypePassenger Cars, Light Commercial Vehicles, Medium and Heavy Commercial VehiclesPassenger Cars — 55.3% shareMedium and Heavy Commercial Vehicles — 11.54% CAGR
By RegionNorth America, Europe, Asia-Pacific, South America, Middle East & AfricaAsia-Pacific — 52.4% shareMiddle East & Africa — 14.6% CAGR


Market Segmentation Overview

By Type

Sub-SegmentKey Trend
Scroll E-CompressorHigh-speed scrolls for 800 V heat-pump systems
Rotary E-CompressorScaled Chinese production for mini-EV platforms
Piston E-CompressorRetained for high-pressure CO2 commercial systems


Scroll E-Compressor leads with a 55.4% share because its valve-less compression suits the bidirectional flow and wide load range of heat pumps. Rotary E-Compressor grows fastest at an 11.47% CAGR, as its compact size and lower tooling cost fit sub-USD 25,000 EVs in emerging markets. Piston E-Compressor stays a niche choice for high-pressure CO2 duty in buses and refrigerated trucks.

By Application

Sub-SegmentKey Trend
Air-Conditioning SystemsStandard cabin cooling across all electrified vehicles
Thermal Management SystemsMerging of battery, inverter, and cabin loops
Refrigeration SystemsElectrified cold-chain delivery vans


Air-Conditioning Systems hold the leading 44.0% share since every electrified vehicle needs cabin cooling. Thermal Management Systems expand fastest at an 11.56% CAGR because fast charging and tighter cell temperature windows require active battery chilling. Refrigeration Systems add steady revenue as grocers electrify delivery fleets needing continuous cargo cooling.

By Propulsion

Sub-SegmentKey Trend
Battery Electric VehiclesMandatory e-compressor fitment and 800 V adoption
Plug-in Hybrid Electric VehiclesVolume support where charging lags
Hybrid Electric VehiclesDual-mode units tolerant of engine-bay heat

Battery Electric Vehicles lead with a 57.7% share and also grow fastest, because pure EVs have no engine to drive a mechanical compressor and zero-emission rules keep lifting their mix. Plug-in Hybrid Electric Vehicles contribute stable volume in regions with thin charging networks, though that role fades after 2028. Hybrid Electric Vehicles push suppliers toward heat-tolerant dual-mode designs.

By Vehicle Type

Sub-SegmentKey Trend
Passenger CarsHigh-volume BEV and hybrid platforms
Light Commercial VehiclesPassenger-car hardware with upgraded duty cycles
Medium and Heavy Commercial Vehicles10 kW-plus cooling loads and continuous duty


Passenger Cars lead with a 55.3% share of production volume alone. Medium and Heavy Commercial Vehicles grow fastest at an 11.54% CAGR, as heavy-duty CO2 rules and urban delivery mandates push electric trucks and buses that need high-capacity, reinforced compressors. Light Commercial Vehicles sit between the two, adapting passenger-car units for tougher fleet duty cycles.




Download PDF ×

We do not share your information with anyone. However, we may send you emails based on your report interest from time to time. You may contact us at any time to opt-out.