• Cat-intel
  • MedIntelliX
  • Resources
  • About Us
  • English
    Chinese
    French
    Japanese
    Korean
    German
    Spanish

    Automotive Coolant Market Size

    ID: MRFR/CnM/3245-CR
    274 Pages
    Anshula Mandaokar
    May 2023

    Automotive Coolant Market Research Report Information By Product (Ethylene Glycol, Propylene Glycol, Glycerin, and Others), By Vehicle Type (Passenger Car, Heavy Commercial Vehicles, Light Commercial Vehicles, and Others), By Technology (Inorganic Additive Technology (IAT), Organic Additive Technology (OAT), and Hybrid Organic Acid Technology (HOAT)), By End User (Original Equipment Manufacture...

    Share:
    Download PDF ×

    We do not share your information with anyone. However, we may send you emails based on your report interest from time to time. You may contact us at any time to opt-out.

    Automotive Coolant Market Infographic
    $ 4,950.0
    $ 5,950.0
    $ 7,250.0

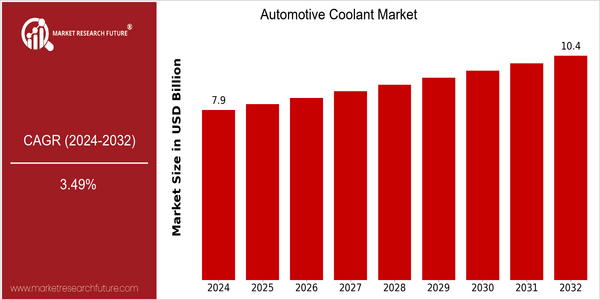
    Automotive Coolant Size

    Market Size Snapshot

    Year Value
    2024 USD 7.89 Billion
    2032 USD 10.39 Billion
    CAGR (2024-2032) 3.49 %

    Note – Market size depicts the revenue generated over the financial year

    The market for automobile cooling liquids is expected to grow steadily, reaching a size of $ 7,897 million in 2024, and growing to $ 10,397 million in 2032. This growth is equivalent to a CAGR of 3.49 % for the forecast period. The rising demand for efficient cooling systems in vehicles, driven by technological developments in the automobile industry and rising vehicle production, is a major factor in this growth. The need for high-performance coolants that can withstand high temperatures and increase the efficiency of engines is also increasing. The development of new, environment-friendly coolants and the introduction of smart cooling systems will also contribute to growth. The market is dominated by large companies such as BASF, Prestone Products, and Valvoline, which are investing heavily in research and development in order to develop superior coolants. Strategic alliances and product launches are also influencing the market. Recent industry collaborations aimed at improving coolant performance and the environment, for example, are a clear indication of the commitment of the industry to meet changing customer demands and regulatory standards. The automobile cooling liquids market is expected to continue its upward trend, driven by the rising production of vehicles and technological developments.

    home-ubuntu-www-mrf_ne_design-batch-5-cp-automotive-coolant-market size

    Regional Market Size

    Regional Deep Dive

    Among the many regions where the Coolant Market is growing, it is being driven by the rising production of automobiles, the increasing awareness of automobile maintenance, and the stricter regulations on the environment. Each region has its own characteristics, depending on the local car industry, the preferences of the consumers, and the legal framework. North America is characterized by its mature car industry and by its focus on advanced coolant formulations. Europe is characterized by its emphasis on environment-friendly products. The Asia-Pacific region is characterized by its rapid growth, based on the growing incomes of the consumers and the expanding production of automobiles. The Middle East and Africa are slowly developing their car industries, and Latin America is experiencing a resurgence in automobile sales, which is affecting the demand for coolants.

    Europe

    • Europe is the world leader in the development of low-toxic, environment-friendly coolants. This is partly due to the stringent European Union regulations on chemical substances. Companies such as BASF and Total Energy are at the forefront in developing these coolants.
    • In the European market the use of advanced cooling systems is becoming increasingly common. This includes the use of nanotechnology in coolants to improve their heat conductivity. This trend is supported by the Horizon 2020 programme of the European Commission.

    Asia Pacific

    • In the Asia-Pacific region, the production of motor vehicles is booming, particularly in China and India, and this has a direct effect on the demand for coolants. Major companies such as the China National Petroleum Company (CNPC) and Sinopec are expanding their product ranges to meet this growing demand.
    • A notable trend is the increasing use of hybrid and electric vehicles in the Asia-Pacific region. This is expected to increase the demand for specialized coolants for these vehicles. The shift towards hybrid and electric vehicles is a result of government subsidies and the development of charging stations.

    Latin America

    • The growing motorization of Latin America, especially in Brazil and Mexico, has had a positive influence on the development of the antifreeze market. The local companies are increasing their production to meet the growing demand for both conventional and green coolants.
    • Local manufacturers have also entered into associations with international firms, thus improving the quality and variety of the coolants produced in the region. The market competition is expected to be facilitated by this association, and coolant formulas are expected to become more sophisticated.

    North America

    • In the United States, the trend has been toward the use of biodegradable and organic coolants, owing to the increasing number of regulations and the demand for products which are regarded as economi-cal. In this field, the Prestone Products Corp. is making a name for itself with its formulations which meet the most stringent regulations.
    • North America is a region where the development of electric vehicles (EVs) is influencing the formulation of coolants, because the cooling of batteries requires special coolants. The main automobile manufacturers, such as General Motors and Tesla, are investing in research to develop effective cooling solutions for their EV models.

    Middle East And Africa

    • The Middle East and Africa are experiencing a gradual increase in the use of automobile cooling systems, mainly due to the growth of the automotive industry and the rising rate of vehicle ownership. Local manufacturers are beginning to offer cooling systems adapted to the local climate.
    • In the meantime, the regulatory framework in the region is gradually catching up with the global standards and encouraging the use of high-quality coolants. And initiatives such as those of the Gulf Cooperation Council (GCC) to improve vehicle maintenance are bound to boost the consumption of coolants.

    Did You Know?

    “Did you know that the automotive coolant market is increasingly shifting towards the use of propylene glycol-based coolants, which are considered safer for the environment and human health compared to traditional ethylene glycol-based coolants?” — Market Research Future

    Segmental Market Size

    The car coolant market is growing steadily. This is due to the rising demand for engine cooling solutions in cars. Also, the regulatory policies to reduce emissions and improve fuel economy are boosting the growth of this market. Advances in the coolant formulations, such as the development of long-lasting and environment-friendly coolants, are also driving the market. This market is currently in its mature adoption stage, with companies like Zerex and Prestone leading the way in the production of advanced coolants. The main application areas are cars, trucks, and heavy equipment, where temperature control is important for peak performance. The main trend driving the market is the focus on environment-friendly coolants, with many manufacturers producing bio-based coolants to meet the new standards. Nanotechnology and smart coolant systems are also shaping the evolution of this market, enhancing performance and life, and meeting the growing demand for reliability and efficiency.

    Future Outlook

    The global market for automotive coolant is expected to grow steadily from 2024 to 2032, with a CAGR of 3.49% from 2024 to 2032. This is mainly due to the growing demand for cooling systems in vehicles, resulting from the technological development of the automobile industry and the increase in the number of cars produced in the world. The popularity of electric vehicles will also increase the demand for specialized coolants that can operate in different temperature conditions. In 2032, the penetration of advanced coolants such as organic acid technology (OAT) and hybrid organic acid technology (HOAT) is expected to exceed 40% of the total market, indicating a shift towards more sustainable and high-performance solutions. The development of long-term coolants and the integration of smart coolant management systems will also help to improve the performance and life of vehicles, which will also increase the demand for coolants. In addition, the stricter regulations on fuel consumption and emissions will also force manufacturers to develop and adopt advanced coolants. The popularity of hybrid and electric vehicles will also require the development of specialized coolants to meet the special cooling needs of these vehicles. The automotive coolant market will therefore continue to develop and will become a major part of the automobile industry by 2032.

    Automotive Coolant Market Size Graph

    Market Summary

    As per Market Research Future Analysis, the global automotive coolant market was valued at USD 7.59 Billion in 2023 and is projected to reach USD 10.39 Billion by 2032, growing at a CAGR of 3.49% from 2024 to 2032. The market is driven by increasing vehicle production, investments in R&D for eco-friendly products, and the rising demand for ethylene glycol, which is essential for engine cooling. The passenger cars segment is the largest revenue generator, while the organic additive technology (OAT) segment leads in technology. North America holds the largest market share, with significant growth in the Asia-Pacific region, particularly in India and China.

    Key Market Trends & Highlights

    Key trends influencing the automotive coolant market include the following:

    • Automotive coolant market size in 2023: USD 7.59 Billion.
    • Projected market size by 2032: USD 10.39 Billion.
    • CAGR from 2024 to 2032: 3.49%.
    • Ethylene glycol segment dominates market revenue due to its critical role in engine cooling.

    Market Size & Forecast

    2023 Market Size USD 7.59 Billion
    2032 Market Size USD 10.39 Billion
    CAGR (2024-2032) 3.49%
    Largest Regional Market Share in 2024 North America.

    Major Players

    Key players include Exxon Mobil Corporation, BASF SE, TotalEnergies, Chevron Corporation, Shell Plc, Valvoline Inc., and others.

    Market Trends

    The growing usage of ethylene glycol in the automotive industry is driving market growth.

    Market CAGR for automotive coolant is driven by the rising demand for ethylene glycol in the automotive industry. Ethylene glycol has a significantly lower melting point than water, which keeps engines of ethylene from freezing in the winter and works as a coolant to avoid overheating in the summer. Also, ethylene glycol is used in vehicles to absorb combustion heat which is expected to generate lucrative opportunities for the automotive coolant market revenue.

    Automobile manufacturers are launching newer brands and products to offer customers customized automotive coolant and lubricant solutions, enhancing the automotive coolant market's share. Various OEMs are investing in the country through either joint ventures with introduced players or after FDI norms have been invested directly in setting up their production units or expanding their sales and dealership networks across the country.

    For instance, in December 2021, ExxonMobil announced that it had finalized corporate plans, which include increasing its spending to USD 15 billion on greenhouse gas emission-reduction assignments over the next six years while keeping disciplined capital acquisitions in its industry-leading portfolio.

    In addition, the increasing number of HVAC equipment in manufacturing industries is expected to impact market growth positively. Thus, the factors above are expected to drive the market size over the projected period. There are certain restraints and challenges faced which will hinder market growth.

    The automotive coolant market is poised for growth as advancements in engine technology and increasing vehicle production drive demand for high-performance cooling solutions.

    U.S. Department of Energy

    Automotive Coolant Market Market Drivers

    Increasing Vehicle Production

    The Global Automotive Coolant Market Industry is experiencing growth driven by the rising production of vehicles worldwide. In 2024, the market is projected to reach 7.89 USD Billion, reflecting the increasing demand for efficient cooling systems in modern vehicles. As manufacturers strive to enhance engine performance and longevity, the need for high-quality coolants becomes paramount. For instance, the introduction of advanced engine technologies necessitates the use of specialized coolants that can withstand higher temperatures and pressures. This trend is likely to continue, with the market expected to grow as vehicle production ramps up in emerging economies.

    Market Segment Insights

    Automotive Coolant Product Insights

    The automotive coolant market segmentation, based on product, includes ethylene glycol, propylene glycol, glycerin, and others. The ethylene glycol segment dominated the market, accounting for major market revenue. Ethylene glycol is widely used in car radiators for cooling as it has a lower freezing point than water. It aids in absorbing heat from engines preventing overheating of engines and its rising usage in automotive.

    Automotive Coolant Vehicle Type Insights

    The automotive coolant market segmentation, based on vehicle type, includes passenger cars, heavy commercial vehicles, light commercial vehicles, and others. The passenger cars category generated the most income over the forecast period due to rising demand for utility vehicles in densely populated countries such as China, India, and Brazil.

    Automotive Coolant Technology Insights

    The automotive coolant market segmentation, based on technology, includes inorganic additive technology (IAT), organic additive technology (OAT), and hybrid organic acid technology (HOAT). The organic additive technology (OAT) segment dominated the market, accounting for major market revenue over the forecast period. Prominent manufacturers are formulating automotive coolant through advanced technologies which assist in creating silica- and phosphate-free products driving the market segment.

    Automotive Coolant End User Insights

    The automotive coolant market segmentation, based on end users, includes Original Equipment Manufacturers (OEM) and Automotive Aftermarkets. The automotive aftermarket category generated the most income over the forecast period. This is owing to the presence of a massive number of commercial vehicles and passenger cars currently in transit worldwide, and most of them need after-sales servicing for maintenance purposes.

    Figure 1: Automotive Coolant Market by End User, 2022 & 2032 (USD billion)Source: Secondary Research, Primary Research, Market Research Future Database, and Analyst Review

    Get more detailed insights about Automotive Coolant Market Research Report – Global Forecast till 2032

    Regional Insights

    By Region, the study provides market insights into North America, Europe, Asia-Pacific, and the Rest of the World. The North America automotive coolant market will dominate this market, owing to increasing domestic production of automotive coolant that may help automotive coolant manufacturers cater to the rising demand for automotive coolants and boost the market growth in this region. Moreover, US automotive coolant market held the largest market share, and the Indian automotive coolant market was the fastest-growing market in the Asia-Pacific region.

    Further, the prominent countries studied in the market report are The U.S., Canada, German, France, the UK, Italy, Spain, China, Japan, India, Australia, South Korea, and Brazil.

    Figure 2: AUTOMATIVE COOLANT MARKET SHARE BY REGION 2022 (%) AUTOMATIVE COOLANT MARKET SHARE BY REGION 2022Source: Secondary Research, Primary Research, Market Research Future Database, and Analyst Review

    Europe automotive coolant market accounts for the second-largest market share due to the growing middle-class population, rising disposable income, developing surface transportation infrastructure, growing aspiration of owning private vehicles, increasing mobility due to the development of satellite townships near megacities, and increasing demand for goods carriers from micro, small and medium-sized enterprises for automotive coolant are fueling the market in this region. Further, the German automotive coolant market held the largest market share, and the UK automotive coolant market was the fastest-growing market in the European region.

    The Asia-Pacific automotive coolant market is expected to grow at the fastest CAGR from 2023 to 2032. This is due to the availability of inexpensive labor and raw material in the region, coupled with the increasing number of local manufacturers of automotive coolant, which is likely to propel the market in this region. Moreover, China automotive coolant market held the largest market share, and the India automotive coolant market was the fastest-growing market in the Asia-Pacific region.

    Key Players and Competitive Insights

    Leading market players are investing heavily in research and development to expand their product lines, which will help the automotive coolant market grow even more. Market participants are also undertaking several strategic activities to enhance their footprint, with important market developments including new product launches, contractual agreements, mergers and acquisitions, higher investments, and collaboration with other organizations. To expand and survive in a more competitive and rising market climate, the automotive coolant industry must offer cost-effective items.

    Manufacturing locally to minimize operational costs is one of the key business tactics manufacturers use in the automotive coolant industry to benefit clients and increase the market sector. Major players in the automotive coolant market, including Chevron Corporation, BP PLC, Royal Dutch Shell PLC, Exxon Mobil Corporation, Total SA, Lukoil, BASF SE, Petronas, Motul SA, Cummins Inc, and others, are attempting to increase market demand by investing in research and development operations.

    Valvoline Inc is a manufacturer and distributor of finished lubricants and automotive chemicals. The company offers passenger car motor oils and other automotive lubricant products. It also provides automotive chemicals, fluids, and coatings. The firm sells its products through retail auto part stores, mass merchandisers, independent auto part stores, and distributors. The firm has blending and packaging facilities located in the US, the Netherlands, Ecuador, India, and Australia. Valvoline's products discover applications in a range of vehicles and engines, such as light-duty, heavy-duty, and electric vehicles.

    In August 2021, Valvoline Inc. launched new automotive coolant technology specifically designed for modern engines: Valvoline Antifreeze Coolant HT-12™ Green and Valvoline Antifreeze Coolant HT-12 Pink.

    Amsoil Inc. produces synthetic lubricating oils. The Company offers fuel additives, filtration systems, motor and diesel oil, and other companion products that supplement and extend lubricant performance. Amsoil operates in Superior, Wisconsin, and markets to customers worldwide. In February 2021, AMSOIL introduced a new Powersports Antifreeze & Coolant designed to cool high-revving, hot-running Powersports engines. Featuring an ethylene-glycol formulation that meets OEM recommendations, the automotive coolant provides an extended five-year service life with excellent boil-over protection up to 226 F (108°C) and freeze protection down to -34°F (-37°C).

    Key Companies in the Automotive Coolant Market market include

    Industry Developments

    • Q2 2024: BASF launches new Glysantin® G64 engine coolant for modern engines BASF announced the launch of its new Glysantin® G64 engine coolant, designed to meet the requirements of modern downsized engines and hybrid vehicles, expanding its product portfolio in the automotive coolant sector.
    • Q2 2024: Valvoline Inc. Announces Opening of New Manufacturing Facility in China Valvoline Inc. opened a new manufacturing facility in China to increase production capacity for automotive coolants and lubricants, aiming to meet growing demand in the Asia-Pacific region.
    • Q3 2024: Chevron and Cummins announce partnership to develop next-generation engine coolants Chevron and Cummins entered a strategic partnership to co-develop advanced engine coolants tailored for high-efficiency commercial vehicles, focusing on improved thermal management and sustainability.
    • Q3 2024: Prestone Launches EV-Specific Coolant for Battery Thermal Management Prestone introduced a new coolant product specifically formulated for electric vehicle battery thermal management systems, targeting the growing EV market.
    • Q4 2024: TotalEnergies inaugurates new research center for automotive fluids in France TotalEnergies opened a new research and development center in France dedicated to automotive fluids, including coolants, to accelerate innovation for next-generation vehicles.
    • Q4 2024: Old World Industries Expands Distribution Agreement with AutoZone Old World Industries, maker of PEAK coolants, expanded its distribution agreement with AutoZone, increasing the availability of its coolant products across North America.
    • Q1 2025: Shell launches bio-based coolant for commercial vehicle fleets Shell introduced a new bio-based automotive coolant aimed at commercial vehicle fleets, emphasizing reduced environmental impact and compliance with new sustainability standards.
    • Q1 2025: ExxonMobil appoints new Vice President for Global Automotive Fluids ExxonMobil announced the appointment of a new Vice President to lead its global automotive fluids division, including the coolant business, as part of its strategy to strengthen market leadership.
    • Q2 2025: Clariant and Mahle sign agreement to co-develop sustainable engine coolants Clariant and Mahle signed a collaboration agreement to jointly develop sustainable engine coolant solutions for next-generation internal combustion and hybrid vehicles.
    • Q2 2025: BASF to invest €50 million in coolant production expansion in Germany BASF announced a €50 million investment to expand its coolant production facility in Germany, aiming to increase output and support growing demand in Europe.
    • Q3 2025: Valvoline secures supply contract with major European automaker for advanced coolants Valvoline secured a multi-year supply contract with a leading European automaker to provide advanced engine coolants for new vehicle models.
    • Q3 2025: PETRONAS launches new long-life coolant for heavy-duty vehicles PETRONAS introduced a new long-life coolant product designed for heavy-duty commercial vehicles, offering extended service intervals and enhanced engine protection.

    Future Outlook

    Automotive Coolant Market Future Outlook

    The Automotive Coolant Market is projected to grow at a 3.5% CAGR from 2024 to 2035, driven by increasing vehicle production, technological advancements, and environmental regulations.

    New opportunities lie in:

    • Develop eco-friendly coolant formulations to meet regulatory demands.
    • Invest in advanced distribution channels to enhance market reach.
    • Leverage digital marketing strategies to target emerging automotive segments.

    By 2035, the market is expected to exhibit robust growth, reflecting evolving consumer preferences and regulatory landscapes.

    Market Segmentation

    Automotive Coolant Regional Outlook

    North America
    • US
    • Canada

    Automotive Coolant Product Outlook

    • Ethylene Glycol
    • Propylene Glycol
    • Glycerin
    • Others

    Automotive Coolant End User Outlook

    • Original Equipment Manufacturer (OEM)
    • Automotive Aftermarket

    Automotive Coolant Technology Outlook

    • Inorganic Additive Technology (IAT)
    • Organic Additive Technology (OAT)
    • Hybrid Organic Acid Technology (HOAT)

    Automotive Coolant Vehicle Type Outlook

    • Passenger Car
    • Heavy Commercial Vehicles
    • Light Commercial Vehicles
    • Others

    Report Scope

    Attribute/Metric Details
    Market Size 2023 USD 7.59 billion
    Market Size 2024 USD 7.89 billion
    Market Size 2032 USD 10.39 billion
    Compound Annual Growth Rate (CAGR) 3.49% (2024-2032)
    Base Year 2023
    Market Forecast Period 2024-2032
    Historical Data 2018- 2022
    Market Forecast Units Value (USD Billion)
    Report Coverage Revenue Forecast, Market Competitive Landscape, Growth Factors, and Trends
    Segments Covered Product, Vehicle Type, Technology, End User, and Region
    Geographies Covered North America, Europe, Asia Pacific, and the Rest of the World
    Countries Covered The U.S., Canada, German, France, UK, Italy, Spain, China, Japan, India, Australia, South Korea, and Brazil
    Key Companies Profiled Valvoline LLC (US), Exxon Mobil Corporation (US), BASF SE (Germany), Total (France), Chevron Corporation (US), Royal Dutch Shell plc (the Netherlands), OLD WORLD INDUSTRIES LLC (Italy), Prestone Products Corporation (US), Arteco (Belgium), and AMSOIL INC (US)
    Key Market Opportunities The rising demand for ethylene glycol in the automotive industry
    Key Market Dynamics Growing production of vehicles both in emerging and developed economies

    Market Highlights

    Author

    Anshula Mandaokar
    Team Lead - Research

    She holds an experience of about 6+ years in market research and business consulting, working under the spectrum of information communication technology, telecommunications and semiconductor domains. aarti conceptualizes and implements a scalable business strategy and provides strategic leadership to the clients. her expertise lies in market estimation, competitive intelligence, pipeline analysis, customer assessment, etc.

    Leave a Comment

    Latest Comments

    John Doe

    This is a great article! Really helped me understand the topic better.

    Posted on July 23, 2025, 10:15 AM
    Jane Smith

    Thanks for sharing this. I’ve bookmarked it for later reference.

    Posted on July 22, 2025, 7:45 PM

    FAQs

    How much is the automotive coolant market?

    The automotive coolant market size was valued at USD 7.59 Billion in 2023.

    What is the growth rate of the automotive coolant market?

    The market is projected to grow at a CAGR of 3.49% during the forecast period, 2024-2032

    Which region held the largest market share in the automotive coolant market?

    North America had the largest share of the market

    Who are the key players in the automotive coolant market?

    The key players in the market are BASF SE (Germany), Total (France), Chevron Corporation (US), Royal Dutch Shell plc (the Netherlands), OLD WORLD INDUSTRIES LLC (Italy), Prestone Products Corporation (US), Arteco (Belgium), and AMSOIL INC (US)

    Which product led the automotive coolant market?

    The ethylene glycol category dominated the market in 2023

    Which vehicle type had the largest market share in the market?

    The passenger car had the largest share of the market

    Which technology led the automotive coolant market?

    The organic additive technology (OAT) category dominated the market for automotive coolant in 2023

    Which end-user had the largest market share in the automotive coolant industry?

    The automotive aftermarket had the largest share of the market

    1. Executive Summary
      1. MARKET ATTRACTIVENESS ANALYSIS 23
    2. GLOBAL AUTOMOTIVE COOLANT MARKET, BY TECHNOLOGY 24
      1. GLOBAL AUTOMOTIVE
    3. COOLANT MARKET, BY PRODUCT 25
      1. GLOBAL AUTOMOTIVE COOLANT MARKET,
    4. BY VEHICLE TYPE 26
      1. GLOBAL AUTOMOTIVE COOLANT MARKET, BY END USE
    5. 27
      1. GLOBAL AUTOMOTIVE COOLANT MARKET, BY REGION 28
    6. Market Introduction
      1. DEFINITION 29
      2. Scope of the Study 29
    7. MARKET STRUCTURE 29
    8. Research Methodology
      1. RESEARCH PROCESS
    9. 30
      1. PRIMARY RESEARCH 31
      2. SECONDARY RESEARCH 31
    10. MARKET SIZE ESTIMATION 32
      1. FORECAST MODEL 34
      2. LIST OF
    11. ASSUMPTIONS 34
    12. MARKET DYNAMICS
      1. INTRODUCTION 35
    13. DRIVERS 37
      1. INCREASING DEMAND IN THE GLOBAL AUTOMOTIVE AFTERMARKET
    14. 37
      1. GROWING SALE OF COMMERCIAL VEHICLES ACROSS THE GLOBE 38
    15. DRIVERS IMPACT ANALYSIS 40
      1. RESTRAINTS 41
        1. VOLATILE
    16. RAW MATERIAL (CRUDE OIL) PRICES 41
      1. RESTRAINTS IMPACT ANALYSIS 42
    17. OPPORTUNITIES 42
      1. EXPANDING AUTOMOTIVE INDUSTRY IN LATIN AMERICA
    18. AND THE MIDDLE EAST 42
      1. CHALLENGES 43
        1. INCREASING ADOPTION
    19. OF ELECTRIC VEHICLES 43
    20. MARKET FACTOR ANALYSIS
      1. SUPPLY
    21. CHAIN ANALYSIS 45
      1. RAW MATERIALS SUPPLIERS 46
        1. RAW
    22. MATERIAL SUPPLIERS OF ETHYLENE GLYCOL 46
      1. RAW MATERIAL SUPPLIERS
    23. OF PROPYLENE GLYCOL 46
      1. AUTOMOTIVE COOLANT PRODUCERS 46
    24. DISTRIBUTION CHANNELS 46
      1. END USE 47
      2. PORTER’S
    25. FIVE FORCES MODEL 48
      1. THREAT OF NEW ENTRANTS 49
        1. RIVALRY
    26. 49
      1. THREAT OF SUBSTITUTES 49
        1. BARGAINING POWER OF
    27. SUPPLIERS 49
      1. BARGAINING POWER OF BUYERS 50
      2. PRICING
    28. ANALYSIS – BY REGION (USD/GALLON), 2023 50
      1. GLOBAL AUTOMOTIVE
    29. SALES AND PRODUCTION OVERVIEW (2023-2032) 50
      1. REGULATORY CONTEXT 51
    30. STANDARD SPECIFICATION FOR GLYCOL BASE ENGINE COOLANT FOR AUTOMOBILE AND LIGHT-DUTY
    31. SERVICE 51
      1. IMPACT OF COVID-19 53
    32. GLOBAL AUTOMOTIVE COOLANTS
    33. MARKET, BY TECHNOLOGY
      1. OVERVIEW 56
        1. AUTOMOTIVE COOLANTS:
    34. MARKET ESTIMATES & FORECAST BY TECHNOLOGY, 2023-2032 57
      1. AUTOMOTIVE
    35. COOLANTS: MARKET ESTIMATES & FORECAST BY TECHNOLOGY, 2023-2032 58
    36. INORGANIC ADDITIVE TECHNOLOGY (IAT) 59
      1. INORGANIC ADDITIVE TECHNOLOGY
    37. (IAT): MARKET ESTIMATES & FORECAST BY REGION,2023-2032 59
      1. ORGANIC
    38. ADDITIVE TECHNOLOGY (OAT) 60
      1. ORGANIC ADDITIVE TECHNOLOGY (OAT):
    39. MARKET ESTIMATES & FORECAST BY REGION,2023-2032 61
      1. HYBRID ORGANIC
    40. ACID TECHNOLOGY (HOAT) 62
      1. HYBRID ORGANIC ACID TECHNOLOGY (HOAT):
    41. MARKET ESTIMATES & FORECAST BY REGION,2023-2032 62
    42. GLOBAL AUTOMOTIVE
    43. COOLANTS MARKET, BY PRODUCT
      1. OVERVIEW 64
        1. AUTOMOTIVE
    44. COOLANTS: MARKET ESTIMATES & FORECAST BY PRODUCT, 2023-2032 65
    45. AUTOMOTIVE COOLANTS: MARKET ESTIMATES & FORECAST BY PRODUCT, 2023-2032 66
    46. ETHYLENE GLYCOL 67
      1. ETHYLENE GLYCOL: MARKET ESTIMATES & FORECAST
    47. BY REGION, 2023-2032 67
      1. PROPYLENE GLYCOL 68
        1. PROPYLENE
    48. GLYCOL: MARKET ESTIMATES & FORECAST BY REGION, 2023-2032 69
      1. GLYCERIN
    49. 70
      1. GLYCERIN: MARKET ESTIMATES & FORECAST BY REGION, 2023-2032
      2. OTHERS 71
        1. OTHERS: MARKET ESTIMATES & FORECAST
    50. BY REGION, 2023-2032 71
    51. GLOBAL AUTOMOTIVE COOLANTS MARKET, BY VEHICLE
    52. TYPE
      1. OVERVIEW 73
        1. AUTOMOTIVE COOLANTS: MARKET ESTIMATES
    53. & FORECAST BY VEHICLE TYPE, 2023-2032 74
      1. AUTOMOTIVE COOLANTS:
    54. MARKET ESTIMATES & FORECAST BY VEHICLE TYPE, 2023-2032 75
      1. PASSENGER
    55. CARS 76
      1. PASSENGER CARS: MARKET ESTIMATES & FORECAST BY REGION,
    56. 2032 76
      1. PASSENGER CARS: MARKET ESTIMATES & FORECAST BY
    57. REGION, 2023-2032 77
      1. HEAVY COMMERCIAL VEHICLES 77
    58. HEAVY COMMERCIAL VEHICLES: MARKET ESTIMATES & FORECAST BY REGION, 2023-2032
    59. 78
      1. HEAVY COMMERCIAL VEHICLES: MARKET ESTIMATES & FORECAST BY
    60. REGION, 2023-2032 78
      1. LIGHT COMMERCIAL VEHICLES 79
    61. LIGHT COMMERCIAL VEHICLES: MARKET ESTIMATES & FORECAST BY REGION, 2023-2032
    62. 79
      1. LIGHT COMMERCIAL VEHICLES: MARKET ESTIMATES & FORECAST BY
    63. REGION, 2023-2032 80
      1. OTHERS 80
        1. OTHERS: MARKET ESTIMATES
    64. & FORECAST BY REGION, 2023-2032 80
      1. OTHERS: MARKET ESTIMATES
    65. & FORECAST BY REGION, 2023-2032 81
    66. GLOBAL AUTOMOTIVE COOLANTS MARKET,
    67. BY END USER
      1. OVERVIEW 82
        1. AUTOMOTIVE COOLANTS: MARKET
    68. ESTIMATES & FORECAST BY END USER, 2023-2032 83
      1. AUTOMOTIVE COOLANTS:
    69. MARKET ESTIMATES & FORECAST BY END USER, 2023-2032 84
      1. ORIGINAL
    70. EQUIPMENT MANUFACTURER (OEM) 85
      1. ORIGINAL EQUIPMENT MANUFACTURER
    71. (OEM): MARKET ESTIMATES & FORECAST BY REGION, 2023-2032 85
      1. ORIGINAL
    72. EQUIPMENT MANUFACTURER (OEM): MARKET ESTIMATES & FORECAST BY REGION, 2023-2032
    73. 86
      1. AUTOMOTIVE AFTERMARKET 86
        1. AUTOMOTIVE AFTERMARKET:
    74. MARKET ESTIMATES & FORECAST BY REGION, 2023-2032 87
      1. AUTOMOTIVE
    75. AFTERMARKET: MARKET ESTIMATES & FORECAST BY REGION, 2023-2032 87
    76. 10
    77. GLOBAL AUTOMOTIVE COOLANTS MARKET, BY REGION
      1. OVERVIEW 88
    78. NORTH AMERICA 91
      1. US 96
        1. CANADA 100
    79. EUROPE 105
      1. GERMANY 111
        1. UK 115
    80. FRANCE 119
      1. SPAIN 123
        1. ITALY 127
    81. RUSSIA 131
      1. BENELUX 135
        1. POLAND 139
    82. REST OF EUROPE 143
      1. ASIA-PACIFIC 148
        1. CHINA 154
    83. JAPAN 158
      1. INDIA 162
        1. AUSTRALIA AND NEW ZEALAND
    84. 166
      1. INDONESIA 170
        1. SOUTH KOREA 174
    85. THAILAND 178
      1. REST OF ASIA-PACIFIC 182
      2. MIDDLE EAST
    86. & AFRICA 186
      1. GCC 191
        1. TURKEY 195
    87. SOUTH AFRICA 199
      1. REST OF THE MIDDLE EAST & AFRICA 203
    88. LATIN AMERICA 207
      1. BRAZIL 213
        1. MEXICO 217
    89. ARGENTINA 221
      1. REST OF LATIN AMERICA 225
    90. Competitive Landscape
      1. COMPETITIVE OVERVIEW 229
      2. GLOBAL MARKET STRATEGY
    91. ANALYSIS 229
      1. KEY DEVELOPMENTS 230
      2. COMPETITIVE BENCHMARKING
    92. 232
    93. COMPANY PROFILES
      1. VALVOLINE INC. 233
    94. COMPANY OVERVIEW 233
      1. FINANCIAL OVERVIEW 234
        1. PRODUCTS
    95. OFFERED 235
      1. KEY DEVELOPMENTS 235
        1. SWOT ANALYSIS
    96. 236
      1. KEY STRATEGIES 236
      2. EXXONMOBIL CORPORATION 237
    97. COMPANY OVERVIEW 237
      1. FINANCIAL OVERVIEW 237
        1. PRODUCTS
    98. OFFERED 238
      1. KEY DEVELOPMENTS 238
        1. SWOT ANALYSIS
    99. 238
      1. KEY STRATEGIES 239
      2. BASF SE 240
    100. COMPANY OVERVIEW 240
      1. FINANCIAL OVERVIEW 241
        1. PRODUCTS
    101. OFFERED 242
      1. KEY DEVELOPMENTS 242
        1. SWOT ANALYSIS
    102. 243
      1. KEY STRATEGIES 243
      2. TOTAL 244
    103. COMPANY OVERVIEW 244
      1. FINANCIAL OVERVIEW 245
        1. PRODUCTS
    104. OFFERED 246
      1. KEY DEVELOPMENTS 246
        1. SWOT ANALYSIS
    105. 247
      1. KEY STRATEGIES 247
      2. CHEVRON CORPORATION 248
    106. COMPANY OVERVIEW 248
      1. FINANCIAL OVERVIEW 249
        1. PRODUCTS
    107. OFFERED 250
      1. KEY DEVELOPMENTS 250
        1. SWOT ANALYSIS
    108. 251
      1. KEY STRATEGIES 251
      2. ROYAL DUTCH SHELL PLC 252
    109. COMPANY OVERVIEW 252
      1. FINANCIAL OVERVIEW 253
        1. PRODUCTS
    110. OFFERED 254
      1. KEY DEVELOPMENTS 254
        1. SWOT ANALYSIS
    111. 255
      1. KEY STRATEGIES 255
      2. OLD WORLD INDUSTRIES, LLC
    112. 256
      1. COMPANY OVERVIEW 256
        1. FINANCIAL OVERVIEW 256
    113. PRODUCTS OFFERED 256
      1. KEY DEVELOPMENTS 257
        1. SWOT
    114. ANALYSIS 258
      1. KEY STRATEGIES 258
      2. PRESTONE PRODUCTS
    115. CORPORATION 259
      1. COMPANY OVERVIEW 259
        1. FINANCIAL
    116. OVERVIEW 259
      1. PRODUCTS OFFERED 259
        1. KEY DEVELOPMENTS
    117. 260
      1. SWOT ANALYSIS 260
        1. KEY STRATEGIES 261
    118. ARTECO 262
      1. COMPANY OVERVIEW 262
        1. FINANCIAL OVERVIEW
    119. 262
      1. PRODUCTS OFFERED 263
        1. KEY DEVELOPMENTS 263
    120. SWOT ANALYSIS 264
      1. KEY STRATEGIES 264
      2. RECOCHEM CORPORATION
    121. 265
      1. COMPANY OVERVIEW 265
        1. FINANCIAL OVERVIEW
        2. PRODUCTS OFFERED 266
        3. KEY DEVELOPMENTS 267
    122. SWOT ANALYSIS 268
      1. KEY STRATEGIES 268
      2. AMSOIL INC.
    123. 269
      1. COMPANY OVERVIEW 269
        1. FINANCIAL OVERVIEW
        2. PRODUCTS OFFERED 269
        3. KEY DEVELOPMENTS 269
    124. SWOT ANALYSIS 270
      1. KEY STRATEGIES 270
      2. MOTUL 271
    125. COMPANY OVERVIEW 271
      1. FINANCIAL OVERVIEW 271
    126. PRODUCTS OFFERED 271
      1. KEY DEVELOPMENTS 272
        1. SWOT
    127. ANALYSIS 272
      1. KEY STRATEGIES 272
    128. APPENDIX
    129. REFERENCES 273
      1. RELATED REPORTS 274
    130. LIST OF TABLES
    131. TABLE
    132. LIST OF ASSUMPTIONS 34
    133. TABLE 2 NUMBER OF UNITS SOLD, 2023-2032 50
    134. NUMBER OF UNITS PRODUCED, 2023-2032 50
    135. TABLE 4 PHYSICAL AND CHEMICAL
    136. REQUIREMENTS FOR CONCENTRATES 52
    137. TABLE 5 PHYSICAL AND CHEMICAL REQUIREMENTS
    138. FOR PREDILUTE 52
    139. TABLE 6 AUTOMOTIVE COOLANTS MARKET ESTIMATES & FORECAST,
    140. BY TECHNOLOGY, 2023-2032 (USD MILLION) 57
    141. TABLE 7 AUTOMOTIVE COOLANTS
    142. MARKET ESTIMATES & FORECAST, BY TECHNOLOGY, 2023-2032 (MILLION GALLONS) 58
    143. INORGANIC ADDITIVE TECHNOLOGY (IAT) MARKET ESTIMATES & FORECAST, BY REGION,
    144. 2032 (USD MILLION) 59
    145. TABLE 9 INORGANIC ADDITIVE TECHNOLOGY (IAT)
    146. MARKET ESTIMATES & FORECAST, BY REGION, 2023-2032 (MILLION GALLONS) 60
    147. ORGANIC ADDITIVE TECHNOLOGY (OAT) MARKET ESTIMATES & FORECAST, BY REGION,
    148. 2032 (USD MILLION) 61
    149. TABLE 11 ORGANIC ADDITIVE TECHNOLOGY (OAT)
    150. MARKET ESTIMATES & FORECAST, BY REGION, 2023-2032 (MILLION GALLONS) 61
    151. HYBRID ORGANIC ACID TECHNOLOGY (HOAT) MARKET ESTIMATES & FORECAST, BY REGION,
    152. 2032 (USD MILLION) 62
    153. TABLE 13 HYBRID ORGANIC ACID TECHNOLOGY (HOAT)
    154. MARKET ESTIMATES & FORECAST, BY REGION, 2023-2032 (MILLION GALLONS) 63
    155. AUTOMOTIVE COOLANTS MARKET ESTIMATES & FORECAST, BY PRODUCT, 2023-2032 (USD
    156. MILLION) 65
    157. TABLE 15 AUTOMOTIVE COOLANTS MARKET ESTIMATES & FORECAST,
    158. BY PRODUCT, 2023-2032 (MILLION GALLONS) 66
    159. TABLE 16 ETHYLENE GLYCOL MARKET
    160. ESTIMATES & FORECAST, BY REGION, 2023-2032 (USD MILLION) 67
    161. ETHYLENE GLYCOL MARKET ESTIMATES & FORECAST, BY REGION, 2023-2032 (MILLION
    162. GALLONS) 68
    163. TABLE 18 PROPYLENE GLYCOL MARKET ESTIMATES & FORECAST,
    164. BY REGION, 2023-2032 (USD MILLION) 69
    165. TABLE 19 PROPYLENE GLYCOL MARKET
    166. ESTIMATES & FORECAST, BY REGION, 2023-2032 (MILLION GALLONS) 69
    167. GLYCERIN MARKET ESTIMATES & FORECAST, BY REGION, 2023-2032 (USD MILLION)
    168. TABLE 21 GLYCERIN MARKET ESTIMATES & FORECAST, BY REGION, 2023-2032
    169. (MILLION GALLONS) 71
    170. TABLE 22 OTHERS MARKET ESTIMATES & FORECAST,
    171. BY REGION, 2023-2032 (USD MILLION) 71
    172. TABLE 23 OTHERS MARKET ESTIMATES
    173. & FORECAST, BY REGION, 2023-2032 (MILLION GALLONS) 72
    174. TABLE 24 AUTOMOTIVE
    175. COOLANTS MARKET ESTIMATES & FORECAST, BY VEHICLE TYPE, 2023-2032 (USD MILLION)
    176. 74
    177. TABLE 25 AUTOMOTIVE COOLANTS MARKET ESTIMATES & FORECAST, BY VEHICLE
    178. TYPE, 2023-2032 (MILLION GALLONS) 75
    179. TABLE 26 PASSENGER CARS MARKET ESTIMATES
    180. & FORECAST, BY REGION, 2023-2032 (USD MILLION) 76
    181. TABLE 27 PASSENGER
    182. CARS MARKET ESTIMATES & FORECAST, BY REGION, 2023-2032 (MILLION GALLONS) 77
    183. HEAVY COMMERCIAL VEHICLES MARKET ESTIMATES & FORECAST, BY REGION, 2023-2032
    184. (USD MILLION) 78
    185. TABLE 29 HEAVY COMMERCIAL VEHICLES MARKET ESTIMATES &
    186. FORECAST, BY REGION, 2023-2032 (MILLION GALLONS) 78
    187. TABLE 30 LIGHT COMMERCIAL
    188. VEHICLES MARKET ESTIMATES & FORECAST, BY REGION, 2023-2032 (USD MILLION) 79
    189. LIGHT COMMERCIAL VEHICLES MARKET ESTIMATES & FORECAST, BY REGION, 2023-2032
    190. (MILLION GALLONS) 80
    191. TABLE 32 OTHERS MARKET ESTIMATES & FORECAST,
    192. BY REGION, 2023-2032 (USD MILLION) 80
    193. TABLE 33 OTHERS MARKET ESTIMATES
    194. & FORECAST, BY REGION, 2023-2032 (MILLION GALLONS) 81
    195. TABLE 34 AUTOMOTIVE
    196. COOLANTS MARKET ESTIMATES & FORECAST, BY END USER, 2023-2032 (USD MILLION) 83
    197. AUTOMOTIVE COOLANTS MARKET ESTIMATES & FORECAST, BY END USER, 2023-2032 (MILLION
    198. GALLONS) 84
    199. TABLE 36 ORIGINAL EQUIPMENT MANUFACTURER (OEM) MARKET ESTIMATES
    200. & FORECAST, BY REGION, 2023-2032 (USD MILLION) 85
    201. TABLE 37 ORIGINAL
    202. EQUIPMENT MANUFACTURER (OEM) MARKET ESTIMATES & FORECAST, BY REGION, 2023-2032
    203. (MILLION GALLONS) 86
    204. TABLE 38 AUTOMOTIVE AFTERMARKET MARKET ESTIMATES
    205. & FORECAST, BY REGION, 2023-2032 (USD MILLION) 87
    206. TABLE 39 AUTOMOTIVE
    207. AFTERMARKET MARKET ESTIMATES & FORECAST, BY REGION, 2023-2032 (MILLION GALLONS)
    208. 87
    209. TABLE 40 GLOBAL AUTOMOTIVE COOLANTS MARKET, BY REGION, 2023-2032 (USD
    210. MILLION) 89
    211. TABLE 41 GLOBAL AUTOMOTIVE COOLANTS MARKET, BY REGION, 2023-2032
    212. (MILLION GALLONS) 90
    213. TABLE 42 NORTH AMERICA: AUTOMOTIVE COOLANTS MARKET,
    214. BY COUNTRY, 2023-2032 (USD MILLION) 91
    215. TABLE 43 NORTH AMERICA: AUTOMOTIVE
    216. COOLANTS MARKET, BY COUNTRY, 2023-2032 (MILLION GALLONS) 92
    217. TABLE 44 NORTH
    218. AMERICA: AUTOMOTIVE COOLANTS MARKET, BY TECHNOLOGY, 2023-2032 (USD MILLION) 92
    219. NORTH AMERICA: AUTOMOTIVE COOLANTS MARKET, BY TECHNOLOGY, 2023-2032 (MILLION
    220. GALLONS) 93
    221. TABLE 46 NORTH AMERICA: AUTOMOTIVE COOLANTS MARKET, BY PRODUCT,
    222. 2032 (USD MILLION) 93
    223. TABLE 47 NORTH AMERICA: AUTOMOTIVE COOLANTS
    224. MARKET, BY PRODUCT, 2023-2032 (MILLION GALLONS) 94
    225. TABLE 48 NORTH AMERICA:
    226. AUTOMOTIVE COOLANTS MARKET, BY VEHICLE TYPE, 2023-2032 (USD MILLION) 94
    227. NORTH AMERICA: AUTOMOTIVE COOLANTS MARKET, BY VEHICLE TYPE, 2023-2032 (MILLION
    228. GALLONS) 95
    229. TABLE 50 NORTH AMERICA: AUTOMOTIVE COOLANTS MARKET, BY END
    230. USER, 2023-2032 (USD MILLION) 95
    231. TABLE 51 NORTH AMERICA: AUTOMOTIVE COOLANTS
    232. MARKET, BY END USER, 2023-2032 (MILLION GALLONS) 96
    233. TABLE 52 US: AUTOMOTIVE
    234. COOLANTS MARKET, BY TECHNOLOGY, 2023-2032 (USD MILLION) 96
    235. TABLE 53 US:
    236. AUTOMOTIVE COOLANTS MARKET, BY TECHNOLOGY, 2023-2032 (MILLION GALLONS) 97
    237. US: AUTOMOTIVE COOLANTS MARKET, BY PRODUCT, 2023-2032 (USD MILLION) 97
    238. US: AUTOMOTIVE COOLANTS MARKET, BY PRODUCT, 2023-2032 (MILLION GALLONS) 98
    239. US: AUTOMOTIVE COOLANTS MARKET, BY VEHICLE TYPE, 2023-2032 (USD MILLION) 98
    240. US: AUTOMOTIVE COOLANTS MARKET, BY VEHICLE TYPE, 2023-2032 (MILLION GALLONS)
    241. 99
    242. TABLE 58 US: AUTOMOTIVE COOLANTS MARKET, BY END USER, 2023-2032 (USD
    243. MILLION) 99
    244. TABLE 59 US: AUTOMOTIVE COOLANTS MARKET, BY END USER, 2023-2032
    245. (MILLION GALLONS) 100
    246. TABLE 60 CANADA: AUTOMOTIVE COOLANTS MARKET, BY
    247. TECHNOLOGY, 2023-2032 (USD MILLION) 100
    248. TABLE 61 CANADA: AUTOMOTIVE COOLANTS
    249. MARKET, BY TECHNOLOGY, 2023-2032 (MILLION GALLONS) 101
    250. TABLE 62 CANADA:
    251. AUTOMOTIVE COOLANTS MARKET, BY PRODUCT, 2023-2032 (USD MILLION) 101
    252. CANADA: AUTOMOTIVE COOLANTS MARKET, BY PRODUCT, 2023-2032 (MILLION GALLONS) 102
    253. CANADA: AUTOMOTIVE COOLANTS MARKET, BY VEHICLE TYPE, 2023-2032 (USD MILLION)
    254. 102
    255. TABLE 65 CANADA: AUTOMOTIVE COOLANTS MARKET, BY VEHICLE TYPE, 2023-2032
    256. (MILLION GALLONS) 103
    257. TABLE 66 CANADA: AUTOMOTIVE COOLANTS MARKET, BY
    258. END USER, 2023-2032 (USD MILLION) 103
    259. TABLE 67 CANADA: AUTOMOTIVE COOLANTS
    260. MARKET, BY END USER, 2023-2032 (MILLION GALLONS) 104
    261. TABLE 68 EUROPE:
    262. AUTOMOTIVE COOLANTS MARKET, BY COUNTRY, 2023-2032 (USD MILLION) 106
    263. EUROPE: AUTOMOTIVE COOLANTS MARKET, BY COUNTRY, 2023-2032 (MILLION GALLONS) 107
    264. EUROPE: AUTOMOTIVE COOLANTS MARKET, BY TECHNOLOGY, 2023-2032 (USD MILLION) 107
    265. EUROPE: AUTOMOTIVE COOLANTS MARKET, BY TECHNOLOGY, 2023-2032 (MILLION GALLONS)
    266. 108
    267. TABLE 72 EUROPE: AUTOMOTIVE COOLANTS MARKET, BY PRODUCT, 2023-2032
    268. (USD MILLION) 108
    269. TABLE 73 EUROPE: AUTOMOTIVE COOLANTS MARKET, BY PRODUCT,
    270. 2032 (MILLION GALLONS) 109
    271. TABLE 74 EUROPE: AUTOMOTIVE COOLANTS MARKET,
    272. BY VEHICLE TYPE, 2023-2032 (USD MILLION) 109
    273. TABLE 75 EUROPE: AUTOMOTIVE
    274. COOLANTS MARKET, BY VEHICLE TYPE, 2023-2032 (MILLION GALLONS) 110
    275. EUROPE: AUTOMOTIVE COOLANTS MARKET, BY END USER, 2023-2032 (USD MILLION) 110
    276. EUROPE: AUTOMOTIVE COOLANTS MARKET, BY END USER, 2023-2032 (MILLION GALLONS)
    277. 111
    278. TABLE 78 GERMANY: AUTOMOTIVE COOLANTS MARKET, BY TECHNOLOGY, 2023-2032
    279. (USD MILLION) 111
    280. TABLE 79 GERMANY: AUTOMOTIVE COOLANTS MARKET, BY TECHNOLOGY,
    281. 2032 (MILLION GALLONS) 112
    282. TABLE 80 GERMANY: AUTOMOTIVE COOLANTS
    283. MARKET, BY PRODUCT, 2023-2032 (USD MILLION) 112
    284. TABLE 81 GERMANY: AUTOMOTIVE
    285. COOLANTS MARKET, BY PRODUCT, 2023-2032 (MILLION GALLONS) 113
    286. TABLE 82
    287. GERMANY: AUTOMOTIVE COOLANTS MARKET, BY VEHICLE TYPE, 2023-2032 (USD MILLION) 113
    288. GERMANY: AUTOMOTIVE COOLANTS MARKET, BY VEHICLE TYPE, 2023-2032 (MILLION GALLONS)
    289. 114
    290. TABLE 84 GERMANY: AUTOMOTIVE COOLANTS MARKET, BY END USER, 2023-2032
    291. (USD MILLION) 114
    292. TABLE 85 GERMANY: AUTOMOTIVE COOLANTS MARKET, BY END
    293. USER, 2023-2032 (MILLION GALLONS) 115
    294. TABLE 86 UK: AUTOMOTIVE COOLANTS
    295. MARKET, BY TECHNOLOGY, 2023-2032 (USD MILLION) 115
    296. TABLE 87 UK: AUTOMOTIVE
    297. COOLANTS MARKET, BY TECHNOLOGY, 2023-2032 (MILLION GALLONS) 116
    298. UK: AUTOMOTIVE COOLANTS MARKET, BY PRODUCT, 2023-2032 (USD MILLION) 116
    299. UK: AUTOMOTIVE COOLANTS MARKET, BY PRODUCT, 2023-2032 (MILLION GALLONS) 117
    300. UK: AUTOMOTIVE COOLANTS MARKET, BY VEHICLE TYPE, 2023-2032 (USD MILLION) 117
    301. UK: AUTOMOTIVE COOLANTS MARKET, BY VEHICLE TYPE, 2023-2032 (MILLION GALLONS)
    302. 118
    303. TABLE 92 UK: AUTOMOTIVE COOLANTS MARKET, BY END USER, 2023-2032 (USD
    304. MILLION) 118
    305. TABLE 93 UK: AUTOMOTIVE COOLANTS MARKET, BY END USER, 2023-2032
    306. (MILLION GALLONS) 119
    307. TABLE 94 FRANCE: AUTOMOTIVE COOLANTS MARKET, BY
    308. TECHNOLOGY, 2023-2032 (USD MILLION) 119
    309. TABLE 95 FRANCE: AUTOMOTIVE COOLANTS
    310. MARKET, BY TECHNOLOGY, 2023-2032 (MILLION GALLONS) 120
    311. TABLE 96 FRANCE:
    312. AUTOMOTIVE COOLANTS MARKET, BY PRODUCT, 2023-2032 (USD MILLION) 120
    313. FRANCE: AUTOMOTIVE COOLANTS MARKET, BY PRODUCT, 2023-2032 (MILLION GALLONS) 121
    314. FRANCE: AUTOMOTIVE COOLANTS MARKET, BY VEHICLE TYPE, 2023-2032 (USD MILLION)
    315. 121
    316. TABLE 99 FRANCE: AUTOMOTIVE COOLANTS MARKET, BY VEHICLE TYPE, 2023-2032
    317. (MILLION GALLONS) 122
    318. TABLE 100 FRANCE: AUTOMOTIVE COOLANTS MARKET, BY
    319. END USER, 2023-2032 (USD MILLION) 122
    320. TABLE 101 FRANCE: AUTOMOTIVE COOLANTS
    321. MARKET, BY END USER, 2023-2032 (MILLION GALLONS) 123
    322. TABLE 102 SPAIN:
    323. AUTOMOTIVE COOLANTS MARKET, BY TECHNOLOGY, 2023-2032 (USD MILLION) 123
    324. SPAIN: AUTOMOTIVE COOLANTS MARKET, BY TECHNOLOGY, 2023-2032 (MILLION GALLONS)
    325. 124
    326. TABLE 104 SPAIN: AUTOMOTIVE COOLANTS MARKET, BY PRODUCT, 2023-2032
    327. (USD MILLION) 124
    328. TABLE 105 SPAIN: AUTOMOTIVE COOLANTS MARKET, BY PRODUCT,
    329. 2032 (MILLION GALLONS) 125
    330. TABLE 106 SPAIN: AUTOMOTIVE COOLANTS MARKET,
    331. BY VEHICLE TYPE, 2023-2032 (USD MILLION) 125
    332. TABLE 107 SPAIN: AUTOMOTIVE
    333. COOLANTS MARKET, BY VEHICLE TYPE, 2023-2032 (MILLION GALLONS) 126
    334. SPAIN: AUTOMOTIVE COOLANTS MARKET, BY END USER, 2023-2032 (USD MILLION) 126
    335. SPAIN: AUTOMOTIVE COOLANTS MARKET, BY END USER, 2023-2032 (MILLION GALLONS)
    336. 127
    337. TABLE 110 ITALY: AUTOMOTIVE COOLANTS MARKET, BY TECHNOLOGY, 2023-2032
    338. (USD MILLION) 127
    339. TABLE 111 ITALY: AUTOMOTIVE COOLANTS MARKET, BY TECHNOLOGY,
    340. 2032 (MILLION GALLONS) 128
    341. TABLE 112 ITALY: AUTOMOTIVE COOLANTS MARKET,
    342. BY PRODUCT, 2023-2032 (USD MILLION) 128
    343. TABLE 113 ITALY: AUTOMOTIVE COOLANTS
    344. MARKET, BY PRODUCT, 2023-2032 (MILLION GALLONS) 129
    345. TABLE 114 ITALY: AUTOMOTIVE
    346. COOLANTS MARKET, BY VEHICLE TYPE, 2023-2032 (USD MILLION) 129
    347. TABLE 115
    348. ITALY: AUTOMOTIVE COOLANTS MARKET, BY VEHICLE TYPE, 2023-2032 (MILLION GALLONS)
    349. 130
    350. TABLE 116 ITALY: AUTOMOTIVE COOLANTS MARKET, BY END USER, 2023-2032
    351. (USD MILLION) 130
    352. TABLE 117 ITALY: AUTOMOTIVE COOLANTS MARKET, BY END
    353. USER, 2023-2032 (MILLION GALLONS) 131
    354. TABLE 118 RUSSIA: AUTOMOTIVE COOLANTS
    355. MARKET, BY TECHNOLOGY, 2023-2032 (USD MILLION) 131
    356. TABLE 119 RUSSIA: AUTOMOTIVE
    357. COOLANTS MARKET, BY TECHNOLOGY, 2023-2032 (MILLION GALLONS) 132
    358. RUSSIA: AUTOMOTIVE COOLANTS MARKET, BY PRODUCT, 2023-2032 (USD MILLION) 132
    359. RUSSIA: AUTOMOTIVE COOLANTS MARKET, BY PRODUCT, 2023-2032 (MILLION GALLONS)
    360. 133
    361. TABLE 122 RUSSIA: AUTOMOTIVE COOLANTS MARKET, BY VEHICLE TYPE, 2023-2032
    362. (USD MILLION) 133
    363. TABLE 123 RUSSIA: AUTOMOTIVE COOLANTS MARKET, BY VEHICLE
    364. TYPE, 2023-2032 (MILLION GALLONS) 134
    365. TABLE 124 RUSSIA: AUTOMOTIVE COOLANTS
    366. MARKET, BY END USER, 2023-2032 (USD MILLION) 134
    367. TABLE 125 RUSSIA: AUTOMOTIVE
    368. COOLANTS MARKET, BY END USER, 2023-2032 (MILLION GALLONS) 135
    369. TABLE 126
    370. BENELUX: AUTOMOTIVE COOLANTS MARKET, BY TECHNOLOGY, 2023-2032 (USD MILLION) 135
    371. BENELUX: AUTOMOTIVE COOLANTS MARKET, BY TECHNOLOGY, 2023-2032 (MILLION GALLONS)
    372. 136
    373. TABLE 128 BENELUX: AUTOMOTIVE COOLANTS MARKET, BY PRODUCT, 2023-2032
    374. (USD MILLION) 136
    375. TABLE 129 BENELUX: AUTOMOTIVE COOLANTS MARKET, BY PRODUCT,
    376. 2032 (MILLION GALLONS) 137
    377. TABLE 130 BENELUX: AUTOMOTIVE COOLANTS
    378. MARKET, BY VEHICLE TYPE, 2023-2032 (USD MILLION) 137
    379. TABLE 131 BENELUX:
    380. AUTOMOTIVE COOLANTS MARKET, BY VEHICLE TYPE, 2023-2032 (MILLION GALLONS) 138
    381. BENELUX: AUTOMOTIVE COOLANTS MARKET, BY END USER, 2023-2032 (USD MILLION) 138
    382. BENELUX: AUTOMOTIVE COOLANTS MARKET, BY END USER, 2023-2032 (MILLION GALLONS)
    383. 139
    384. TABLE 134 POLAND: AUTOMOTIVE COOLANTS MARKET, BY TECHNOLOGY, 2023-2032
    385. (USD MILLION) 139
    386. TABLE 135 POLAND: AUTOMOTIVE COOLANTS MARKET, BY TECHNOLOGY,
    387. 2032 (MILLION GALLONS) 140
    388. TABLE 136 POLAND: AUTOMOTIVE COOLANTS
    389. MARKET, BY PRODUCT, 2023-2032 (USD MILLION) 140
    390. TABLE 137 POLAND: AUTOMOTIVE
    391. COOLANTS MARKET, BY PRODUCT, 2023-2032 (MILLION GALLONS) 141
    392. TABLE 138
    393. POLAND: AUTOMOTIVE COOLANTS MARKET, BY VEHICLE TYPE, 2023-2032 (USD MILLION) 141
    394. POLAND: AUTOMOTIVE COOLANTS MARKET, BY VEHICLE TYPE, 2023-2032 (MILLION GALLONS)
    395. 142
    396. TABLE 140 POLAND: AUTOMOTIVE COOLANTS MARKET, BY END USER, 2023-2032
    397. (USD MILLION) 142
    398. TABLE 141 POLAND: AUTOMOTIVE COOLANTS MARKET, BY END
    399. USER, 2023-2032 (MILLION GALLONS) 143
    400. TABLE 142 REST OF EUROPE: AUTOMOTIVE
    401. COOLANTS MARKET, BY TECHNOLOGY, 2023-2032 (USD MILLION) 143
    402. TABLE 143
    403. REST OF EUROPE: AUTOMOTIVE COOLANTS MARKET, BY TECHNOLOGY, 2023-2032 (MILLION GALLONS)
    404. 144
    405. TABLE 144 REST OF EUROPE: AUTOMOTIVE COOLANTS MARKET, BY PRODUCT,
    406. 2032 (USD MILLION) 144
    407. TABLE 145 REST OF EUROPE: AUTOMOTIVE COOLANTS
    408. MARKET, BY PRODUCT, 2023-2032 (MILLION GALLONS) 145
    409. TABLE 146 REST OF
    410. EUROPE: AUTOMOTIVE COOLANTS MARKET, BY VEHICLE TYPE, 2023-2032 (USD MILLION) 145
    411. REST OF EUROPE: AUTOMOTIVE COOLANTS MARKET, BY VEHICLE TYPE, 2023-2032 (MILLION
    412. GALLONS) 146
    413. TABLE 148 REST OF EUROPE: AUTOMOTIVE COOLANTS MARKET, BY
    414. END USER, 2023-2032 (USD MILLION) 146
    415. TABLE 149 REST OF EUROPE: AUTOMOTIVE
    416. COOLANTS MARKET, BY END USER, 2023-2032 (MILLION GALLONS) 147
    417. TABLE 150
    418. ASIA-PACIFIC: AUTOMOTIVE COOLANTS MARKET, BY COUNTRY, 2023-2032 (USD MILLION) 149
    419. ASIA-PACIFIC: AUTOMOTIVE COOLANTS MARKET, BY COUNTRY, 2023-2032 (MILLION GALLONS)
    420. 149
    421. TABLE 152 ASIA-PACIFIC: AUTOMOTIVE COOLANTS MARKET, BY TECHNOLOGY,
    422. 2032 (USD MILLION) 150
    423. TABLE 153 ASIA-PACIFIC: AUTOMOTIVE COOLANTS
    424. MARKET, BY TECHNOLOGY, 2023-2032 (MILLION GALLONS) 150
    425. TABLE 154 ASIA-PACIFIC:
    426. AUTOMOTIVE COOLANTS MARKET, BY PRODUCT, 2023-2032 (USD MILLION) 151
    427. ASIA-PACIFIC: AUTOMOTIVE COOLANTS MARKET, BY PRODUCT, 2023-2032 (MILLION GALLONS)
    428. 151
    429. TABLE 156 ASIA-PACIFIC: AUTOMOTIVE COOLANTS MARKET, BY VEHICLE TYPE,
    430. 2032 (USD MILLION) 152
    431. TABLE 157 ASIA-PACIFIC: AUTOMOTIVE COOLANTS
    432. MARKET, BY VEHICLE TYPE, 2023-2032 (MILLION GALLONS) 152
    433. TABLE 158 ASIA-PACIFIC:
    434. AUTOMOTIVE COOLANTS MARKET, BY END USER, 2023-2032 (USD MILLION) 153
    435. ASIA-PACIFIC: AUTOMOTIVE COOLANTS MARKET, BY END USER, 2023-2032 (MILLION GALLONS)
    436. 153
    437. TABLE 160 CHINA: AUTOMOTIVE COOLANTS MARKET, BY TECHNOLOGY, 2023-2032
    438. (USD MILLION) 154
    439. TABLE 161 CHINA: AUTOMOTIVE COOLANTS MARKET, BY TECHNOLOGY,
    440. 2032 (MILLION GALLONS) 154
    441. TABLE 162 CHINA: AUTOMOTIVE COOLANTS MARKET,
    442. BY PRODUCT, 2023-2032 (USD MILLION) 155
    443. TABLE 163 CHINA: AUTOMOTIVE COOLANTS
    444. MARKET, BY PRODUCT, 2023-2032 (MILLION GALLONS) 155
    445. TABLE 164 CHINA: AUTOMOTIVE
    446. COOLANTS MARKET, BY VEHICLE TYPE, 2023-2032 (USD MILLION) 156
    447. TABLE 165
    448. CHINA: AUTOMOTIVE COOLANTS MARKET, BY VEHICLE TYPE, 2023-2032 (MILLION GALLONS)
    449. 156
    450. TABLE 166 CHINA: AUTOMOTIVE COOLANTS MARKET, BY END USER, 2023-2032
    451. (USD MILLION) 157
    452. TABLE 167 CHINA: AUTOMOTIVE COOLANTS MARKET, BY END
    453. USER, 2023-2032 (MILLION GALLONS) 157
    454. TABLE 168 JAPAN: AUTOMOTIVE COOLANTS
    455. MARKET, BY TECHNOLOGY, 2023-2032 (USD MILLION) 158
    456. TABLE 169 JAPAN: AUTOMOTIVE
    457. COOLANTS MARKET, BY TECHNOLOGY, 2023-2032 (MILLION GALLONS) 158
    458. JAPAN: AUTOMOTIVE COOLANTS MARKET, BY PRODUCT, 2023-2032 (USD MILLION) 159
    459. JAPAN: AUTOMOTIVE COOLANTS MARKET, BY PRODUCT, 2023-2032 (MILLION GALLONS) 159
    460. JAPAN: AUTOMOTIVE COOLANTS MARKET, BY VEHICLE TYPE, 2023-2032 (USD MILLION)
    461. 160
    462. TABLE 173 JAPAN: AUTOMOTIVE COOLANTS MARKET, BY VEHICLE TYPE, 2023-2032
    463. (MILLION GALLONS) 160
    464. TABLE 174 JAPAN: AUTOMOTIVE COOLANTS MARKET, BY
    465. END USER, 2023-2032 (USD MILLION) 161
    466. TABLE 175 JAPAN: AUTOMOTIVE COOLANTS
    467. MARKET, BY END USER, 2023-2032 (MILLION GALLONS) 161
    468. TABLE 176 INDIA:
    469. AUTOMOTIVE COOLANTS MARKET, BY TECHNOLOGY, 2023-2032 (USD MILLION) 162
    470. INDIA: AUTOMOTIVE COOLANTS MARKET, BY TECHNOLOGY, 2023-2032 (MILLION GALLONS)
    471. 162
    472. TABLE 178 INDIA: AUTOMOTIVE COOLANTS MARKET, BY PRODUCT, 2023-2032
    473. (USD MILLION) 163
    474. TABLE 179 INDIA: AUTOMOTIVE COOLANTS MARKET, BY PRODUCT,
    475. 2032 (MILLION GALLONS) 163
    476. TABLE 180 INDIA: AUTOMOTIVE COOLANTS MARKET,
    477. BY VEHICLE TYPE, 2023-2032 (USD MILLION) 164
    478. TABLE 181 INDIA: AUTOMOTIVE
    479. COOLANTS MARKET, BY VEHICLE TYPE, 2023-2032 (MILLION GALLONS) 164
    480. INDIA: AUTOMOTIVE COOLANTS MARKET, BY END USER, 2023-2032 (USD MILLION) 165
    481. INDIA: AUTOMOTIVE COOLANTS MARKET, BY END USER, 2023-2032 (MILLION GALLONS)
    482. 165
    483. TABLE 184 AUSTRALIA AND NEW ZEALAND: AUTOMOTIVE COOLANTS MARKET, BY
    484. TECHNOLOGY, 2023-2032 (USD MILLION) 166
    485. TABLE 185 AUSTRALIA AND NEW ZEALAND:
    486. AUTOMOTIVE COOLANTS MARKET, BY TECHNOLOGY, 2023-2032 (MILLION GALLONS) 166
    487. AUSTRALIA AND NEW ZEALAND: AUTOMOTIVE COOLANTS MARKET, BY PRODUCT, 2023-2032
    488. (USD MILLION) 167
    489. TABLE 187 AUSTRALIA AND NEW ZEALAND: AUTOMOTIVE COOLANTS
    490. MARKET, BY PRODUCT, 2023-2032 (MILLION GALLONS) 167
    491. TABLE 188 AUSTRALIA
    492. AND NEW ZEALAND: AUTOMOTIVE COOLANTS MARKET, BY VEHICLE TYPE, 2023-2032 (USD MILLION)
    493. 168
    494. TABLE 189 AUSTRALIA AND NEW ZEALAND: AUTOMOTIVE COOLANTS MARKET, BY
    495. VEHICLE TYPE, 2023-2032 (MILLION GALLONS) 168
    496. TABLE 190 AUSTRALIA AND
    497. NEW ZEALAND: AUTOMOTIVE COOLANTS MARKET, BY END USER, 2023-2032 (USD MILLION) 169
    498. AUSTRALIA AND NEW ZEALAND: AUTOMOTIVE COOLANTS MARKET, BY END USER, 2023-2032
    499. (MILLION GALLONS) 169
    500. TABLE 192 INDONESIA: AUTOMOTIVE COOLANTS MARKET,
    501. BY TECHNOLOGY, 2023-2032 (USD MILLION) 170
    502. TABLE 193 INDONESIA: AUTOMOTIVE
    503. COOLANTS MARKET, BY TECHNOLOGY, 2023-2032 (MILLION GALLONS) 170
    504. INDONESIA: AUTOMOTIVE COOLANTS MARKET, BY PRODUCT, 2023-2032 (USD MILLION) 171
    505. INDONESIA: AUTOMOTIVE COOLANTS MARKET, BY PRODUCT, 2023-2032 (MILLION GALLONS)
    506. 171
    507. TABLE 196 INDONESIA: AUTOMOTIVE COOLANTS MARKET, BY VEHICLE TYPE,
    508. 2032 (USD MILLION) 172
    509. TABLE 197 INDONESIA: AUTOMOTIVE COOLANTS MARKET,
    510. BY VEHICLE TYPE, 2023-2032 (MILLION GALLONS) 172
    511. TABLE 198 INDONESIA:
    512. AUTOMOTIVE COOLANTS MARKET, BY END USER, 2023-2032 (USD MILLION) 173
    513. INDONESIA: AUTOMOTIVE COOLANTS MARKET, BY END USER, 2023-2032 (MILLION GALLONS)
    514. 173
    515. TABLE 200 SOUTH KOREA: AUTOMOTIVE COOLANTS MARKET, BY TECHNOLOGY,
    516. 2032 (USD MILLION) 174
    517. TABLE 201 SOUTH KOREA: AUTOMOTIVE COOLANTS
    518. MARKET, BY TECHNOLOGY, 2023-2032 (MILLION GALLONS) 174
    519. TABLE 202 SOUTH
    520. KOREA: AUTOMOTIVE COOLANTS MARKET, BY PRODUCT, 2023-2032 (USD MILLION) 175
    521. SOUTH KOREA: AUTOMOTIVE COOLANTS MARKET, BY PRODUCT, 2023-2032 (MILLION GALLONS)
    522. 175
    523. TABLE 204 SOUTH KOREA: AUTOMOTIVE COOLANTS MARKET, BY VEHICLE TYPE,
    524. 2032 (USD MILLION) 176
    525. TABLE 205 SOUTH KOREA: AUTOMOTIVE COOLANTS
    526. MARKET, BY VEHICLE TYPE, 2023-2032 (MILLION GALLONS) 176
    527. TABLE 206 SOUTH
    528. KOREA: AUTOMOTIVE COOLANTS MARKET, BY END USER, 2023-2032 (USD MILLION) 177
    529. SOUTH KOREA: AUTOMOTIVE COOLANTS MARKET, BY END USER, 2023-2032 (MILLION GALLONS)
    530. 177
    531. TABLE 208 THAILAND: AUTOMOTIVE COOLANTS MARKET, BY TECHNOLOGY, 2023-2032
    532. (USD MILLION) 178
    533. TABLE 209 THAILAND: AUTOMOTIVE COOLANTS MARKET, BY TECHNOLOGY,
    534. 2032 (MILLION GALLONS) 178
    535. TABLE 210 THAILAND: AUTOMOTIVE COOLANTS
    536. MARKET, BY PRODUCT, 2023-2032 (USD MILLION) 179
    537. TABLE 211 THAILAND: AUTOMOTIVE
    538. COOLANTS MARKET, BY PRODUCT, 2023-2032 (MILLION GALLONS) 179
    539. TABLE 212
    540. THAILAND: AUTOMOTIVE COOLANTS MARKET, BY VEHICLE TYPE, 2023-2032 (USD MILLION) 180
    541. THAILAND: AUTOMOTIVE COOLANTS MARKET, BY VEHICLE TYPE, 2023-2032 (MILLION GALLONS)
    542. 180
    543. TABLE 214 THAILAND: AUTOMOTIVE COOLANTS MARKET, BY END USER, 2023-2032
    544. (USD MILLION) 181
    545. TABLE 215 THAILAND: AUTOMOTIVE COOLANTS MARKET, BY END
    546. USER, 2023-2032 (MILLION GALLONS) 181
    547. TABLE 216 REST OF ASIA-PACIFIC:
    548. AUTOMOTIVE COOLANTS MARKET, BY TECHNOLOGY, 2023-2032 (USD MILLION) 182
    549. REST OF ASIA-PACIFIC: AUTOMOTIVE COOLANTS MARKET, BY TECHNOLOGY, 2023-2032 (MILLION
    550. GALLONS) 182
    551. TABLE 218 REST OF ASIA-PACIFIC: AUTOMOTIVE COOLANTS MARKET,
    552. BY PRODUCT, 2023-2032 (USD MILLION) 183
    553. TABLE 219 REST OF ASIA-PACIFIC:
    554. AUTOMOTIVE COOLANTS MARKET, BY PRODUCT, 2023-2032 (MILLION GALLONS) 183
    555. REST OF ASIA-PACIFIC: AUTOMOTIVE COOLANTS MARKET, BY VEHICLE TYPE, 2023-2032
    556. (USD MILLION) 184
    557. TABLE 221 REST OF ASIA-PACIFIC: AUTOMOTIVE COOLANTS
    558. MARKET, BY VEHICLE TYPE, 2023-2032 (MILLION GALLONS) 184
    559. TABLE 222 REST
    560. OF ASIA-PACIFIC: AUTOMOTIVE COOLANTS MARKET, BY END USER, 2023-2032 (USD MILLION)
    561. 185
    562. TABLE 223 REST OF ASIA-PACIFIC: AUTOMOTIVE COOLANTS MARKET, BY END
    563. USER, 2023-2032 (MILLION GALLONS) 185
    564. TABLE 224 MIDDLE EAST & AFRICA:
    565. AUTOMOTIVE COOLANTS MARKET, BY COUNTRY, 2023-2032 (USD MILLION) 186
    566. MIDDLE EAST & AFRICA: AUTOMOTIVE COOLANTS MARKET, BY COUNTRY, 2023-2032
    567. (MILLION GALLONS) 187
    568. TABLE 226 MIDDLE EAST & AFRICA: AUTOMOTIVE COOLANTS
    569. MARKET, BY TECHNOLOGY, 2023-2032 (USD MILLION) 187
    570. TABLE 227 MIDDLE EAST
    571. & AFRICA: AUTOMOTIVE COOLANTS MARKET, BY TECHNOLOGY, 2023-2032 (MILLION GALLONS)
    572. 188
    573. TABLE 228 MIDDLE EAST & AFRICA: AUTOMOTIVE COOLANTS MARKET, BY
    574. PRODUCT, 2023-2032 (USD MILLION) 188
    575. TABLE 229 MIDDLE EAST & AFRICA:
    576. AUTOMOTIVE COOLANTS MARKET, BY PRODUCT, 2023-2032 (MILLION GALLONS) 189
    577. MIDDLE EAST & AFRICA: AUTOMOTIVE COOLANTS MARKET, BY VEHICLE TYPE, 2023-2032
    578. (USD MILLION) 189
    579. TABLE 231 MIDDLE EAST & AFRICA: AUTOMOTIVE COOLANTS
    580. MARKET, BY VEHICLE TYPE, 2023-2032 (MILLION GALLONS) 190
    581. TABLE 232 MIDDLE
    582. EAST & AFRICA: AUTOMOTIVE COOLANTS MARKET, BY END USER, 2023-2032 (USD MILLION)
    583. 190
    584. TABLE 233 MIDDLE EAST & AFRICA: AUTOMOTIVE COOLANTS MARKET, BY
    585. END USER, 2023-2032 (MILLION GALLONS) 191
    586. TABLE 234 GCC: AUTOMOTIVE COOLANTS
    587. MARKET, BY TECHNOLOGY, 2023-2032 (USD MILLION) 191
    588. TABLE 235 GCC: AUTOMOTIVE
    589. COOLANTS MARKET, BY TECHNOLOGY, 2023-2032 (MILLION GALLONS) 192
    590. GCC: AUTOMOTIVE COOLANTS MARKET, BY PRODUCT, 2023-2032 (USD MILLION) 192
    591. GCC: AUTOMOTIVE COOLANTS MARKET, BY PRODUCT, 2023-2032 (MILLION GALLONS) 193
    592. GCC: AUTOMOTIVE COOLANTS MARKET, BY VEHICLE TYPE, 2023-2032 (USD MILLION) 193
    593. GCC: AUTOMOTIVE COOLANTS MARKET, BY VEHICLE TYPE, 2023-2032 (MILLION GALLONS)
    594. 194
    595. TABLE 240 GCC: AUTOMOTIVE COOLANTS MARKET, BY END USER, 2023-2032
    596. (USD MILLION) 194
    597. TABLE 241 GCC: AUTOMOTIVE COOLANTS MARKET, BY END USER,
    598. 2032 (MILLION GALLONS) 194
    599. TABLE 242 TURKEY: AUTOMOTIVE COOLANTS
    600. MARKET, BY TECHNOLOGY, 2023-2032 (USD MILLION) 195
    601. TABLE 243 TURKEY: AUTOMOTIVE
    602. COOLANTS MARKET, BY TECHNOLOGY, 2023-2032 (MILLION GALLONS) 195
    603. TURKEY: AUTOMOTIVE COOLANTS MARKET, BY PRODUCT, 2023-2032 (USD MILLION) 196
    604. TURKEY: AUTOMOTIVE COOLANTS MARKET, BY PRODUCT, 2023-2032 (MILLION GALLONS)
    605. 196
    606. TABLE 246 TURKEY: AUTOMOTIVE COOLANTS MARKET, BY VEHICLE TYPE, 2023-2032
    607. (USD MILLION) 197
    608. TABLE 247 TURKEY: AUTOMOTIVE COOLANTS MARKET, BY VEHICLE
    609. TYPE, 2023-2032 (MILLION GALLONS) 197
    610. TABLE 248 TURKEY: AUTOMOTIVE COOLANTS
    611. MARKET, BY END USER, 2023-2032 (USD MILLION) 198
    612. TABLE 249 TURKEY: AUTOMOTIVE
    613. COOLANTS MARKET, BY END USER, 2023-2032 (MILLION GALLONS) 198
    614. TABLE 250
    615. SOUTH AFRICA: AUTOMOTIVE COOLANTS MARKET, BY TECHNOLOGY, 2023-2032 (USD MILLION)
    616. 199
    617. TABLE 251 SOUTH AFRICA: AUTOMOTIVE COOLANTS MARKET, BY TECHNOLOGY,
    618. 2032 (MILLION GALLONS) 199
    619. TABLE 252 SOUTH AFRICA: AUTOMOTIVE COOLANTS
    620. MARKET, BY PRODUCT, 2023-2032 (USD MILLION) 200
    621. TABLE 253 SOUTH AFRICA:
    622. AUTOMOTIVE COOLANTS MARKET, BY PRODUCT, 2023-2032 (MILLION GALLONS) 200
    623. SOUTH AFRICA: AUTOMOTIVE COOLANTS MARKET, BY VEHICLE TYPE, 2023-2032 (USD MILLION)
    624. 201
    625. TABLE 255 SOUTH AFRICA: AUTOMOTIVE COOLANTS MARKET, BY VEHICLE TYPE,
    626. 2032 (MILLION GALLONS) 201
    627. TABLE 256 SOUTH AFRICA: AUTOMOTIVE COOLANTS
    628. MARKET, BY END USER, 2023-2032 (USD MILLION) 202
    629. TABLE 257 SOUTH AFRICA:
    630. AUTOMOTIVE COOLANTS MARKET, BY END USER, 2023-2032 (MILLION GALLONS) 202
    631. REST OF THE MIDDLE EAST & AFRICA: AUTOMOTIVE COOLANTS MARKET, BY TECHNOLOGY,
    632. 2032 (USD MILLION) 203
    633. TABLE 259 REST OF THE MIDDLE EAST & AFRICA:
    634. AUTOMOTIVE COOLANTS MARKET, BY TECHNOLOGY, 2023-2032 (MILLION GALLONS) 203
    635. REST OF THE MIDDLE EAST & AFRICA: AUTOMOTIVE COOLANTS MARKET, BY PRODUCT,
    636. 2032 (USD MILLION) 204
    637. TABLE 261 REST OF THE MIDDLE EAST & AFRICA:
    638. AUTOMOTIVE COOLANTS MARKET, BY PRODUCT, 2023-2032 (MILLION GALLONS) 204
    639. REST OF THE MIDDLE EAST & AFRICA: AUTOMOTIVE COOLANTS MARKET, BY VEHICLE
    640. TYPE, 2023-2032 (USD MILLION) 205
    641. TABLE 263 REST OF THE MIDDLE EAST &
    642. AFRICA: AUTOMOTIVE COOLANTS MARKET, BY VEHICLE TYPE, 2023-2032 (MILLION GALLONS)
    643. 205
    644. TABLE 264 REST OF THE MIDDLE EAST & AFRICA: AUTOMOTIVE COOLANTS
    645. MARKET, BY END USER, 2023-2032 (USD MILLION) 206
    646. TABLE 265 REST OF THE
    647. MIDDLE EAST & AFRICA: AUTOMOTIVE COOLANTS MARKET, BY END USER, 2023-2032 (MILLION
    648. GALLONS) 206
    649. TABLE 266 LATIN AMERICA: AUTOMOTIVE COOLANTS MARKET, BY COUNTRY,
    650. 2032 (USD MILLION) 208
    651. TABLE 267 LATIN AMERICA: AUTOMOTIVE COOLANTS
    652. MARKET, BY COUNTRY, 2023-2032 (MILLION GALLONS) 208
    653. TABLE 268 LATIN AMERICA:
    654. AUTOMOTIVE COOLANTS MARKET, BY TECHNOLOGY, 2023-2032 (USD MILLION) 209
    655. LATIN AMERICA: AUTOMOTIVE COOLANTS MARKET, BY TECHNOLOGY, 2023-2032 (MILLION
    656. GALLONS) 209
    657. TABLE 270 LATIN AMERICA: AUTOMOTIVE COOLANTS MARKET, BY PRODUCT,
    658. 2032 (USD MILLION) 210
    659. TABLE 271 LATIN AMERICA: AUTOMOTIVE COOLANTS
    660. MARKET, BY PRODUCT, 2023-2032 (MILLION GALLONS) 210
    661. TABLE 272 LATIN AMERICA:
    662. AUTOMOTIVE COOLANTS MARKET, BY VEHICLE TYPE, 2023-2032 (USD MILLION) 211
    663. LATIN AMERICA: AUTOMOTIVE COOLANTS MARKET, BY VEHICLE TYPE, 2023-2032 (MILLION
    664. GALLONS) 211
    665. TABLE 274 LATIN AMERICA: AUTOMOTIVE COOLANTS MARKET, BY END
    666. USER, 2023-2032 (USD MILLION) 212
    667. TABLE 275 LATIN AMERICA: AUTOMOTIVE
    668. COOLANTS MARKET, BY END USER, 2023-2032 (MILLION GALLONS) 212
    669. TABLE 276
    670. BRAZIL: AUTOMOTIVE COOLANTS MARKET, BY TECHNOLOGY, 2023-2032 (USD MILLION) 213
    671. BRAZIL: AUTOMOTIVE COOLANTS MARKET, BY TECHNOLOGY, 2023-2032 (MILLION GALLONS)
    672. 213
    673. TABLE 278 BRAZIL: AUTOMOTIVE COOLANTS MARKET, BY PRODUCT, 2023-2032
    674. (USD MILLION) 214
    675. TABLE 279 BRAZIL: AUTOMOTIVE COOLANTS MARKET, BY PRODUCT,
    676. 2032 (MILLION GALLONS) 214
    677. TABLE 280 BRAZIL: AUTOMOTIVE COOLANTS
    678. MARKET, BY VEHICLE TYPE, 2023-2032 (USD MILLION) 215
    679. TABLE 281 BRAZIL:
    680. AUTOMOTIVE COOLANTS MARKET, BY VEHICLE TYPE, 2023-2032 (MILLION GALLONS) 215
    681. BRAZIL: AUTOMOTIVE COOLANTS MARKET, BY END USER, 2023-2032 (USD MILLION) 216
    682. BRAZIL: AUTOMOTIVE COOLANTS MARKET, BY END USER, 2023-2032 (MILLION GALLONS)
    683. 216
    684. TABLE 284 MEXICO: AUTOMOTIVE COOLANTS MARKET, BY TECHNOLOGY, 2023-2032
    685. (USD MILLION) 217
    686. TABLE 285 MEXICO: AUTOMOTIVE COOLANTS MARKET, BY TECHNOLOGY,
    687. 2032 (MILLION GALLONS) 217
    688. TABLE 286 MEXICO: AUTOMOTIVE COOLANTS
    689. MARKET, BY PRODUCT, 2023-2032 (USD MILLION) 218
    690. TABLE 287 MEXICO: AUTOMOTIVE
    691. COOLANTS MARKET, BY PRODUCT, 2023-2032 (MILLION GALLONS) 218
    692. TABLE 288
    693. MEXICO: AUTOMOTIVE COOLANTS MARKET, BY VEHICLE TYPE, 2023-2032 (USD MILLION) 219
    694. MEXICO: AUTOMOTIVE COOLANTS MARKET, BY VEHICLE TYPE, 2023-2032 (MILLION GALLONS)
    695. 219
    696. TABLE 290 MEXICO: AUTOMOTIVE COOLANTS MARKET, BY END USER, 2023-2032
    697. (USD MILLION) 220
    698. TABLE 291 MEXICO: AUTOMOTIVE COOLANTS MARKET, BY END
    699. USER, 2023-2032 (MILLION GALLONS) 220
    700. TABLE 292 ARGENTINA: AUTOMOTIVE
    701. COOLANTS MARKET, BY TECHNOLOGY, 2023-2032 (USD MILLION) 221
    702. TABLE 293
    703. ARGENTINA: AUTOMOTIVE COOLANTS MARKET, BY TECHNOLOGY, 2023-2032 (MILLION GALLONS)
    704. 221
    705. TABLE 294 ARGENTINA: AUTOMOTIVE COOLANTS MARKET, BY PRODUCT, 2023-2032
    706. (USD MILLION) 222
    707. TABLE 295 ARGENTINA: AUTOMOTIVE COOLANTS MARKET, BY
    708. PRODUCT, 2023-2032 (MILLION GALLONS) 222
    709. TABLE 296 ARGENTINA: AUTOMOTIVE
    710. COOLANTS MARKET, BY VEHICLE TYPE, 2023-2032 (USD MILLION) 223
    711. TABLE 297
    712. ARGENTINA: AUTOMOTIVE COOLANTS MARKET, BY VEHICLE TYPE, 2023-2032 (MILLION GALLONS)
    713. 223
    714. TABLE 298 ARGENTINA: AUTOMOTIVE COOLANTS MARKET, BY END USER, 2023-2032
    715. (USD MILLION) 224
    716. TABLE 299 ARGENTINA: AUTOMOTIVE COOLANTS MARKET, BY
    717. END USER, 2023-2032 (MILLION GALLONS) 224
    718. TABLE 300 REST OF LATIN AMERICA:
    719. AUTOMOTIVE COOLANTS MARKET, BY TECHNOLOGY, 2023-2032 (USD MILLION) 225
    720. REST OF LATIN AMERICA: AUTOMOTIVE COOLANTS MARKET, BY TECHNOLOGY, 2023-2032
    721. (MILLION GALLONS) 225
    722. TABLE 302 REST OF LATIN AMERICA: AUTOMOTIVE COOLANTS
    723. MARKET, BY PRODUCT, 2023-2032 (USD MILLION) 226
    724. TABLE 303 REST OF LATIN
    725. AMERICA: AUTOMOTIVE COOLANTS MARKET, BY PRODUCT, 2023-2032 (MILLION GALLONS) 226
    726. REST OF LATIN AMERICA: AUTOMOTIVE COOLANTS MARKET, BY VEHICLE TYPE, 2023-2032
    727. (USD MILLION) 227
    728. TABLE 305 REST OF LATIN AMERICA: AUTOMOTIVE COOLANTS
    729. MARKET, BY VEHICLE TYPE, 2023-2032 (MILLION GALLONS) 227
    730. TABLE 306 REST
    731. OF LATIN AMERICA: AUTOMOTIVE COOLANTS MARKET, BY END USER, 2023-2032 (USD MILLION)
    732. 228
    733. TABLE 307 REST OF LATIN AMERICA: AUTOMOTIVE COOLANTS MARKET, BY END
    734. USER, 2023-2032 (MILLION GALLONS) 228
    735. TABLE 308 KEY DEVELOPMENTS 230
    736. VALVOLINE INC.: PRODUCTS OFFERED 235
    737. TABLE 310 VALVOLINE INC.: KEY
    738. DEVELOPMENTS 235
    739. TABLE 311 EXXONMOBIL CORPORATION: PRODUCTS OFFERED 238
    740. BASF SE: PRODUCTS OFFERED 242
    741. TABLE 313 BASF SE: KEY DEVELOPMENTS
    742. 242
    743. TABLE 314 TOTAL: PRODUCTS OFFERED 246
    744. TABLE 315 CHEVRON
    745. CORPORATION: PRODUCTS OFFERED 250
    746. TABLE 316 ROYAL DUTCH SHELL PLC: PRODUCTS
    747. TABLE 317 OLD WORLD INDUSTRIES, LLC: PRODUCTS OFFERED 256
    748. OLD WORLD INDUSTRIES, LLC: KEY DEVELOPMENTS 257
    749. TABLE 319 PRESTONE
    750. PRODUCTS CORPORATION: PRODUCTS OFFERED 259
    751. TABLE 320 PRESTONE PRODUCTS
    752. CORPORATION: KEY DEVELOPMENTS 260
    753. TABLE 321 ARTECO: PRODUCTS OFFERED 263
    754. RECOCHEM CORPORATION: PRODUCTS OFFERED 266
    755. TABLE 323 RECOCHEM CORPORATION:
    756. KEY DEVELOPMENTS 267
    757. TABLE 324 AMSOIL INC.: PRODUCTS OFFERED 269
    758. MOTUL: PRODUCTS OFFERED 271
    759. LIST OF FIGURES
    760. FIGURE 1
    761. MARKET SYNOPSIS 22
    762. FIGURE 2 MARKET ATTRACTIVENESS ANALYSIS: GLOBAL AUTOMOTIVE
    763. COOLANT MARKET 23
    764. FIGURE 3 GLOBAL AUTOMOTIVE COOLANT MARKET ANALYSIS,
    765. BY TECHNOLOGY 24
    766. FIGURE 4 GLOBAL AUTOMOTIVE COOLANT MARKET ANALYSIS, BY
    767. PRODUCT 25
    768. FIGURE 5 GLOBAL AUTOMOTIVE COOLANT MARKET ANALYSIS, BY VEHICLE
    769. TYPE 26
    770. FIGURE 6 GLOBAL AUTOMOTIVE COOLANT MARKET ANALYSIS, BY END USE
    771. FIGURE 7 GLOBAL AUTOMOTIVE COOLANT MARKET ANALYSIS, BY REGION 28
    772. FIGURE
    773. GLOBAL AUTOMOTIVE COOLANT MARKET: STRUCTURE \\ 29
    774. FIGURE 9 RESEARCH
    775. PROCESS 30
    776. FIGURE 10 TOP-DOWN & Bottom-up ApproachES 33
    777. MARKET DYNAMICS OF GLOBAL AUTOMOTIVE COOLANT MARKET 36
    778. FIGURE 12 AVERAGE
    779. AGE OF VEHICLES IN THE US MARKET 37
    780. FIGURE 13 AVERAGE AGE OF PASSENGER
    781. CARS, BY COUNTRY, 2023 38
    782. FIGURE 14 SALE OF COMMERCIAL VEHICLES IN THE
    783. AMERICAS, 2023-2032 39
    784. FIGURE 15 SALE OF COMMERCIAL VEHICLES IN EUROPE,
    785. 2032 39
    786. FIGURE 16 SALE OF COMMERCIAL VEHICLES IN CHINA AND INDIA,
    787. 2032 40
    788. FIGURE 17 DRIVERS IMPACT ANALYSIS: AUTOMOTIVE COOLANT MARKET
    789. 40
    790. FIGURE 18 BRENT CRUDE OIL PRICES (2023-2032) 41
    791. FIGURE 19
    792. RESTRAINTS IMPACT ANALYSIS: GLOBAL AUTOMOTIVE COOLANT MARKET 42
    793. GLOBAL ELECTRIC VEHICLES SALES FORECAST (% OF TOTAL VEHICLE SALES), (2023-2032)
    794. 44
    795. FIGURE 21 NUMBER OF ELECTRIC CARS IN CIRCULATION IN THE US, 2023-2032
    796. FIGURE 22 SUPPLY CHAIN: GLOBAL AUTOMOTIVE COOLANT MARKET 45
    797. Porter's Five Forces Analysis OF THE GLOBAL AUTOMOTIVE COOLANT MARKET 48
    798. GLOBAL AUTOMOTIVE COOLANTS MARKET, BY TECHNOLOGY, 2023 (% SHARE) 56
    799. GLOBAL AUTOMOTIVE COOLANTS MARKET, BY TECHNOLOGY, 2023 TO 2027 (USD MILLION)
    800. 57
    801. FIGURE 26 GLOBAL AUTOMOTIVE COOLANTS MARKET, BY TECHNOLOGY, 2023 TO
    802. (MILLION GALLONS) 58
    803. FIGURE 27 GLOBAL AUTOMOTIVE COOLANTS MARKET,
    804. BY PRODUCT, 2023 (% SHARE) 64
    805. FIGURE 28 GLOBAL AUTOMOTIVE COOLANTS MARKET,
    806. BY PRODUCT, 2023 TO 2027 (USD MILLION) 65
    807. FIGURE 29 GLOBAL AUTOMOTIVE
    808. COOLANTS MARKET, BY PRODUCT, 2023 TO 2027 (MILLION GALLONS) 66
    809. GLOBAL AUTOMOTIVE COOLANTS MARKET, BY VEHICLE TYPE, 2023 (% SHARE) 73
    810. GLOBAL AUTOMOTIVE COOLANTS MARKET, BY VEHICLE TYPE, 2023 TO 2027 (USD MILLION)
    811. FIGURE 32 GLOBAL AUTOMOTIVE COOLANTS MARKET, BY VEHICLE TYPE, 2023
    812. TO 2027 (MILLION GALLONS) 75
    813. FIGURE 33 GLOBAL AUTOMOTIVE COOLANTS MARKET,
    814. BY END USER, 2023 (% SHARE) 82
    815. FIGURE 34 GLOBAL AUTOMOTIVE COOLANTS MARKET,
    816. BY END USER, 2023 TO 2027 (USD MILLION) 83
    817. FIGURE 35 GLOBAL AUTOMOTIVE
    818. COOLANTS MARKET, BY END USER, 2023 TO 2027 (MILLION GALLONS) 84
    819. GLOBAL AUTOMOTIVE COOLANTS MARKET, BY REGION, 2023 (% SHARE) 88
    820. GLOBAL AUTOMOTIVE COOLANTS MARKET, BY REGION, 2023-2032 (USD MILLION) 89
    821. GLOBAL AUTOMOTIVE COOLANTS MARKET, BY REGION, 2023-2032 (MILLION GALLONS) 90
    822. NORTH AMERICA: AUTOMOTIVE COOLANTS MARKET SHARE, BY COUNTRY, 2023 (% SHARE) 91
    823. EUROPE: AUTOMOTIVE COOLANTS MARKET SHARE, BY COUNTRY, 2023 (% SHARE) 105
    824. ASIA-PACIFIC: AUTOMOTIVE COOLANTS MARKET SHARE, BY COUNTRY, 2023 (% SHARE) 148
    825. MIDDLE EAST & AFRICA: AUTOMOTIVE COOLANTS MARKET SHARE, BY COUNTRY, 2023
    826. (% SHARE) 186
    827. FIGURE 43 LATIN AMERICA: AUTOMOTIVE COOLANTS MARKET SHARE,
    828. BY COUNTRY, 2023 (% SHARE) 207
    829. FIGURE 44 MAJOR MANUFACTURER STRATEGY ANALYSIS,
    830. 230
    831. FIGURE 45 BENCHMARKING OF MAJOR COMPETITORS 232
    832. VALVOLINE INC.: FINANCIAL OVERVIEW SNAPSHOT 234
    833. FIGURE 47 VALVOLINE
    834. INC.: SWOT ANALYSIS 236
    835. FIGURE 48 EXXONMOBIL CORPORATION: FINANCIAL OVERVIEW
    836. SNAPSHOT 237
    837. FIGURE 49 EXXONMOBIL CORPORATION: SWOT ANALYSIS 238
    838. BASF SE: FINANCIAL OVERVIEW SNAPSHOT 241
    839. FIGURE 51 BASF SE: SWOT ANALYSIS
    840. FIGURE 52 TOTAL: FINANCIAL OVERVIEW SNAPSHOT 245
    841. TOTAL: SWOT ANALYSIS 247
    842. FIGURE 54 CHEVRON CORPORATION: FINANCIAL OVERVIEW
    843. SNAPSHOT 249
    844. FIGURE 55 CHEVRON CORPORATION: SWOT ANALYSIS 251
    845. ROYAL DUTCH SHELL PLC: FINANCIAL OVERVIEW SNAPSHOT 253
    846. FIGURE 57 ROYAL
    847. DUTCH SHELL PLC: SWOT ANALYSIS 255
    848. FIGURE 58 OLD WORLD INDUSTRIES, LLC:
    849. SWOT ANALYSIS 258
    850. FIGURE 59 PRESTONE PRODUCTS CORPORATION: SWOT ANALYSIS
    851. FIGURE 60 ARTECO: SWOT ANALYSIS 264
    852. FIGURE 61 RECOCHEM CORPORATION:
    853. FIGURE 62 AMSOIL INC.: SWOT ANALYSIS 270
    854. MOTUL: SWOT ANALYSIS 272

    Automotive Coolant Product Outlook (USD Billion, 2018-2032)

    • Ethylene Glycol
    • Propylene Glycol
    • Glycerin
    • Others

    Automotive Coolant Vehicle Type Outlook (USD Billion, 2018-2032)

    • Passenger Car
    • Heavy Commercial Vehicles
    • Light Commercial Vehicles
    • Others

    Automotive Coolant Technology Outlook (USD Billion, 2018-2032)

    • Inorganic Additive Technology (IAT)
    • Organic Additive Technology (OAT)
    • Hybrid Organic Acid Technology (HOAT)

    Automotive Coolant End User Outlook (USD Billion, 2018-2032)

    • Original Equipment Manufacturer (OEM)
    • Automotive Aftermarket

    Automotive Coolant Regional Outlook (USD Billion, 2018-2032)

    • North America Outlook (USD Billion, 2018-2032)

      • North America Automotive Coolant by Product
        • Ethylene Glycol
        • Propylene Glycol
        • Glycerin
        • Others
      • North America Automotive Coolant by Vehicle Type
        • Passenger Car
        • Heavy Commercial Vehicles
        • Light Commercial Vehicles
        • Others
      • North America Automotive Coolant by Technology
        • Inorganic Additive Technology (IAT)
        • Organic Additive Technology (OAT)
        • Hybrid Organic Acid Technology (HOAT)
      • North America Automotive Coolant by End User
        • Original Equipment Manufacturer (OEM)
        • Automotive Aftermarket
      • US Outlook (USD Billion, 2018-2032)

      • US Automotive Coolant by Product
        • Ethylene Glycol
        • Propylene Glycol
        • Glycerin
        • Others
      • US Automotive Coolant by Vehicle Type
        • Passenger Car
        • Heavy Commercial Vehicles
        • Light Commercial Vehicles
        • Others
      • US Automotive Coolant by Technology
        • Inorganic Additive Technology (IAT)
        • Organic Additive Technology (OAT)
        • Hybrid Organic Acid Technology (HOAT)
      • US Automotive Coolant by End User
        • Original Equipment Manufacturer (OEM)
        • Automotive Aftermarket
      • CANADA Outlook (USD Billion, 2018-2032)

      • CANADA Automotive Coolant by Product
        • Ethylene Glycol
        • Propylene Glycol
        • Glycerin
        • Others
      • CANADA Automotive Coolant by Vehicle Type
        • Passenger Car
        • Heavy Commercial Vehicles
        • Light Commercial Vehicles
        • Others
      • CANADA Automotive Coolant by Technology
        • Inorganic Additive Technology (IAT)
        • Organic Additive Technology (OAT)
        • Hybrid Organic Acid Technology (HOAT)
      • CANADA Automotive Coolant by End User
        • Original Equipment Manufacturer (OEM)
        • Automotive Aftermarket
    • Europe Outlook (USD Billion, 2018-2032)

      • Europe Automotive Coolant by Product
        • Ethylene Glycol
        • Propylene Glycol
        • Glycerin
        • Others
      • Europe Automotive Coolant by Vehicle Type
        • Passenger Car
        • Heavy Commercial Vehicles
        • Light Commercial Vehicles
        • Others
      • Europe Automotive Coolant by Technology
        • Inorganic Additive Technology (IAT)
        • Organic Additive Technology (OAT)
        • Hybrid Organic Acid Technology (HOAT)
      • Europe Automotive Coolant by End User
        • Original Equipment Manufacturer (OEM)
        • Automotive Aftermarket
      • Germany Outlook (USD Billion, 2018-2032)

      • Germany Automotive Coolant by Product
        • Ethylene Glycol
        • Propylene Glycol
        • Glycerin
        • Others
      • Germany Automotive Coolant by Vehicle Type
        • Passenger Car
        • Heavy Commercial Vehicles
        • Light Commercial Vehicles
        • Others
      • Germany Automotive Coolant by Technology
        • Inorganic Additive Technology (IAT)
        • Organic Additive Technology (OAT)
        • Hybrid Organic Acid Technology (HOAT)
      • Germany Automotive Coolant by End User
        • Original Equipment Manufacturer (OEM)
        • Automotive Aftermarket
      • France Outlook (USD Billion, 2018-2032)

      • France Automotive Coolant by Product
        • Ethylene Glycol
        • Propylene Glycol
        • Glycerin
        • Others
      • France Automotive Coolant by Vehicle Type
        • Passenger Car
        • Heavy Commercial Vehicles
        • Light Commercial Vehicles
        • Others
      • France Automotive Coolant by Technology
        • Inorganic Additive Technology (IAT)
        • Organic Additive Technology (OAT)
        • Hybrid Organic Acid Technology (HOAT)
      • France Automotive Coolant by End User
        • Original Equipment Manufacturer (OEM)
        • Automotive Aftermarket
      • UK Outlook (USD Billion, 2018-2032)

      • UK Automotive Coolant by Product
        • Ethylene Glycol
        • Propylene Glycol
        • Glycerin
        • Others
      • UK Automotive Coolant by Vehicle Type
        • Passenger Car
        • Heavy Commercial Vehicles
        • Light Commercial Vehicles
        • Others
      • UK Automotive Coolant by Technology
        • Inorganic Additive Technology (IAT)
        • Organic Additive Technology (OAT)
        • Hybrid Organic Acid Technology (HOAT)
      • UK Automotive Coolant by End User
        • Original Equipment Manufacturer (OEM)
        • Automotive Aftermarket
      • ITALY Outlook (USD Billion, 2018-2032)

      • ITALY Automotive Coolant by Product
        • Ethylene Glycol
        • Propylene Glycol
        • Glycerin
        • Others
      • ITALY Automotive Coolant by Vehicle Type
        • Passenger Car
        • Heavy Commercial Vehicles
        • Light Commercial Vehicles
        • Others
      • ITALY Automotive Coolant by Technology
        • Inorganic Additive Technology (IAT)
        • Organic Additive Technology (OAT)
        • Hybrid Organic Acid Technology (HOAT)
      • ITALY Automotive Coolant by End User
        • Original Equipment Manufacturer (OEM)
        • Automotive Aftermarket
      • SPAIN Outlook (USD Billion, 2018-2032)

      • Spain Automotive Coolant by Product
        • Ethylene Glycol
        • Propylene Glycol
        • Glycerin
        • Others
      • Spain Automotive Coolant by Vehicle Type
        • Passenger Car
        • Heavy Commercial Vehicles
        • Light Commercial Vehicles
        • Others
      • Spain Automotive Coolant by Technology
        • Inorganic Additive Technology (IAT)
        • Organic Additive Technology (OAT)
        • Hybrid Organic Acid Technology (HOAT)
      • Spain Automotive Coolant by End User
        • Original Equipment Manufacturer (OEM)
        • Automotive Aftermarket
      • Rest Of Europe Outlook (USD Billion, 2018-2032)

      • Rest Of Europe Automotive Coolant by Product
        • Ethylene Glycol
        • Propylene Glycol
        • Glycerin
        • Others
      • Rest Of Europe Automotive Coolant by Vehicle Type
        • Passenger Car
        • Heavy Commercial Vehicles
        • Light Commercial Vehicles
        • Others
      • Rest Of Europe Automotive Coolant by Technology
        • Inorganic Additive Technology (IAT)
        • Organic Additive Technology (OAT)
        • Hybrid Organic Acid Technology (HOAT)
      • REST OF EUROPE Automotive Coolant by End User
        • Original Equipment Manufacturer (OEM)
        • Automotive Aftermarket
    • Asia-Pacific Outlook (USD Billion, 2018-2032)

      • Asia-Pacific Automotive Coolant by Product
        • Ethylene Glycol
        • Propylene Glycol
        • Glycerin
        • Others
      • Asia-Pacific Automotive Coolant by Vehicle Type
        • Passenger Car
        • Heavy Commercial Vehicles
        • Light Commercial Vehicles
        • Others
      • Asia-Pacific Automotive Coolant by Technology
        • Inorganic Additive Technology (IAT)
        • Organic Additive Technology (OAT)
        • Hybrid Organic Acid Technology (HOAT)
      • Asia-Pacific Automotive Coolant by End User
        • Original Equipment Manufacturer (OEM)
        • Automotive Aftermarket
      • China Outlook (USD Billion, 2018-2032)

      • China Automotive Coolant by Product
        • Ethylene Glycol
        • Propylene Glycol
        • Glycerin
        • Others
      • China Automotive Coolant by Vehicle Type
        • Passenger Car
        • Heavy Commercial Vehicles
        • Light Commercial Vehicles
        • Others
      • China Automotive Coolant by Technology
        • Inorganic Additive Technology (IAT)
        • Organic Additive Technology (OAT)
        • Hybrid Organic Acid Technology (HOAT)
      • China Automotive Coolant by End User
        • Original Equipment Manufacturer (OEM)
        • Automotive Aftermarket
      • Japan Outlook (USD Billion, 2018-2032)

      • Japan Automotive Coolant by Product
        • Ethylene Glycol
        • Propylene Glycol
        • Glycerin
        • Others
      • Japan Automotive Coolant by Vehicle Type
        • Passenger Car
        • Heavy Commercial Vehicles
        • Light Commercial Vehicles
        • Others
      • Japan Automotive Coolant by Technology
        • Inorganic Additive Technology (IAT)
        • Organic Additive Technology (OAT)
        • Hybrid Organic Acid Technology (HOAT)
      • Japan Automotive Coolant by End User
        • Original Equipment Manufacturer (OEM)
        • Automotive Aftermarket
      • India Outlook (USD Billion, 2018-2032)

      • India Automotive Coolant by Product
        • Ethylene Glycol
        • Propylene Glycol
        • Glycerin
        • Others
      • India Automotive Coolant by Vehicle Type
        • Passenger Car
        • Heavy Commercial Vehicles
        • Light Commercial Vehicles
        • Others
      • India Automotive Coolant by Technology
        • Inorganic Additive Technology (IAT)
        • Organic Additive Technology (OAT)
        • Hybrid Organic Acid Technology (HOAT)
      • India Automotive Coolant by End User
        • Original Equipment Manufacturer (OEM)
        • Automotive Aftermarket
      • Australia Outlook (USD Billion, 2018-2032)

      • Australia Automotive Coolant by Product
        • Ethylene Glycol
        • Propylene Glycol
        • Glycerin
        • Others
      • Australia Automotive Coolant by Vehicle Type
        • Passenger Car
        • Heavy Commercial Vehicles
        • Light Commercial Vehicles
        • Others
      • Australia Automotive Coolant by Technology
        • Inorganic Additive Technology (IAT)
        • Organic Additive Technology (OAT)
        • Hybrid Organic Acid Technology (HOAT)
      • Australia Automotive Coolant by End User
        • Original Equipment Manufacturer (OEM)
        • Automotive Aftermarket
      • Rest of Asia-Pacific Outlook (USD Billion, 2018-2032)

      • Rest of Asia-Pacific Automotive Coolant by Product
        • Ethylene Glycol
        • Propylene Glycol
        • Glycerin
        • Others
      • Rest of Asia-Pacific Automotive Coolant by Vehicle Type
        • Passenger Car
        • Heavy Commercial Vehicles
        • Light Commercial Vehicles
        • Others
      • Rest of Asia-Pacific Automotive Coolant by Technology
        • Inorganic Additive Technology (IAT)
        • Organic Additive Technology (OAT)
        • Hybrid Organic Acid Technology (HOAT)
      • Rest of Asia-Pacific Automotive Coolant by End User
        • Original Equipment Manufacturer (OEM)
        • Automotive Aftermarket
    • Rest of the World Outlook (USD Billion, 2018-2032)

      • Rest of the World Automotive Coolant by Product
        • Ethylene Glycol
        • Propylene Glycol
        • Glycerin
        • Others
      • Rest of the World Automotive Coolant by Vehicle Type
        • Passenger Car
        • Heavy Commercial Vehicles
        • Light Commercial Vehicles
        • Others
      • Rest of the World Automotive Coolant by Technology
        • Inorganic Additive Technology (IAT)
        • Organic Additive Technology (OAT)
        • Hybrid Organic Acid Technology (HOAT)
      • Rest of the World Automotive Coolant by End User
        • Original Equipment Manufacturer (OEM)
        • Automotive Aftermarket
      • Middle East Outlook (USD Billion, 2018-2032)

      • Middle East Automotive Coolant by Product
        • Ethylene Glycol
        • Propylene Glycol
        • Glycerin
        • Others
      • Middle East Automotive Coolant by Vehicle Type
        • Passenger Car
        • Heavy Commercial Vehicles
        • Light Commercial Vehicles
        • Others
      • Middle East Automotive Coolant by Technology
        • Inorganic Additive Technology (IAT)
        • Organic Additive Technology (OAT)
        • Hybrid Organic Acid Technology (HOAT)
      • Middle East Automotive Coolant by End User
        • Original Equipment Manufacturer (OEM)
        • Automotive Aftermarket
      • Africa Outlook (USD Billion, 2018-2032)

      • Africa Automotive Coolant by Product
        • Ethylene Glycol
        • Propylene Glycol
        • Glycerin
        • Others
      • Africa Automotive Coolant by Vehicle Type
        • Passenger Car
        • Heavy Commercial Vehicles
        • Light Commercial Vehicles
        • Others
      • Africa Automotive Coolant by Technology
        • Inorganic Additive Technology (IAT)
        • Organic Additive Technology (OAT)
        • Hybrid Organic Acid Technology (HOAT)
      • Africa Automotive Coolant by End User
        • Original Equipment Manufacturer (OEM)
        • Automotive Aftermarket
      • Latin America Outlook (USD Billion, 2018-2032)

      • Latin America Automotive Coolant by Product
        • Ethylene Glycol
        • Propylene Glycol
        • Glycerin
        • Others
      • Latin America Automotive Coolant by Vehicle Type
        • Passenger Car
        • Heavy Commercial Vehicles
        • Light Commercial Vehicles
        • Others
      • Latin America Automotive Coolant by Technology
        • Inorganic Additive Technology (IAT)
        • Organic Additive Technology (OAT)
        • Hybrid Organic Acid Technology (HOAT)
      • Latin America Automotive Coolant by End User
        • Original Equipment Manufacturer (OEM)
        • Automotive Aftermarket
    Infographic

    Free Sample Request

    Kindly complete the form below to receive a free sample of this Report

    Get Free Sample

    Customer Strories

    “I am very pleased with how market segments have been defined in a relevant way for my purposes (such as "Portable Freezers & refrigerators" and "last-mile"). In general the report is well structured. Thanks very much for your efforts.”

    Victoria Milne

    Founder
    Case Study
    Chemicals and Materials