Automotive Brake Valve Market (2026 - 2035)

ID: MRFR/AT/7068-HCR 111 Pages Triveni Bhoyar Last Updated: October 16, 2026
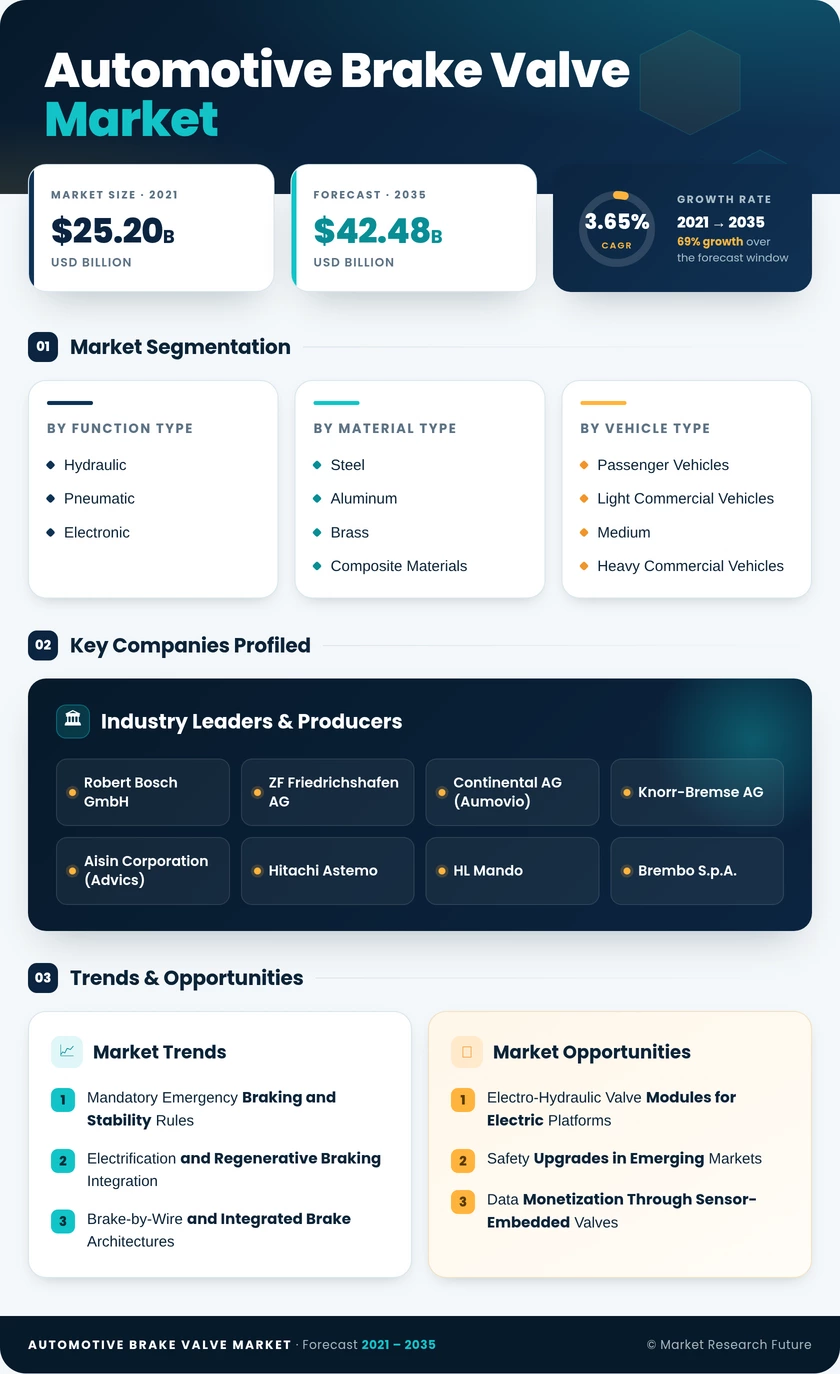
Automotive Brake Valve Market Research Report By Function Type (Hydraulic, Pneumatic, Electronic), By Material Type (Steel, Aluminum, Brass, Composite Materials), By Vehicle Type (Passenger Vehicles, Light Commercial Vehicles, Medium and Heavy Commercial Vehicles), By Technology (Conventional Braking Systems, Anti-lock Braking Systems, Regenerative Braking Systems), By Sales Channel (OEM, Aftermarket) - Forecast to 2035
Automotive Brake Valve Market
Market Size
Forecast Period2026-2035
CAGR (2026-2035)3.65%
2025 Market SizeUSD 29.68 Billion
2035 Market SizeUSD 42.48 Billion
Key Players
Robert Bosch GmbH
ZF Friedrichshafen AG
Continental AG
Knorr-Bremse AG
Aisin Corporation
Hitachi Astemo
Opportunities
  • Electro-Hydraulic Valve Modules for Electric Platforms
  • Safety Upgrades in Emerging Markets
  • Data Monetization Through Sensor-Embedded Valves
  1. 1 Market Summary | |
  2. 2 Key Report Takeaways | |
    1. 2.1 By Function Type | |
    2. 2.2 By Material Type | |
    3. 2.3 By Vehicle Type | |
    4. 2.4 By Technology | |
    5. 2.5 By Sales Channel | |
    6. 2.6 By Region | |
  3. 3 Market Size and Forecast (2021–2035) | |
  4. 4 Driver Impact Analysis | |
    1. 4.1 Mandatory Emergency Braking and Stability Rules | |
    2. 4.2 Electrification and Regenerative Braking Integration | |
    3. 4.3 Brake-by-Wire and Integrated Brake Architectures | |
    4. 4.4 E-Commerce Fleet Expansion in Light Commercial Vehicles | |
    5. 4.5 Safety Mandates in Emerging Economies | |
    6. 4.6 Lightweighting and Advanced Housing Materials | |
    7. 4.7 Ageing Vehicle Parc and Replacement Demand | |
  5. 5 Restraints Impact Analysis | |
    1. 5.1 Raw Material and Tariff Cost Volatility | |
    2. 5.2 Semiconductor and Electronics Supply Constraints | |
    3. 5.3 Functional Safety and Cybersecurity Compliance Costs | |
    4. 5.4 Electromechanical Brakes Displacing Hydraulic Valving | |
    5. 5.5 OEM Price-Down Pressure and Commoditization | |
  6. 6 Opportunities | |
    1. 6.1 Electro-Hydraulic Valve Modules for Electric Platforms | |
    2. 6.2 Safety Upgrades in Emerging Markets | |
    3. 6.3 Data Monetization Through Sensor-Embedded Valves | |
    4. 6.4 Certified Remanufacturing Programs | |
    5. 6.5 Composite and Additively Manufactured Housings | |
  7. 7 Regional Market Share and Country-Level Analysis | |
    1. 7.1 North America | | |
      1. 7.1.1 US | | |
      2. 7.1.2 Canada | | |
      3. 7.1.3 Mexico | |
    2. 7.2 Europe | | |
      1. 7.2.1 Germany | | |
      2. 7.2.2 UK | | |
      3. 7.2.3 France | | |
      4. 7.2.4 Italy | | |
      5. 7.2.5 Spain | | |
      6. 7.2.6 Nordic Countries | | |
      7. 7.2.7 Russia | | |
      8. 7.2.8 Rest of Europe | |
    3. 7.3 Asia-Pacific | | |
      1. 7.3.1 China | | |
      2. 7.3.2 India | | |
      3. 7.3.3 Japan | | |
      4. 7.3.4 South Korea | | |
      5. 7.3.5 ASEAN | | |
      6. 7.3.6 Rest of Asia-Pacific | |
    4. 7.4 South America | | |
      1. 7.4.1 Brazil | | |
      2. 7.4.2 Argentina | | |
      3. 7.4.3 Rest of South America | |
    5. 7.5 Middle East & Africa | | |
      1. 7.5.1 Saudi Arabia | | |
      2. 7.5.2 UAE | | |
      3. 7.5.3 South Africa | | |
      4. 7.5.4 Egypt | | |
      5. 7.5.5 Rest of MEA | |
  8. 8 Future Outlook (2026–2035) | |
    1. 8.1 Software-Defined Braking and Automated Driving | |
    2. 8.2 Connected Fleets and Predictive Maintenance Economics | |
    3. 8.3 The Electrification Supercycle | |
    4. 8.4 Sustainability and Brake Emission Accountability | |
  9. 9 Segmentation Analysis | |
    1. 9.1 By Function Type | | |
      1. 9.1.1 Hydraulic | | |
      2. 9.1.2 Pneumatic | | |
      3. 9.1.3 Electronic | |
    2. 9.2 By Material Type | | |
      1. 9.2.1 Steel | | |
      2. 9.2.2 Aluminum | | |
      3. 9.2.3 Brass | | |
      4. 9.2.4 Composite Materials | |
    3. 9.3 By Vehicle Type | | |
      1. 9.3.1 Passenger Vehicles | | |
      2. 9.3.2 Light Commercial Vehicles | | |
      3. 9.3.3 Medium and Heavy Commercial Vehicles | |
    4. 9.4 By Technology | | |
      1. 9.4.1 Conventional Braking Systems | | |
      2. 9.4.2 Anti-lock Braking Systems | | |
      3. 9.4.3 Regenerative Braking Systems | |
    5. 9.5 By Sales Channel | | |
      1. 9.5.1 OEM | | |
      2. 9.5.2 Aftermarket | |
  10. 10 Competitive Landscape | |
    1. 10.1 Market Concentration Analysis | |
    2. 10.2 Competitive Benchmarking Matrix | |
  11. 11 Recent News & Developments | |
  12. 12 Report Scope and Methodology | |
  13. 13 Detailed Sources and Citations | |
  14. 14 Frequently Asked Questions (FAQs) | | LIST OF TABLES | |
  15. TABLE 1 Market Snapshot – Key Metrics, 2025–2035 | |
  16. TABLE 2 Global Market Size & Forecast, by Revenue (USD Billion), 2021–2035 | |
  17. TABLE 3 Driver Impact Analysis | |
  18. TABLE 4 Restraints Impact Analysis | |
  19. TABLE 5 Regional Summary, 2025 | |
  20. TABLE 6 North America Market, by Country, 2025 | |
  21. TABLE 7 Europe Market, by Country, 2025 | |
  22. TABLE 8 Asia-Pacific Market, by Country, 2025 | |
  23. TABLE 9 South America Market, by Country, 2025 | |
  24. TABLE 10 Middle East & Africa Market, by Country, 2025 | |
  25. TABLE 11 Market Segmentation, by Function Type, 2025 | |
  26. TABLE 12 Market Segmentation, by Material Type, 2025 | |
  27. TABLE 13 Market Segmentation, by Vehicle Type, 2025 | |
  28. TABLE 14 Market Segmentation, by Technology, 2025 | |
  29. TABLE 15 Market Segmentation, by Sales Channel, 2025 | |
  30. TABLE 16 Competitive Benchmarking Matrix | |
  31. TABLE 17 Report Scope and Methodology | |
  32. TABLE 18 Detailed Sources and Citations | |
  33. TABLE 19 Segmentation Quick Reference | |
  34. TABLE 20 Function Type – Sub-Segment Key Trends | |
  35. TABLE 21 Material Type – Sub-Segment Key Trends | |
  36. TABLE 22 Vehicle Type – Sub-Segment Key Trends | |
  37. TABLE 23 Technology – Sub-Segment Key Trends | |
  38. TABLE 24 Sales Channel – Sub-Segment Key Trends | | LIST OF FIGURES | |
  39. FIGURE 1 Market Dynamics Overview – Drivers, Restraints and Opportunities | |
  40. FIGURE 2 Brake Valve Industry Value Chain Analysis | |
  41. FIGURE 3 Porter's Five Forces Analysis | |
  42. FIGURE 4 Global Market Size Trend, 2021–2035 (USD Billion) | |
  43. FIGURE 5 Market Share, by Function Type, 2025 | |
  44. FIGURE 6 Market Share, by Material Type, 2025 | |
  45. FIGURE 7 Market Share, by Vehicle Type, 2025 | |
  46. FIGURE 8 Market Share, by Technology, 2025 | |
  47. FIGURE 9 Market Share, by Sales Channel, 2025 | |
  48. FIGURE 10 Regional Market Share, 2025 | |
  49. FIGURE 11 Country-Level Share within Asia-Pacific, 2025 | |
  50. FIGURE 12 Competitive Positioning Matrix – Key Players | |
  51. FIGURE 13 Estimated Revenue Share Ranges of Leading Suppliers

Segmentation Quick Reference

DimensionSub-SegmentsDominant SegmentFastest Growing Segment
By Function TypeHydraulic, Pneumatic, ElectronicHydraulic (50.3% share)Electronic (9.5% CAGR)
By Material TypeSteel, Aluminum, Brass, Composite MaterialsSteel (66.5% share)Composite Materials (11.3% CAGR)
By Vehicle TypePassenger Vehicles, Light Commercial Vehicles, Medium and Heavy Commercial VehiclesPassenger Vehicles (61.3% share)Light Commercial Vehicles (8.3% CAGR)
By TechnologyConventional Braking Systems, Anti-lock Braking Systems, Regenerative Braking SystemsConventional Braking Systems (68.6% share)Regenerative Braking Systems (13.3% CAGR)
By Sales ChannelOEM, AftermarketOEM (83.7% share)Aftermarket (10.2% CAGR)
By RegionNorth America, Europe, Asia-Pacific, South America, Middle East & AfricaAsia-Pacific (44.3% share)Asia-Pacific (44.3% share)


Market Segmentation Overview

By Function Type

Sub-SegmentKey Trend
HydraulicCommoditization pressure as valves become parts of integrated modules
PneumaticElectronic control added for fleet management in heavy vehicles
ElectronicReal-time pressure control linked to ADAS and remote diagnostics


Hydraulic valves lead with a 50.3% share because fluid-based circuits remain standard in passenger cars. Electronic valves grow fastest at a 9.5% CAGR, as emergency braking mandates and ADAS integration require precise, software-controlled pressure modulation. Pneumatic valves hold steady in heavy trucks, where fail-safe operation outweighs the appeal of full electrification.

By Material Type

Sub-SegmentKey Trend
SteelCost leadership offset by tariff-driven input volatility
AluminumWider use in premium models seeking weight savings
BrassLimited to niche thermal and corrosion-resistant applications
Composite MaterialsCarbon fiber polymers enabling embedded sensors and lower mass


Steel dominates with a 66.5% share thanks to low cost and mature machining capacity. Composite Materials grow fastest at an 11.3% CAGR because EV range targets make every gram of valve housing weight matter. Aluminum occupies a middle ground in premium vehicles, while brass stays confined to specialized uses.

By Vehicle Type

Sub-SegmentKey Trend
Passenger VehiclesShift to one-box electro-hydraulic brake units
Light Commercial VehiclesHigh-utilization delivery fleets shortening replacement cycles
Medium and Heavy Commercial VehiclesPneumatic valves with added electronic control and redundancy


Passenger Vehicles lead with a 61.3% share on production volume alone. Light Commercial Vehicles grow fastest at an 8.3% CAGR, as stop-start delivery routes wear valves faster and fleet buyers favor diagnostics-enabled designs. Medium and Heavy Commercial Vehicles stay anchored to pneumatic valves, with autonomy trials adding demand for redundant architectures.

By Technology

Sub-SegmentKey Trend
Conventional Braking SystemsLarge installed base sustaining steady replacement demand
Anti-lock Braking SystemsUniversal fitment mandates across major markets
Regenerative Braking SystemsValves coordinating friction and energy recovery on EVs


Conventional Braking Systems hold a 68.6% share because combustion vehicles still dominate the fleet. Regenerative Braking Systems grow fastest at a 13.3% CAGR, since every hybrid and electric vehicle needs valves that blend friction braking with energy recovery. Anti-lock Braking Systems provide a stable, mandate-driven revenue base between the two.

By Sales Channel

Sub-SegmentKey Trend
OEMLong platform contracts with annual price-down clauses
AftermarketHigher replacement value from electronic valves and ageing fleets


The OEM channel leads with an 83.7% share, as brake valves are safety-critical parts installed at assembly under multi-year contracts. The Aftermarket grows faster at a 10.2% CAGR because electronic valves cost more to replace and fleets are keeping vehicles longer. Certified remanufacturing is emerging as a margin-rich bridge between the two channels.




Download PDF ×

We do not share your information with anyone. However, we may send you emails based on your report interest from time to time. You may contact us at any time to opt-out.