Automated Suturing Devices Market Segmentation
Automated Suturing Devices Market By Source (USD Billion, 2025-2035)
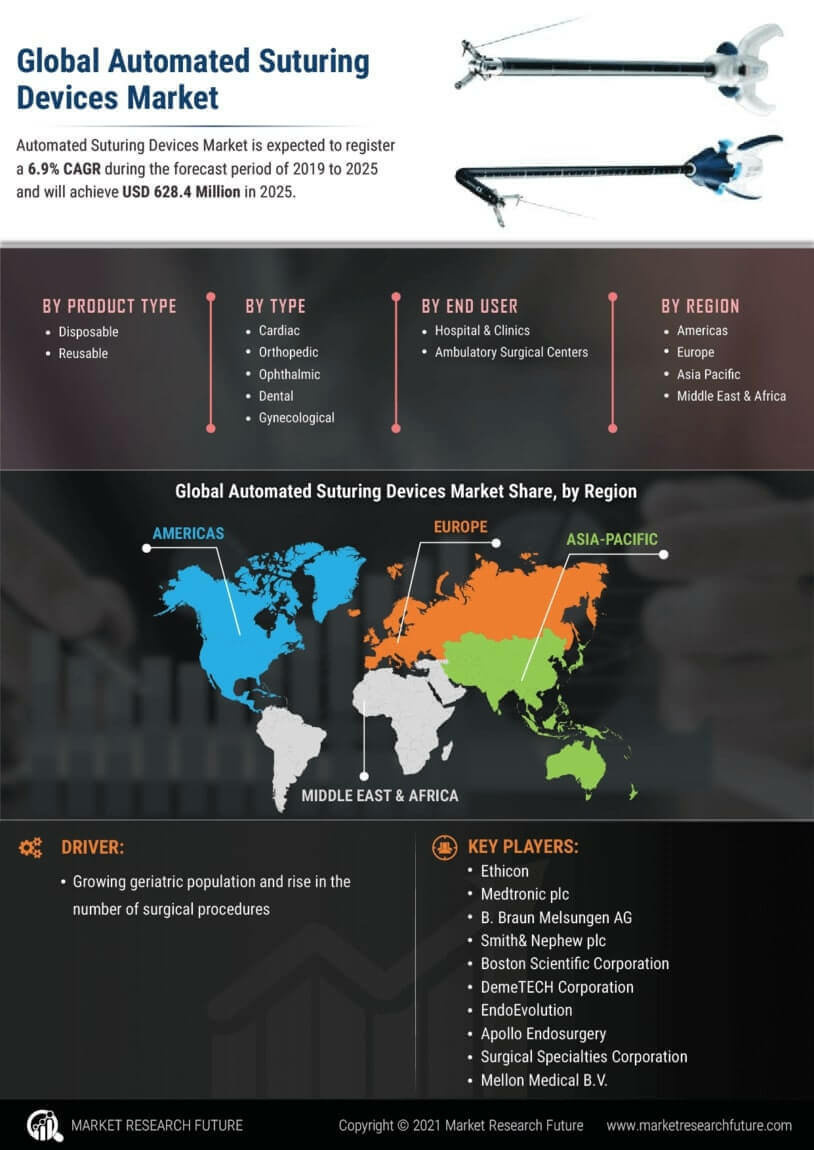
- Ethicon
- Smith and Nephew plc
- Medtronic plc
- EndoEvolution
- Apollo Endosurgery
- Others
Automated Suturing Devices Market By Product Type (USD Billion, 2025-2035)
- Disposable
- Reusable
Automated Suturing Devices Market By Application (USD Billion, 2025-2035)
- Gynecological
- Orthopedic
- Cardiovascular
- Ophthalmic
- Dental
- Others
Automated Suturing Devices Market By End Users (USD Billion, 2025-2035)
- Ambulatory/Outpatient Surgical Center
- Clinics and hospitals
- Others