ID: MRFR/MED/0700-HCR | February 2021 | Region: Global | 80 pages
Market Scenario
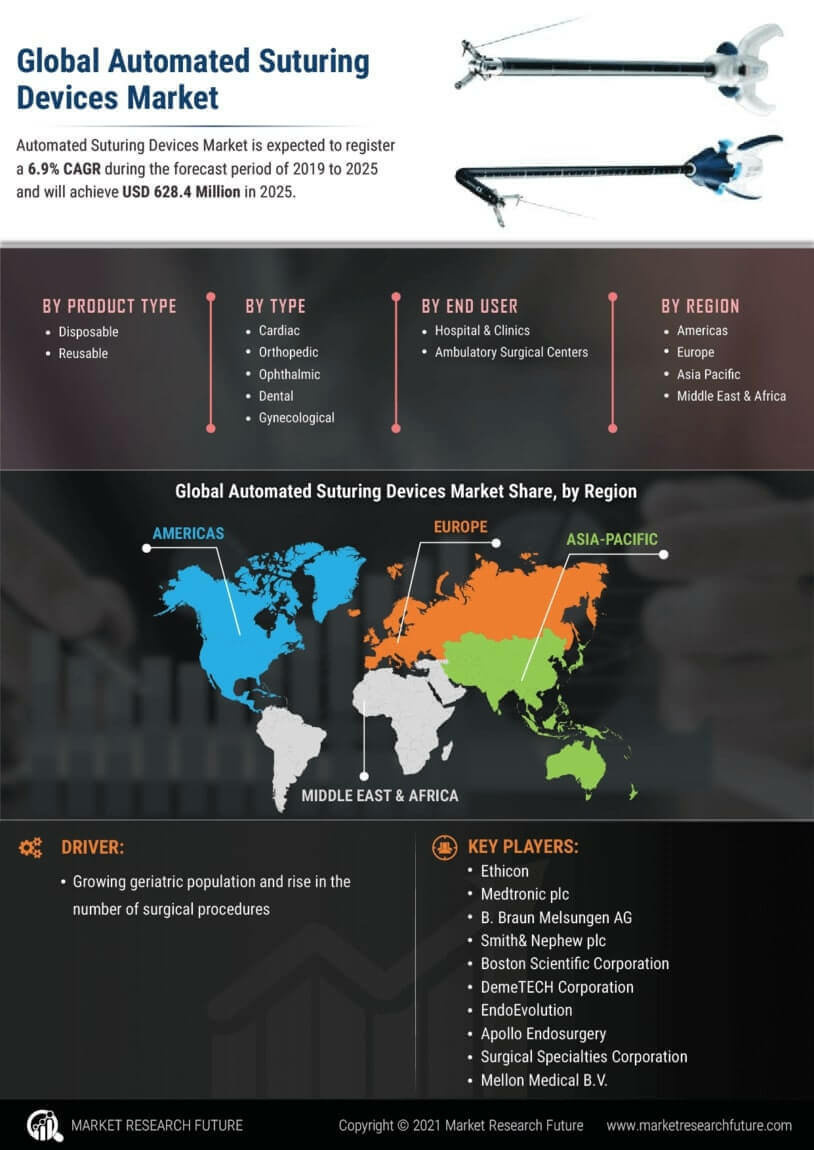
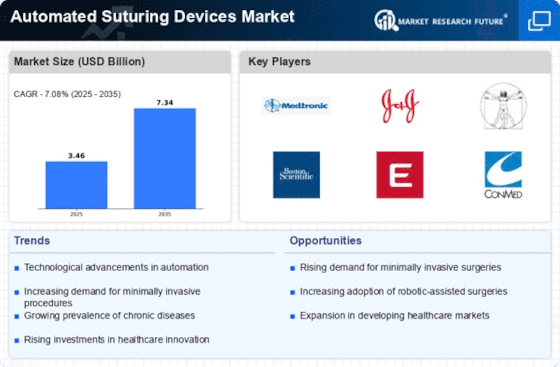
Automated Suturing Devices Market is expected to register a 6.9% CAGR during the forecast period of 2019 to 2025 and will achieve USD 628.4 Million in 2025. The market was valued at USD 475.8 Million in 2018.
Surgical sutures devices are used to close wounds or repair injuries. These devices have applications in ophthalmology, orthopedic, gynecology, cardiovascular surgery, orthopedic surgery, and laparoscopy, among others. Surgical suture devices can be automated or manually operated. Suture needles are primarily used for surgical site closure. Automated suture devices can be disposable or reusable. Disposable surgical suture devices are widely used because of safety concerns to the patient and prevention of surgical site infection.
Segmentation
The global automated suturing devices has been segmented based on type, application, and end use. The global market, based on type, has been divided into disposable and reusable. The reusable segment is expected to have the largest market as these devices are used in various surgeries and do not need to be disposed as medical waste after the completion of a single procedure.
The global market, based on application, has been classified into cardiac, orthopedic, ophthalmic, dental, and gynecological. Among this, the cardiac segment is expected to be the largest in terms of value due to the increasing number of geriatric individuals. Additionally, there are many cardiovascular surgeries being performed every day across the world, owing to the prevalence of cardiovascular diseases.
The global market, based on end use, has been segmented into hospitals & clinics, ambulatory surgical centers, and others. Hospitals & clinics are expected to be the largest end users of automated suturing devices and the segment is anticipated to hold a major share of the global market due to the increasing number of surgeries.
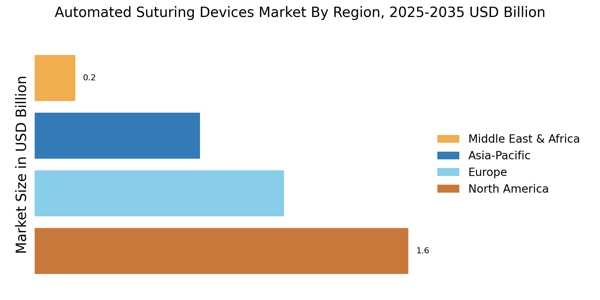
The market has been segmented by region into the Americas, Europe, Asia-Pacific, and the Middle East & Africa. The automated suturing devices in the Americas has further been segmented into North America and Latin America. Within North America, the market is been divided into the US and Canada. The European automated suturing devices market has been sub-divided into Western Europe and Eastern Europe. Western Europe has been classified as Germany, France, Italy, Spain, the UK, and the rest of Western Europe. The automated suturing devices market in Asia-Pacific has been segmented into Japan, China, India, South Korea, and Australia. The automated suturing devices market in the Middle East & Africa has been divided into the Middle East and Africa.
Key Players
The key players in the global automated suturing devices are Ethicon, Inc., Medtronic plc, B. Braun Melsungen AG, Smith& Nephew plc, Boston Scientific Corporation, DemeTECH Corporation, EndoEvolution, LLC., Apollo Endosurgery, Inc., Surgical Specialties Corporation, and Mellon Medical B.V.
Regional Market Summary
Global Automated Suturing Devices Share (%), by Region, 2018
Source: World Health Organization (WHO) and Institute of Medicine (IOM)
The market in the Americas is projected to have a steady growth rate during the forecast period owing to the growing geriatric population and rise in the number of surgical procedures. Moreover, there is an increase in the adoption rate of minimally invasive procedures, driving the growth of automated suturing devices in this region.
The market in Europe is expected to register a significant growth rate. The market growth in this region can be attributed to the huge patient pool and rising demand for automated suturing devices in minimally invasive surgeries. Moreover, there is a rise in the number of surgical procedures and increased incidences of trauma cases, which is driving the growth of the automated suturing devices market in this region.
The market in Asia-Pacific is expected to register the fastest growth in the global automated suturing devices market due to the increase in the medical tourism industry, rising prevalence of chronic diseases, and favorable reimbursement scenario.
The market in Middle East & Africa is expected to grow at a substantial rate due to the increase in demand for surgical treatments for diseases such as cardiovascular, orthopedic, and dental in the region.
Global Automated Suturing Devices Market, by Type
Global Automated Suturing Devices Market, by Application
Global Automated Suturing Devices Market, by End-Use
Global Automated Suturing Devices Market, by Region
Intended Audience
Frequently Asked Questions (FAQ) :
The Automated Suturing Devices Market valuation in 2018 was USD 475.8 million.
Automated Suturing Devices Market is Expected CAGR is 6.9% during the forecast period of 2019-2025.
Automated Suturing Devices Market would reach USD 628.4 million by 2025.
The reusable segment would dominate.
The cardiac segment would lead.
TABLE OF CONTENTS
1. REPORT PROLOGUE
2. MARKET INTRODUCTION
2.1. Definition
2.2. Scope of the Study
2.2.1. Research Objective
2.2.2. Assumptions
2.2.3. Limitations
3. RESEARCH METHODOLOGY
3.1. Overview
3.2. Primary Research
3.3. Secondary Research
3.4. Market Size Estimation
4. MARKET DYNAMICS
4.1. Overview
4.2. Drivers
4.3. Restraints
4.4. Opportunities
5. MARKET FACTOR ANALYSIS
5.1. Porter’s Five Forces Analysis
5.1.1. Bargaining Power of Suppliers
5.1.2. Bargaining Power of Buyers
5.1.3. Threat of New Entrants
5.1.4. Threat of Substitutes
5.1.5. Intensity of Rivalry
5.2. Value Chain Analysis
6. GLOBAL AUTOMATED SUTURING DEVICES MARKET, BY TYPE
6.1. Overview
6.2. Disposable
Market Estimates & Forecast, by Region, 2019–2025
Market Estimates & Forecast, by Country, 2019–2025
6.3. Reusable
Market Estimates & Forecast, by Region, 2019–2025
Market Estimates & Forecast, by Country, 2019–2025
7. GLOBAL AUTOMATED SUTURING DEVICES MARKET, BY APPLICATION
7.1. Overview
7.2. Cardiac
Market Estimates & Forecast, by Region, 2019–2025
Market Estimates & Forecast, by Country, 2019–2025
7.3. Orthopedic
Market Estimates & Forecast, by Region, 2019–2025
Market Estimates & Forecast, by Country, 2019–2025
7.4. Ophthalmic
Market Estimates & Forecast, by Region, 2019–2025
Market Estimates & Forecast, by Country, 2019–2025
7.5. Dental
Market Estimates & Forecast, by Region, 2019–2025
Market Estimates & Forecast, by Country, 2019–2025
7.6. Gynecological
Market Estimates & Forecast, by Region, 2019–2025
Market Estimates & Forecast, by Country, 2019–2025
7.7. Others
Market Estimates & Forecast, by Region, 2019–2025
Market Estimates & Forecast, by Country, 2019–2025
8. GLOBAL AUTOMATED SUTURING DEVICES MARKET, BY END USE
8.1. Overview
8.2. Hospitals & Clinics
Market Estimates & Forecast, by Region, 2019–2025
Market Estimates & Forecast, by Country, 2019–2025
8.3. Ambulatory Surgical Centres
Market Estimates & Forecast, by Region, 2019–2025
Market Estimates & Forecast, by Country, 2019–2025
8.4. Others
Market Estimates & Forecast, by Region, 2019–2025
Market Estimates & Forecast, by Country, 2019–2025
9. GLOBAL AUTOMATED SUTURING DEVICES MARKET, BY REGION
9.1. Overview
9.2. Americas
9.2.1. North America
9.2.1.1. US
9.2.1.2. Canada
9.2.2. Latin America
9.3. Europe
9.3.1. Western Europe
9.3.1.1. Germany
9.3.1.2. France
9.3.1.3. Italy
9.3.1.4. Spain
9.3.1.5. UK
9.3.1.6. Rest of Western Europe
9.3.2. Eastern Europe
9.4. Asia-Pacific
9.4.1. Japan
9.4.2. China
9.4.3. India
9.4.4. Australia
9.4.5. South Korea
9.4.6. Rest of Asia-Pacific
9.5. Middle East & Africa
9.5.1. Middle East
9.5.2. Africa
10. COMPANY LANDSCAPE
10.1. Overview
10.2. Competitive Analysis
10.3. Market Share Analysis
10.4. Major Growth Strategy in the Global Automated Suturing Devices Market
10.5. Competitive Benchmarking
10.6. Leading Players in terms of Number of Developments in the Global Automated Suturing Devices Market
10.7. Key Developments and Growth Strategies
10.7.1. Product Launch/Service Deployment
10.7.2. Mergers and Acquisitions
10.7.3. Joint Ventures
10.8. Major Players Financial Matrix & Market Ratio
10.8.1. Sales & Operating Income 2018
10.8.2. Major Players R&D Expenditure 2018
10.9. Major Players Capital Market Ratio
11. COMPANY PROFILES
11.1. Ethicon, Inc.
11.1.1. Company Overview
11.1.2. Product Overview
11.1.3. Financial Overview
11.1.4. Key Developments
11.1.5. SWOT Analysis
11.1.6. Key Strategies
11.2. Medtronic plc
11.2.1. Company Overview
11.2.2. Product Overview
11.2.3. Financial Overview
11.2.4. Key Developments
11.2.5. SWOT Analysis
11.2.6. Key Strategies
11.3. B. Braun Melsungen AG
11.3.1. Company Overview
11.3.2. Product Overview
11.3.3. Financial Overview
11.3.4. Key Developments
11.3.5. SWOT Analysis
11.3.6. Key Strategies
11.4. Smith& Nephew plc
11.4.1. Company Overview
11.4.2. Product Overview
11.4.3. Financial Overview
11.4.4. Key Developments
11.4.5. SWOT Analysis
11.4.6. Key Strategies
11.5. Apollo Endosurgery, Inc.
11.5.1. Company Overview
11.5.2. Product Overview
11.5.3. Financial Overview
11.5.4. Key Developments
11.5.5. SWOT Analysis
11.5.6. Key Strategies
11.6. DemeTECH Corporation
11.6.1. Company Overview
11.6.2. Product Overview
11.6.3. Financial Overview
11.6.4. Key Developments
11.6.5. SWOT Analysis
11.6.6. Key Strategies
11.7. EndoEvolution, LLC.
11.7.1. Company Overview
11.7.2. Product Overview
11.7.3. Financial Overview
11.7.4. Key Developments
11.7.5. SWOT Analysis
11.7.6. Key Strategies
11.8. Apollo Endosurgery, Inc.
11.8.1. Company Overview
11.8.2. Product Overview
11.8.3. Financial Overview
11.8.4. Key Developments
11.8.5. SWOT Analysis
11.8.6. Key Strategies
11.9. Surgical Specialties Corporation
11.9.1. Company Overview
11.9.2. Product Overview
11.9.3. Financial Overview
11.9.4. Key Developments
11.9.5. SWOT Analysis
11.9.6. Key Strategies
11.10. Mellon Medical B.V.
11.10.1. Company Overview
11.10.2. Product Overview
11.10.3. Financial Overview
11.10.4. Key Developments
11.10.5. SWOT Analysis
11.10.6. Key Strategies
12. APPENDIX
12.1. References
12.2. Related Reports
LIST OF TABLES
TABLE 1 GLOBAL AUTOMATED SUTURING DEVICES MARKET SYNOPSIS, 2019–2025
TABLE 2 GLOBAL AUTOMATED SUTURING DEVICES MARKET ESTIMATES & FORECAST, 2019–2025 (USD MILLION)
TABLE 3 GLOBAL AUTOMATED SUTURING DEVICES MARKET, BY TYPE, 2019–2025 (USD MILLION)
TABLE 4 TABLE 3 GLOBAL AUTOMATED SUTURING DEVICES MARKET, BY APPLICATION, 2019–2025 (USD MILLION)
TABLE 5 GLOBAL AUTOMATED SUTURING DEVICES MARKET, BY END USE, 2019–2025 (USD MILLION)
TABLE 6 GLOBAL AUTOMATED SUTURING DEVICES MARKET, BY REGION, 2019–2025 (USD MILLION)
TABLE 7 NORTH AMERICA: AUTOMATED SUTURING DEVICES MARKET, BY TYPE, 2019–2025 (USD MILLION)
TABLE 8 NORTH AMERICA: AUTOMATED SUTURING DEVICES MARKET, BY APPLICATION, 2019–2025 (USD MILLION)
TABLE 9 NORTH AMERICA: AUTOMATED SUTURING DEVICES MARKET, BY END USE, 2019–2025 (USD MILLION)
TABLE 10 US: AUTOMATED SUTURING DEVICES MARKET, BY TYPE, 2019–2025 (USD MILLION)
TABLE 11 US: AUTOMATED SUTURING DEVICES MARKET, BY APPLICATION, 2019–2025 (USD MILLION)
TABLE 12 US: AUTOMATED SUTURING DEVICES MARKET, BY END USE, 2019–2025 (USD MILLION)
TABLE 13 CANADA: AUTOMATED SUTURING DEVICES MARKET, BY TYPE, 2019–2025 (USD MILLION)
TABLE 14 CANADA: AUTOMATED SUTURING DEVICES MARKET, BY APPLICATION, 2019–2025 (USD MILLION)
TABLE 15 CANADA: AUTOMATED SUTURING DEVICES MARKET, BY END USE, 2019–2025 (USD MILLION)
TABLE 16 LATIN AMERICA: AUTOMATED SUTURING DEVICES MARKET, BY TYPE, 2019–2025 (USD MILLION)
TABLE 17 LATIN AMERICA: AUTOMATED SUTURING DEVICES MARKET, BY APPLICATION, 2019–2025 (USD MILLION)
TABLE 18 LATIN AMERICA: AUTOMATED SUTURING DEVICES MARKET, BY END USE, 2019–2025 (USD MILLION)
TABLE 19 EUROPE: AUTOMATED SUTURING DEVICES MARKET, BY TYPE, 2019–2025 (USD MILLION)
TABLE 20 EUROPE: AUTOMATED SUTURING DEVICES MARKET, BY APPLICATION, 2019–2025 (USD MILLION)
TABLE 21 EUROPE: AUTOMATED SUTURING DEVICES MARKET, BY END USE, 2019–2025 (USD MILLION)
TABLE 22 WESTERN EUROPE: AUTOMATED SUTURING DEVICES MARKET, BY TYPE, 2019–2025 (USD MILLION)
TABLE 23 WESTERN EUROPE: AUTOMATED SUTURING DEVICES MARKET, BY APPLICATION, 2019–2025 (USD MILLION)
TABLE 24 WESTERN EUROPE: AUTOMATED SUTURING DEVICES MARKET, BY END USE, 2019–2025 (USD MILLION)
TABLE 25 EASTERN EUROPE: AUTOMATED SUTURING DEVICES MARKET, BY TYPE, 2019–2025 (USD MILLION)
TABLE 26 EASTERN EUROPE: AUTOMATED SUTURING DEVICES MARKET, BY APPLICATION, 2019–2025 (USD MILLION)
TABLE 27 EASTERN EUROPE: AUTOMATED SUTURING DEVICES MARKET, BY END USE, 2019–2025 (USD MILLION)
TABLE 28 ASIA-PACIFIC: AUTOMATED SUTURING DEVICES MARKET, BY TYPE, 2019–2025 (USD MILLION)
TABLE 29 ASIA-PACIFIC: AUTOMATED SUTURING DEVICES MARKET, BY APPLICATION, 2019–2025 (USD MILLION)
TABLE 30 ASIA-PACIFIC: AUTOMATED SUTURING DEVICES MARKET, BY END USE, 2019–2025 (USD MILLION)
TABLE 31 MIDDLE EAST & AFRICA: AUTOMATED SUTURING DEVICES MARKET, BY TYPE, 2019–2025 (USD MILLION)
TABLE 32 MIDDLE EAST & AFRICA: AUTOMATED SUTURING DEVICES MARKET, BY APPLICATION, 2019–2025 (USD MILLION)
TABLE 33 MIDDLE EAST & AFRICA: AUTOMATED SUTURING DEVICES MARKET, BY END USE, 2019–2025 (USD MILLION)
LIST OF FIGURES
FIGURE 1 RESEARCH PROCESS
FIGURE 2 MARKET STRUCTURE FOR THE GLOBAL AUTOMATED SUTURING DEVICES MARKET
FIGURE 3 MARKET DYNAMICS FOR THE GLOBAL AUTOMATED SUTURING DEVICES MARKET
FIGURE 4 GLOBAL AUTOMATED SUTURING DEVICES MARKET SHARE, BY TYPE, 2018 (%)
FIGURE 5 GLOBAL AUTOMATED SUTURING DEVICES MARKET SHARE, BY APPLICATION, 2018 (%)
FIGURE 6 GLOBAL AUTOMATED SUTURING DEVICES MARKET SHARE, BY END USE, 2018 (%)
FIGURE 7 GLOBAL AUTOMATED SUTURING DEVICES MARKET SHARE, BY REGION, 2018 (%)
FIGURE 8 AMERICAS: AUTOMATED SUTURING DEVICES MARKET SHARE BY REGION, 2018 (%)
FIGURE 9 NORTH AMERICA: AUTOMATED SUTURING DEVICES MARKET SHARE, BY COUNTRY, 2018 (%)
FIGURE 10 EUROPE: AUTOMATED SUTURING DEVICES MARKET SHARE, BY REGION, 2018 (%)
FIGURE 11 WESTERN EUROPE: AUTOMATED SUTURING DEVICES MARKET SHARE, BY COUNTRY, 2018 (%)
FIGURE 12 ASIA-PACIFIC: AUTOMATED SUTURING DEVICES MARKET SHARE, BY COUNTRY, 2018 (%)
FIGURE 13 MIDDLE EAST & AFRICA: AUTOMATED SUTURING DEVICES MARKET SHARE, BY COUNTRY, 2018 (%)
FIGURE 14 GLOBAL AUTOMATED SUTURING DEVICES MARKET: COMPANY SHARE ANALYSIS, 2018 (%)
FIGURE 15 ETHICON, INC.: KEY FINANCIALS
FIGURE 16 ETHICON, INC.: SEGMENTAL REVENUE
FIGURE 17 ETHICON, INC.: REGIONAL REVENUE
FIGURE 18 MEDTRONIC PLC: KEY FINANCIALS
FIGURE 19 MEDTRONIC PLC: SEGMENTAL REVENUE
FIGURE 20 MEDTRONIC PLC: REGIONAL REVENUE
FIGURE 21 B. BRAUN MELSUNGEN AG: KEY FINANCIALS
FIGURE 22 B. BRAUN MELSUNGEN AG: SEGMENTAL REVENUE
FIGURE 23 B. BRAUN MELSUNGEN AG: REGIONAL REVENUE
FIGURE 24 SMITH& NEPHEW PLC: KEY FINANCIALS
FIGURE 25 SMITH& NEPHEW PLC: SEGMENTAL REVENUE
FIGURE 26 SMITH& NEPHEW PLC: REGIONAL REVENUE
FIGURE 27 BOSTON SCIENTIFIC CORPORATION: KEY FINANCIALS
FIGURE 28 BOSTON SCIENTIFIC CORPORATION: SEGMENTAL REVENUE
FIGURE 29 BOSTON SCIENTIFIC CORPORATION: REGIONAL REVENUE
FIGURE 30 ENDOEVOLUTION, LLC: KEY FINANCIALS
FIGURE 31 ENDOEVOLUTION, LLC: SEGMENTAL REVENUE
FIGURE 32 ENDOEVOLUTION, LLC: REGIONAL REVENUE
FIGURE 33 APOLLO ENDOSURGERY, INC.: KEY FINANCIALS
FIGURE 34 APOLLO ENDOSURGERY, INC.: SEGMENTAL REVENUE
FIGURE 35 APOLLO ENDOSURGERY, INC.: REGIONAL REVENUE
FIGURE 36 SURGICAL SPECIALTIES CORPORATION: KEY FINANCIALS
FIGURE 37 SURGICAL SPECIALTIES CORPORATION: SEGMENTAL REVENUE
FIGURE 38 SURGICAL SPECIALTIES CORPORATION: REGIONAL REVENUE
FIGURE 39 MELLON MEDICAL B.V.: KEY FINANCIALS
FIGURE 40 MELLON MEDICAL B.V.: SEGMENTAL REVENUE
FIGURE 41 MELLON MEDICAL B.V.: REGIONAL REVENUE