Automated Infrastructure Management (AIM) Solutions Market Segmentation
Automated Infrastructure Management (AIM) Solutions Market By Application (USD Billion, 2025-2035)
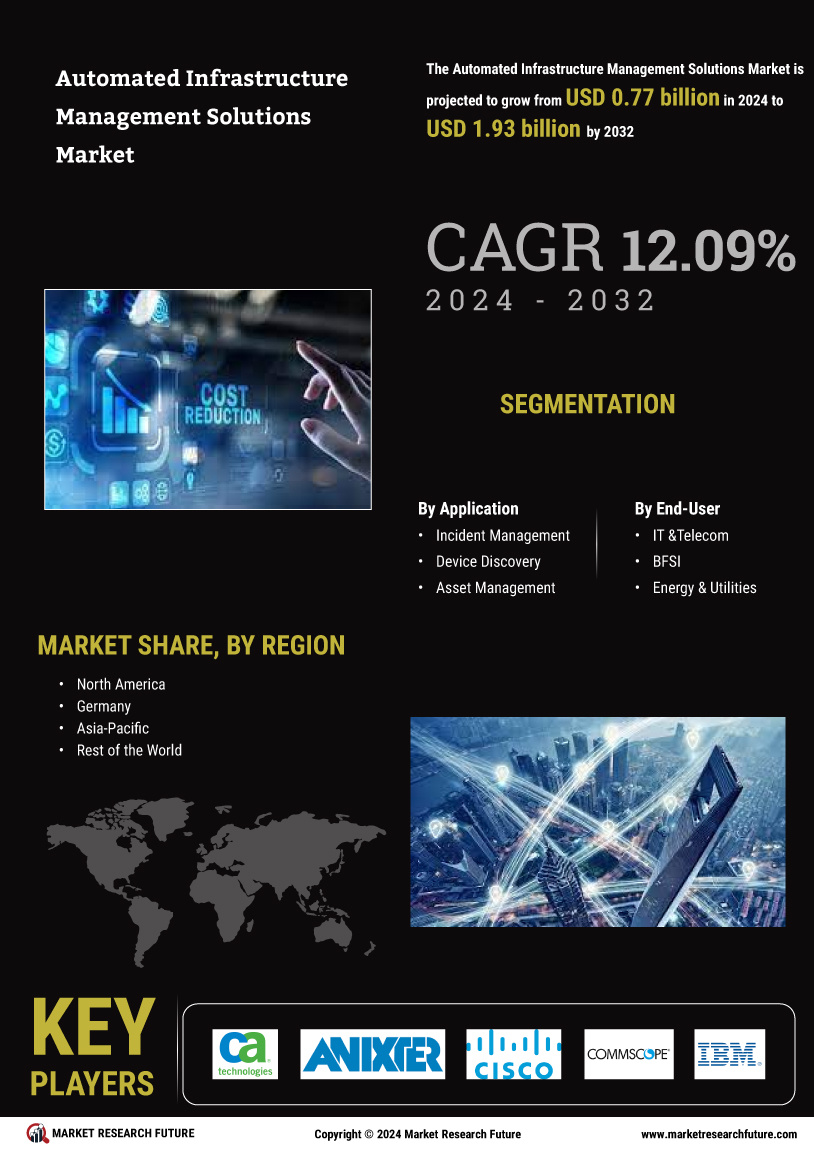
- Incident Management
- Device Discovery
- Asset Management
Automated Infrastructure Management (AIM) Solutions Market By End-User (USD Billion, 2025-2035)
- IT & Telecom
- BFSI
- Energy & Utilities
- Government
- Manufacturing
- Colocation Data Centers