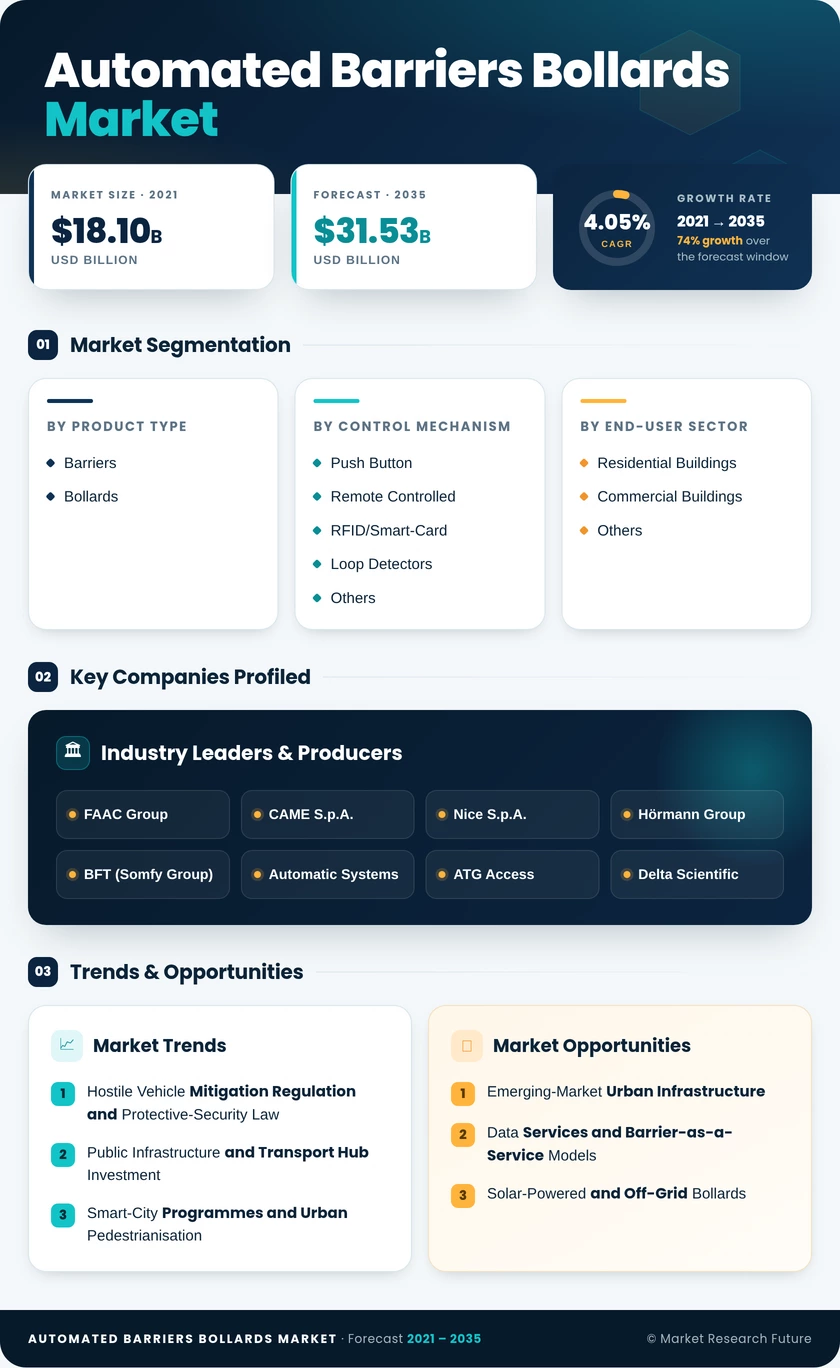
Automated Barriers Bollards Market (2026 - 2035)

ID: MRFR/PCM/39730-HCR 111 Pages Snehal Singh Last Updated: November 06, 2026
Automated Barriers and Bollards Market Research Report Information By Product Type (Barriers and Bollards), By Control Mechanism (Push Button, Remote Controlled, RFID/Smart-Card, Loop Detectors, and Others (Biometric and Mobile-App Control)), By End-User Sector (Residential Buildings, Commercial Buildings, and Others (Tourism Districts, Education, Healthcare, and Government)), And By Region (North America, Europe, Asia-Pacific, and Rest of the World) – Market Forecast Till 2035.
Automated Barriers Bollards Market
Market Size
Forecast Period2026-2035
CAGR (2026-2035)4.05%
2025 Market SizeUSD 21.20 Billion
2035 Market SizeUSD 31.53 Billion
Key Players
FAAC Group
CAME S.p.A.
Nice S.p.A.
Hörmann Group
BFT
Automatic Systems
Opportunities
  • Emerging-Market Urban Infrastructure
  • Data Services and Barrier-as-a-Service Models
  • Solar-Powered and Off-Grid Bollards
  1. 1 Market Summary | |
  2. 2 Key Report Takeaways | |
    1. 2.1 By Product Type | |
    2. 2.2 By Control Mechanism | |
    3. 2.3 By End-User Sector | |
    4. 2.4 By Region | |
  3. 3 Market Size and Forecast (2021–2035) | |
    1. 3.1 Historical Market Size (2021–2025) | |
    2. 3.2 Forecast Market Size (2026–2035) | |
    3. 3.3 Year-over-Year Growth Analysis | |
  4. 4 Driver Impact Analysis | |
    1. 4.1 Hostile Vehicle Mitigation Regulation and Protective-Security Law | |
    2. 4.2 Public Infrastructure and Transport Hub Investment | |
    3. 4.3 Smart-City Programmes and Urban Pedestrianisation | |
    4. 4.4 Growth in Automated Parking and Toll Operations | |
    5. 4.5 Harmonised Crash-Test Standards | |
    6. 4.6 Gulf Giga-Projects and Major Event Venues | |
    7. 4.7 Labour Savings From Unattended Entry Points | |
  5. 5 Restraints Impact Analysis | |
    1. 5.1 High Installed Cost of Crash-Rated Systems | |
    2. 5.2 Civil Works and Underground Utility Conflicts | |
    3. 5.3 Maintenance Burden of Hydraulic Units | |
    4. 5.4 Machinery Safety Compliance and Liability | |
    5. 5.5 Price Competition From Low-Cost Uncertified Products | |
  6. 6 Opportunities | |
    1. 6.1 Emerging-Market Urban Infrastructure | |
    2. 6.2 Data Services and Barrier-as-a-Service Models | |
    3. 6.3 Solar-Powered and Off-Grid Bollards | |
    4. 6.4 Retrofit of First-Generation Hydraulic Installations | |
    5. 6.5 Event and Temporary Rapid-Deployment Systems | |
  7. 7 Regional Market Share and Country-Level Analysis | |
    1. 7.1 North America | | |
      1. 7.1.1 United States | | |
      2. 7.1.2 Canada | | |
      3. 7.1.3 Mexico | |
    2. 7.2 Europe | | |
      1. 7.2.1 Germany | | |
      2. 7.2.2 UK | | |
      3. 7.2.3 France | | |
      4. 7.2.4 Italy | | |
      5. 7.2.5 Spain | | |
      6. 7.2.6 Nordic Countries | | |
      7. 7.2.7 Russia | | |
      8. 7.2.8 Rest of Europe | |
    3. 7.3 Asia-Pacific | | |
      1. 7.3.1 China | | |
      2. 7.3.2 India | | |
      3. 7.3.3 Japan | | |
      4. 7.3.4 South Korea | | |
      5. 7.3.5 ASEAN | | |
      6. 7.3.6 Rest of Asia-Pacific | |
    4. 7.4 South America | | |
      1. 7.4.1 Brazil | | |
      2. 7.4.2 Argentina | | |
      3. 7.4.3 Rest of South America | |
    5. 7.5 Middle East and Africa | | |
      1. 7.5.1 Saudi Arabia | | |
      2. 7.5.2 UAE | | |
      3. 7.5.3 South Africa | | |
      4. 7.5.4 Egypt | | |
      5. 7.5.5 Rest of Middle East and Africa | |
  8. 8 Future Outlook (2026–2035) | |
    1. 8.1 AI-Enabled Vehicle Recognition and Autonomous Gate Control | |
    2. 8.2 Electromechanical Replacement of Hydraulic Drives | |
    3. 8.3 Urbanisation and the Car-Light City | |
    4. 8.4 Sustainability and Whole-Life Reporting | |
  9. 9 Segmentation Analysis | |
    1. 9.1 By Product Type | | |
      1. 9.1.1 Barriers | | |
      2. 9.1.2 Bollards | |
    2. 9.2 By Control Mechanism | | |
      1. 9.2.1 Push Button | | |
      2. 9.2.2 Remote Controlled | | |
      3. 9.2.3 RFID/Smart-Card | | |
      4. 9.2.4 Loop Detectors | | |
      5. 9.2.5 Others | |
    3. 9.3 By End-User Sector | | |
      1. 9.3.1 Residential Buildings | | |
      2. 9.3.2 Commercial Buildings | | |
      3. 9.3.3 Others | |
  10. 10 Competitive Landscape | |
    1. 10.1 Market Concentration Analysis | |
    2. 10.2 Competitive Benchmarking Table | |
    3. 10.3 Company Profiles | | |
      1. 10.3.1 FAAC Group | | |
      2. 10.3.2 CAME S.p.A. | | |
      3. 10.3.3 Nice S.p.A. | | |
      4. 10.3.4 Hörmann Group | | |
      5. 10.3.5 BFT | | |
      6. 10.3.6 Automatic Systems | | |
      7. 10.3.7 ATG Access | | |
      8. 10.3.8 Delta Scientific | | |
      9. 10.3.9 Avon Barrier | | |
      10. 10.3.10 Frontier Pitts | | |
      11. 10.3.11 Macs Automated Bollard Systems | |
  11. 11 Recent News & Developments | |
  12. 12 Report Scope and Methodology | |
  13. 13 Detailed Sources and Citations | |
  14. 14 Frequently Asked Questions (FAQs) | | LIST OF TABLES | |
  15. TABLE 1 Global Market Size and Forecast, by Revenue (USD Billion), 2021–2035 | |
  16. TABLE 2 Driver Impact Analysis | |
  17. TABLE 3 Restraints Impact Analysis | |
  18. TABLE 4 Global Market Size, by Region, 2025 | |
  19. TABLE 5 North America Market Size, by Country, 2025 | |
  20. TABLE 6 Europe Market Size, by Country, 2025 | |
  21. TABLE 7 Asia-Pacific Market Size, by Country, 2025 | |
  22. TABLE 8 South America Market Size, by Country, 2025 | |
  23. TABLE 9 Middle East and Africa Market Size, by Country, 2025 | |
  24. TABLE 10 Global Market Size, by Product Type, 2025 | |
  25. TABLE 11 Global Market Size, by Control Mechanism, 2025 | |
  26. TABLE 12 Global Market Size, by End-User Sector, 2025 | |
  27. TABLE 13 Competitive Benchmarking Table | |
  28. TABLE 14 Report Scope and Methodology | |
  29. TABLE 15 Detailed Sources and Citations | |
  30. TABLE 16 Segmentation Quick Reference | | LIST OF FIGURES | |
  31. FIGURE 1 Market Dynamics Overview — Drivers, Restraints and Opportunities | |
  32. FIGURE 2 Industry Value Chain Analysis | |
  33. FIGURE 3 Porter's Five Forces Analysis | |
  34. FIGURE 4 Global Market Size Trend, 2021–2035 (USD Billion) | |
  35. FIGURE 5 Market Share, by Product Type, 2025 | |
  36. FIGURE 6 Market Share, by Control Mechanism, 2025 | |
  37. FIGURE 7 Market Share, by End-User Sector, 2025 | |
  38. FIGURE 8 Market Share, by Region, 2025 | |
  39. FIGURE 9 Competitive Landscape — Estimated Revenue Share of Key Players, 2025

Segmentation Quick Reference

DimensionSub-SegmentsDominant SegmentFastest Growing Segment
By Product TypeBarriers, BollardsBarriers (57.0% share)Bollards (5.1% CAGR)
By Control MechanismPush Button, Remote Controlled, RFID/Smart-Card, Loop Detectors, OthersRemote Controlled (46.1% share)Loop Detectors (5.3% CAGR)
By End-User SectorResidential Buildings, Commercial Buildings, OthersCommercial Buildings (46.0% share)Others (5.5% CAGR)
By RegionNorth America, Europe, Asia-Pacific, South America, Middle East and AfricaEurope (34.0% share)Asia-Pacific (5.6% CAGR)

Market Segmentation Overview

By Product Type

Sub-SegmentKey Trend
BarriersHigh-duty motors and plate-recognition integration at parking, toll and logistics lanes
BollardsShift to crash-rated, electromechanical and solar-powered units in pedestrianised zones.

Barriers lead with a 57.0% share because almost every parking lane, toll point and truck gate needs a fast-cycling arm linked to ticketing or plate recognition. Bollards grow fastest at a 5.1% CAGR as cities protect pedestrian areas with retractable, crash-tested units that sit flush when lowered. Bollards are harder to engineer, which keeps prices firm for certified suppliers.

By Control Mechanism

Sub-SegmentKey Trend
Push ButtonLow-cost, reliable control for small residential and commercial sites
Remote ControlledCentralised control-room management of multiple gates
RFID/Smart-CardCredential-based entry with audit trails for compliance
Loop DetectorsAutomatic vehicle detection that removes staff from entry lanes
OthersBiometric and mobile-app control in premium installations

Remote Controlled systems lead with a 46.1% share because campus and commercial operators want one control room to run many entry points. Loop Detectors grow fastest at a 5.3% CAGR, since embedded sensors let lanes run unattended and cut guard costs. RFID/Smart-Card use is rising where audit trails are needed, and Push Button still suits small sites.

By End-User Sector

Sub-SegmentKey Trend
Residential BuildingsAdoption concentrated in gated communities and premium apartment complexes
Commercial BuildingsIntegration with building management and access platforms
OthersUptake in tourism districts, education, healthcare and government facilities

Commercial Buildings lead with a 46.0% share because offices, retail centres and industrial sites have larger security budgets and link entry control to building systems. Others grow fastest at a 5.5% CAGR as tourism districts, hospitals and universities adopt automated entry, often with solar-powered bollards where grid power is limited. Residential Buildings remain stable, but cost limits their growth.


Download PDF ×

We do not share your information with anyone. However, we may send you emails based on your report interest from time to time. You may contact us at any time to opt-out.