Request Free Sample ×

Kindly complete the form below to receive a free sample of this Report

* Please use a valid business email

Leading companies partner with us for data-driven Insights

clients tt-cursor
Hero Background

Astaxanthin Market

ID: MRFR/FnB/3406-CR
110 Pages
Snehal Singh
Last Updated: May 25, 2026

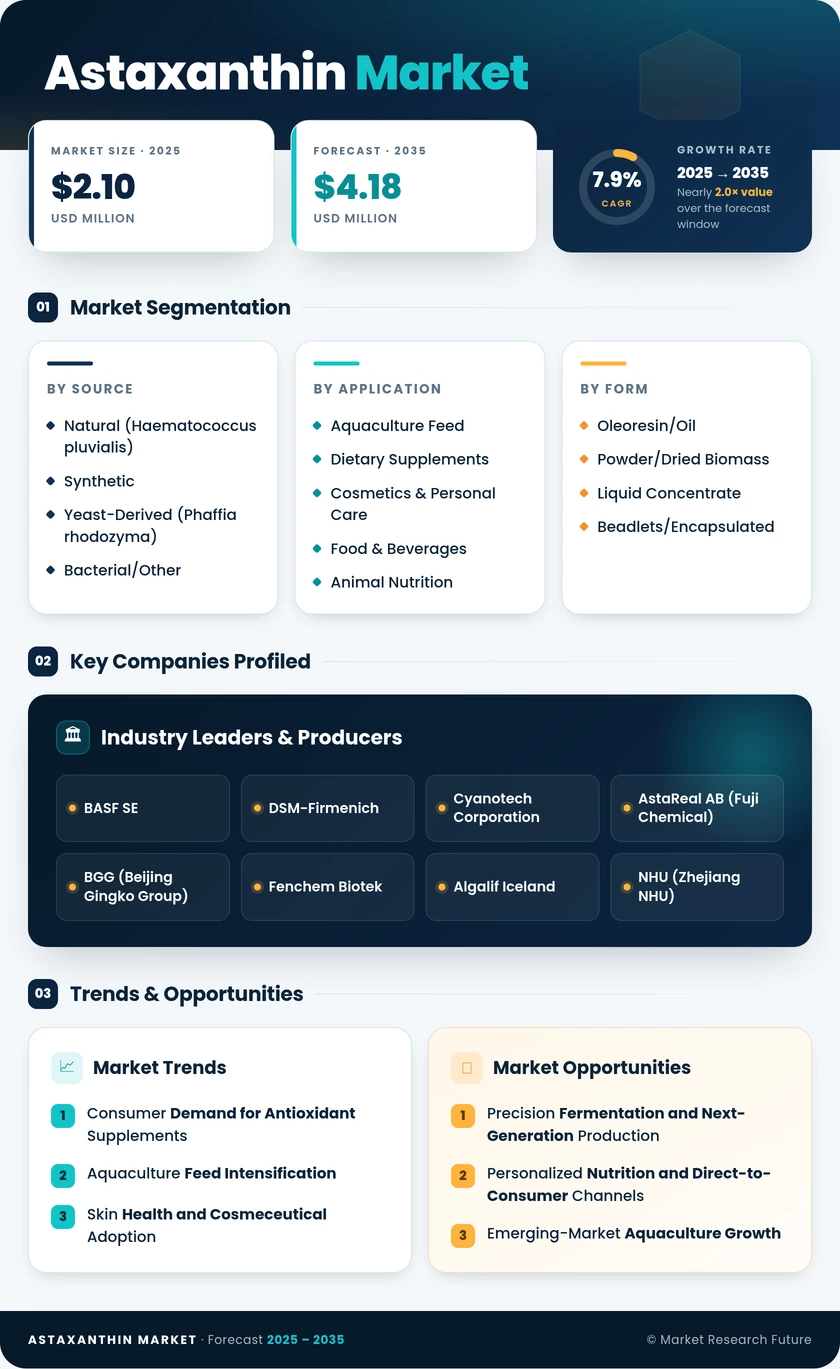
Astaxanthin Market Size, Share, Industry Trend & Analysis Research Report Information By Source (Natural, Synthetic, Yeast-Derived, Bacterial/Other), By Application (Aquaculture Feed, Dietary Supplements, Cosmetics & Personal Care, Food & Beverages, Animal Nutrition), By Form (Oleoresin/Oil, Powder/Dried Biomass, Liquid Concentrate, Beadlets/Encapsulated) – Forecast Till 2035

Share:
Download PDF ×

We do not share your information with anyone. However, we may send you emails based on your report interest from time to time. You may contact us at any time to opt-out.

  1. 1 Market Overview |
    1. 1.1 Study Assumptions & Market Definition |
    2. 1.2 Scope of the Study |
    3. 1.3 Research Methodology
  2. 2 Market Summary & Key Takeaways
  3. 3 Market Dynamics |
    1. 3.1 Market Drivers Analysis | |
      1. 3.1.1 Rising Demand for Astaxanthin Antioxidant Supplements | |
      2. 3.1.2 Salmon Aquaculture Feed Expansion | |
      3. 3.1.3 Skin Health and Cosmeceutical Adoption | |
      4. 3.1.4 Regulatory Tailwinds for Natural-Source Products |
    2. 3.2 Market Restraints Analysis | |
      1. 3.2.1 High Production Cost of Natural Microalgae Source | |
      2. 3.2.2 Supply Chain Price Volatility | |
      3. 3.2.3 Consumer Awareness Gaps in Emerging Markets |
    3. 3.3 Market Opportunity Analysis | |
      1. 3.3.1 Precision Fermentation and Next-Generation Production | |
      2. 3.3.2 Personalized Nutrition and Direct-to-Consumer Channels | |
      3. 3.3.3 Emerging-Market Aquaculture Growth | |
      4. 3.3.4 Cosmeceutical Product Line Extensions | |
      5. 3.3.5 Pet Nutrition and Animal Health |
    4. 3.4 Industry Value Chain Analysis |
    5. 3.5 Porter's Five Forces Analysis
  4. 4 Global Astaxanthin Market Size & Forecast (2021–2035) |
    1. 4.1 Historical Market Size (2021–2025) |
    2. 4.2 Current & Forecast Market Size (2026–2035) |
    3. 4.3 Market Size by Revenue (USD Billion) |
    4. 4.4 Year-over-Year Growth Analysis
  5. 5 Segmentation Analysis |
    1. 5.1 By Source | |
      1. 5.1.1 Natural (Haematococcus pluvialis) | |
      2. 5.1.2 Synthetic | |
      3. 5.1.3 Yeast-Derived (Phaffia rhodozyma) | |
      4. 5.1.4 Bacterial/Other |
    2. 5.2 By Application | |
      1. 5.2.1 Aquaculture Feed | |
      2. 5.2.2 Dietary Supplements | |
      3. 5.2.3 Cosmetics & Personal Care | |
      4. 5.2.4 Food & Beverages | |
      5. 5.2.5 Animal Nutrition |
    3. 5.3 By Form | |
      1. 5.3.1 Oleoresin/Oil | |
      2. 5.3.2 Powder/Dried Biomass | |
      3. 5.3.3 Liquid Concentrate | |
      4. 5.3.4 Beadlets/Encapsulated
  6. 6 Regional Analysis |
    1. 6.1 North America | |
      1. 6.1.1 United States | |
      2. 6.1.2 Canada | |
      3. 6.1.3 Mexico |
    2. 6.2 Europe | |
      1. 6.2.1 Norway | |
      2. 6.2.2 Germany | |
      3. 6.2.3 United Kingdom | |
      4. 6.2.4 France | |
      5. 6.2.5 Rest of Europe |
    3. 6.3 Asia-Pacific | |
      1. 6.3.1 Japan | |
      2. 6.3.2 China | |
      3. 6.3.3 India | |
      4. 6.3.4 Australia | |
      5. 6.3.5 Rest of Asia-Pacific |
    4. 6.4 South America | |
      1. 6.4.1 Chile | |
      2. 6.4.2 Brazil | |
      3. 6.4.3 Rest of South America |
    5. 6.5 Middle East & Africa | |
      1. 6.5.1 UAE | |
      2. 6.5.2 Saudi Arabia | |
      3. 6.5.3 South Africa | |
      4. 6.5.4 Rest of Middle East & Africa
  7. 7 Competitive Landscape |
    1. 7.1 Market Share Analysis (2025) |
    2. 7.2 Competitive Benchmarking Matrix |
    3. 7.3 Company Profiles | |
      1. 7.3.1 BASF SE | |
      2. 7.3.2 DSM-Firmenich | |
      3. 7.3.3 Cyanotech Corporation | |
      4. 7.3.4 AstaReal AB (Fuji Chemical Industry) | |
      5. 7.3.5 BGG (Beijing Gingko Group) | |
      6. 7.3.6 Fenchem Biotek | |
      7. 7.3.7 Algalif Iceland | |
      8. 7.3.8 NHU (Zhejiang NHU) | |
      9. 7.3.9 Jingzhou Natural Astaxanthin | |
      10. 7.3.10 Algatech (Solabia Group)
  8. 8 Future Outlook & Strategic Recommendations (2026–2035) |
    1. 8.1 Biotechnology-Driven Cost Deflation |
    2. 8.2 Functional Food Mainstreaming |
    3. 8.3 Sustainability and ESG-Driven Sourcing |
    4. 8.4 Clinical Pipeline Expansion
  9. 9 Recent Developments & News
  10. 10 Frequently Asked Questions (FAQs)
  11. 11 Report Scope & Methodology |
    1. 11.1 Study Period & Base Year |
    2. 11.2 Data Sources & Citations |
    3. 11.3 Abbreviations
  12. 12 LIST OF TABLES |
  13. TABLE 1 Global Astaxanthin Market Size & Forecast, by Revenue (USD Billion), 2021–2035 |
  14. TABLE 2 Global Astaxanthin Market – Year-over-Year Growth Analysis, 2021–2035 |
  15. TABLE 3 Global Astaxanthin Market – Driver Impact Analysis, 2026–2035 |
  16. TABLE 4 Global Astaxanthin Market – Restraint Impact Analysis, 2026–2035 |
  17. TABLE 5 Global Astaxanthin Market Size, by Source, 2021–2035 (USD Billion) |
  18. TABLE 6 Global Astaxanthin Market Size, by Application, 2021–2035 (USD Billion) |
  19. TABLE 7 Global Astaxanthin Market Size, by Form, 2021–2035 (USD Billion) |
  20. TABLE 8 Global Astaxanthin Market Size, by Region, 2021–2035 (USD Billion) |
  21. TABLE 9 North America Astaxanthin Market Size, by Country, 2021–2035 (USD Billion) |
  22. TABLE 10 Europe Astaxanthin Market Size, by Country, 2021–2035 (USD Billion) |
  23. TABLE 11 Asia-Pacific Astaxanthin Market Size, by Country, 2021–2035 (USD Billion) |
  24. TABLE 12 South America Astaxanthin Market Size, by Country, 2021–2035 (USD Billion) |
  25. TABLE 13 Middle East & Africa Astaxanthin Market Size, by Country, 2021–2035 (USD Billion) |
  26. TABLE 14 Regional Summary Table — Astaxanthin Market, 2025 |
  27. TABLE 15 Competitive Benchmarking Matrix – Global Astaxanthin Market, 2025 |
  28. TABLE 16 Company Profiles – Key Players, Global Astaxanthin Market |
  29. TABLE 17 Recent Developments & Strategic Announcements, 2023–2025 |
  30. TABLE 18 Report Scope & Methodology Summary |
  31. TABLE 19 Detailed Sources and Citations |
  32. TABLE 20 North America Astaxanthin Market Size, by Source, 2021–2035 (USD Billion) |
  33. TABLE 21 North America Astaxanthin Market Size, by Application, 2021–2035 (USD Billion) |
  34. TABLE 22 North America Astaxanthin Market Size, by Form, 2021–2035 (USD Billion) |
  35. TABLE 23 Europe Astaxanthin Market Size, by Source, 2021–2035 (USD Billion) |
  36. TABLE 24 Europe Astaxanthin Market Size, by Application, 2021–2035 (USD Billion) |
  37. TABLE 25 Europe Astaxanthin Market Size, by Form, 2021–2035 (USD Billion) |
  38. TABLE 26 Asia-Pacific Astaxanthin Market Size, by Source, 2021–2035 (USD Billion) |
  39. TABLE 27 Asia-Pacific Astaxanthin Market Size, by Application, 2021–2035 (USD Billion) |
  40. TABLE 28 Asia-Pacific Astaxanthin Market Size, by Form, 2021–2035 (USD Billion) |
  41. TABLE 29 South America Astaxanthin Market Size, by Source, 2021–2035 (USD Billion) |
  42. TABLE 30 South America Astaxanthin Market Size, by Application, 2021–2035 (USD Billion) |
  43. TABLE 31 South America Astaxanthin Market Size, by Form, 2021–2035 (USD Billion) |
  44. TABLE 32 Middle East & Africa Astaxanthin Market Size, by Source, 2021–2035 (USD Billion) |
  45. TABLE 33 Middle East & Africa Astaxanthin Market Size, by Application, 2021–2035 (USD Billion) |
  46. TABLE 34 Middle East & Africa Astaxanthin Market Size, by Form, 2021–2035 (USD Billion) |
  47. TABLE 35 United States Astaxanthin Market Size, by Source, 2021–2035 (USD Billion) |
  48. TABLE 36 United States Astaxanthin Market Size, by Application, 2021–2035 (USD Billion) |
  49. TABLE 37 United States Astaxanthin Market Size, by Form, 2021–2035 (USD Billion) |
  50. TABLE 38 Japan Astaxanthin Market Size, by Source, 2021–2035 (USD Billion) |
  51. TABLE 39 Japan Astaxanthin Market Size, by Application, 2021–2035 (USD Billion) |
  52. TABLE 40 Japan Astaxanthin Market Size, by Form, 2021–2035 (USD Billion) |
  53. TABLE 41 China Astaxanthin Market Size, by Source, 2021–2035 (USD Billion) |
  54. TABLE 42 China Astaxanthin Market Size, by Application, 2021–2035 (USD Billion) |
  55. TABLE 43 China Astaxanthin Market Size, by Form, 2021–2035 (USD Billion) |
  56. TABLE 44 Norway Astaxanthin Market Size, by Source, 2021–2035 (USD Billion) |
  57. TABLE 45 Norway Astaxanthin Market Size, by Application, 2021–2035 (USD Billion) |
  58. TABLE 46 Chile Astaxanthin Market Size, by Source, 2021–2035 (USD Billion) |
  59. TABLE 47 Chile Astaxanthin Market Size, by Application, 2021–2035 (USD Billion)
  60. 13 LIST OF FIGURES |
  61. FIGURE 1 Global Astaxanthin Market Dynamics — Drivers, Restraints, and Opportunities |
  62. FIGURE 2 Industry Value Chain Analysis — Astaxanthin Market |
  63. FIGURE 3 Porter's Five Forces Analysis — Global Astaxanthin Market |
  64. FIGURE 4 Global Astaxanthin Market Size Trend & Forecast (USD Billion), 2021–2035 |
  65. FIGURE 5 Global Astaxanthin Market Share, by Source, 2025 (%) |
  66. FIGURE 6 Global Astaxanthin Market Share, by Application, 2025 (%) |
  67. FIGURE 7 Global Astaxanthin Market Share, by Form, 2025 (%) |
  68. FIGURE 8 Global Astaxanthin Market Share, by Region, 2025 (%) |
  69. FIGURE 9 North America Astaxanthin Market — Country Share, 2025 (%) |
  70. FIGURE 10 Europe Astaxanthin Market — Country Share, 2025 (%) |
  71. FIGURE 11 Asia-Pacific Astaxanthin Market — Country Share, 2025 (%) |
  72. FIGURE 12 South America Astaxanthin Market — Country Share, 2025 (%) |
  73. FIGURE 13 Middle East & Africa Astaxanthin Market — Country Share, 2025 (%) |
  74. FIGURE 14 Competitive Landscape — Market Share Heat Map, 2025 |
  75. FIGURE 15 Synthetic vs Natural Astaxanthin Price Trend (USD/kg), 2021–2035 |
  76. FIGURE 16 Global Aquaculture Feed Astaxanthin Consumption (Metric Tons), 2021–2035

Segmentation Quick Reference

Dimension Sub-Segments Dominant Segment Fastest Growing Segment
By Source Natural (Haematococcus pluvialis), Synthetic, Yeast-Derived (Phaffia rhodozyma), Bacterial/Other Natural (Haematococcus pluvialis) Yeast-Derived (Phaffia rhodozyma)
By Application Aquaculture Feed, Dietary Supplements, Cosmetics & Personal Care, Food & Beverages, Animal Nutrition Aquaculture Feed Dietary Supplements
By Form Oleoresin/Oil, Powder/Dried Biomass, Liquid Concentrate, Beadlets/Encapsulated Oleoresin/Oil Liquid Concentrate
By Region North America, Europe, Asia-Pacific, South America, Middle East & Africa North America Asia-Pacific


Market Segmentation Overview

By Source

Sub-Segment Key Trend
Natural (Haematococcus pluvialis) Expanding cultivation capacity; clean-label consumer demand; premium pricing in supplement/cosmetics channels.
Synthetic Cost leadership in aquaculture feed; BASF and DSM-Firmenich capacity expansions; facing substitution pressure
Yeast-Derived (Phaffia rhodozyma) Specialty fermentation growth; non-GMO appeal; European and Japanese supplement brands adopting
Bacterial/Other Early-stage biotech platforms; precision fermentation startups entering pilot scale


Natural astaxanthin from Haematococcus pluvialis remains the premium standard for human-consumption applications, commanding significantly higher per-kilogram prices than synthetic alternatives. Synthetic astaxanthin continues to dominate volume-driven aquaculture feed, though retailer and certification pressures are gradually shifting procurement toward natural sources.

By Application

Sub-Segment Key Trend
Aquaculture Feed Stable volume backbone; salmon and shrimp pigmentation; natural-source substitution accelerating
Dietary Supplements Fastest value growth; capsules, softgels, gummies; aging-population demand driver
Cosmetics & Personal Care Topical and ingestible beauty; K-beauty and J-beauty innovation; anti-aging formulations
Food & Beverages Functional food fortification; beverage innovation; microencapsulation enabling shelf-stable formats
Animal Nutrition Companion animal supplements; joint and coat health claims; emerging niche vertical


Aquaculture feed anchors global astaxanthin consumption by volume, while dietary supplements drive the highest revenue growth rate. Cosmetics applications are expanding rapidly as clinical evidence for astaxanthin's skin-health properties reaches mainstream beauty brands.

By Form

Sub-Segment Key Trend
Oleoresin/Oil Dominant form for softgel capsules and cosmetic serums; high bioavailability
Powder/Dried Biomass Feed premix manufacturing; tablet production; cost-effective bulk format
Liquid Concentrate Growing in beverage fortification, topical serum applications, and stability challenges are being addressed.
Beadlets/Encapsulated Stability-enhanced delivery; functional food integration; emerging format with strong growth trajectory


Oleoresin and oil formats lead by revenue share, driven by their versatility across supplement and cosmetic formulations. Beadlet and encapsulated forms are gaining traction as functional food manufacturers require enhanced oxidative stability for astaxanthin incorporation into ambient-temperature products.


 

Compare Licence

×
Features License Type
Single User Multiuser License Enterprise User
Price $4,950 $5,950 $7,250
Maximum User Access Limit 1 User Upto 10 Users Unrestricted Access Throughout the Organization
Free Customization
Direct Access to Analyst
Deliverable Format
Platform Access
Discount on Next Purchase 10% 15% 15%
Printable Versions