APAC Packaging & Transport Market Segmentation
Packaging & Transport By Application (USD Billion, 2025-2035)
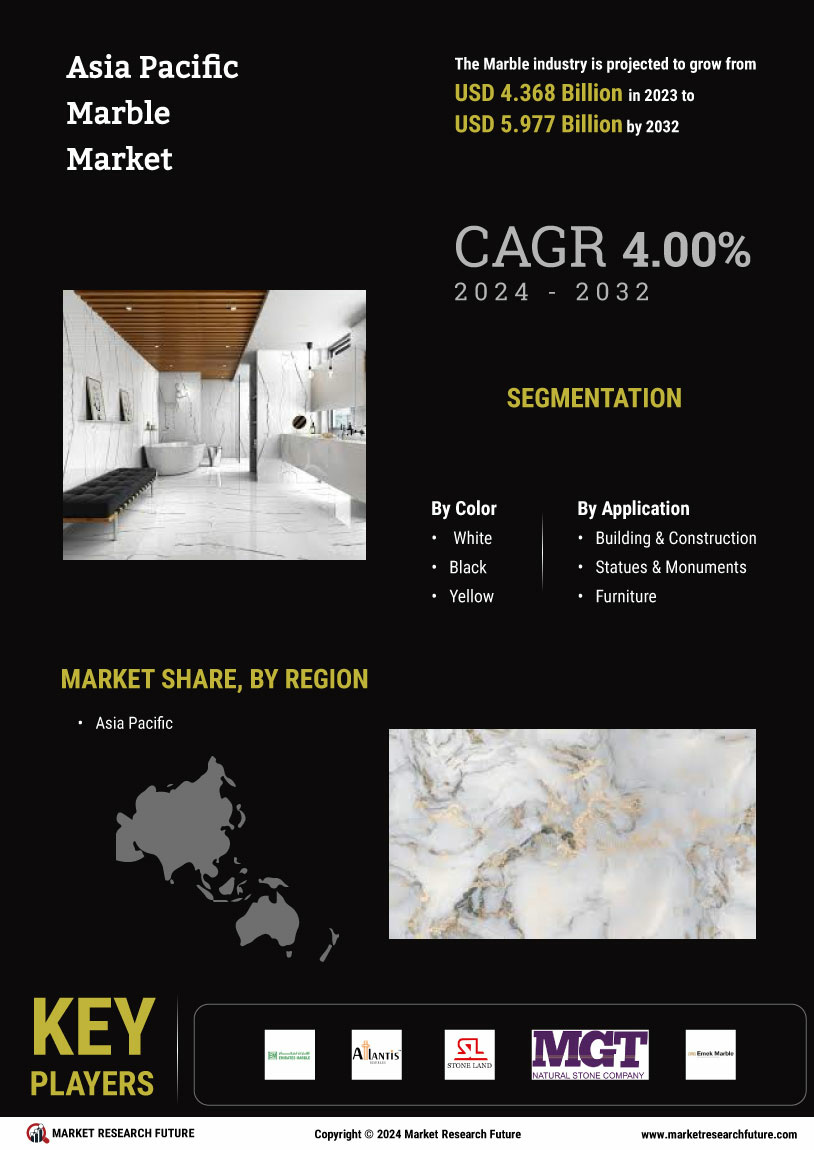
- Asia Pacific Marble Market
- Interior Design
- Tabletops
- Landscaping
Packaging & Transport By Type (USD Billion, 2025-2035)
- Marble Blocks
- Marble Slabs
- Marble Tiles
- Marble Chips
Packaging & Transport By Color (USD Billion, 2025-2035)
- White
- Black
- Beige
- Green
- Pink
Packaging & Transport By Finish Type (USD Billion, 2025-2035)
- Polished
- Honed
- Brushed
- Tumbled