×
  • Cat-intel
  • MedIntelliX
  • Resources
  • About Us
  • Hero Background
    English
    Chinese
    French
    Japanese
    Korean
    German
    Spanish

    Asia Pacific Cement Market Size

    ID: MRFR/CnM/11167-HCR
    111 Pages
    Chitranshi Jaiswal
    October 2025

    Asia Pacific Cement Market Research Report Information By Type (Portland, Blended, and Others), By Application (Residential and Non-Residential) – and Asia Pacific Market Forecast Till 2035

    Share:
    Download PDF ×

    We do not share your information with anyone. However, we may send you emails based on your report interest from time to time. You may contact us at any time to opt-out.

    Asia Pacific Cement Market Infographic
    Purchase Options

    Asia Pacific Cement Size

    Asia Pacific Cement Market Growth Projections and Opportunities

    The Asia Pacific cement market is dynamic and evolving due to many key dynamics. Industrialization and urbanization in populous countries like China and India have boosted the region's economy. These nations continue to expand and invest extensively in infrastructure, driving cement demand. The construction of roads, bridges, residential structures, and commercial areas uses cement, driving market expansion.

    Government regulations also impact the Asia Pacific cement market. Many regional governments have ambitious infrastructure development plans to support economic growth and living standards. Cement, a building material, is in demand due to government investments in huge projects. Alternative materials and technologies have increased due to regulatory frameworks that encourage sustainable and eco-friendly construction, affecting the cement business.

    The Asia Pacific cement market depends on raw material prices and availability. Limestone, clay, and gypsum are essential to cement manufacture. Cement producers' production costs depend on these raw materials' availability and pricing. Supply chain disruptions from global commodity pricing, geopolitical events, and environmental concerns can affect market dynamics.

    Innovation and technology are changing the Asia Pacific cement market. Advanced manufacturing technologies include dry and semi-dry production improve efficiency and reduce environmental impact. Additionally, digital technology in production and logistics optimize processes and boost productivity. As cement makers adopt new technologies, they gain a competitive edge and shape the market.

    Infrastructure construction and development depend on the Asia Pacific cement market. City growth, population increase, and the need for modern infrastructure drive regional construction initiatives. Megaprojects like high-speed railroads, smart cities, and mixed-use buildings boost cement consumption. The cyclical construction industry, impacted by economic cycles and government investment, highlights the link between infrastructure development and the cement market.

    Trade and global market dynamics affect the Asia Pacific cement market. Cement manufacturers export to neighboring countries and abroad. Global cement prices, trade policies, and geopolitical concerns affect market movements. International rivalry and currency rate swings complicate the industry, forcing local businesses to be flexible.

    The Asia Pacific cement market is being influenced by climate change and sustainability. As building faces environmental scrutiny, cement makers are investigating greener options and embracing eco-friendly methods. Consumer choices and regulatory forces are driving low-carbon and sustainable cement product demand. Companies who address environmental issues early may have an advantage in the changing market.
    Asia Pacific Cement Market Size Graph
    Author
    Chitranshi Jaiswal
    Research Analyst Level I

    In her 3 years of experience in the market research field, she has handled critical cross-domain projects. She has an in-depth knowledge of market estimation & analysis, problem-solving, primary as well as secondary research, and team management.She holds an engineering degree and is an MBA professional from a well-known university, capable of evaluating the market and competitive conditions. An exceptional strategist with excellent communication skills and a passion for delivering cutting-edge & practical insights for the market. Proficient in multi-tasking, and can successfully deal with competing demands, while maintaining complete confidentiality. Generated business through active client and project development, networking, and high-quality responses. Her knowledge and skills have helped in making solid business decisions, securing funding from investors, and avoiding business failures.

    Leave a Comment

    FAQs

    How much is the cement market?

    The Asia Pacific Cement market size was valued at USD 251.5 Billion in 2022.

    What is the growth rate of the cement market?

    Asia Pacific Cement Market is expected to grow with a CAGR of 3.6% in the period 2025-2035

    Who are the key players in the cement market?

    The key players in the market are CNBM International Corporation, Anhui Conch Cement Co., Ltd., Jidong Development Group Co., Ltd., LafargeHolcim Ltd and HeidelbergCement AG.

    Which type led the cement market?

    The blended category dominated the market in 2022.

    Which application had the largest market share in the cement market?

    Which application had the largest market share in the cement market?

    Market Summary

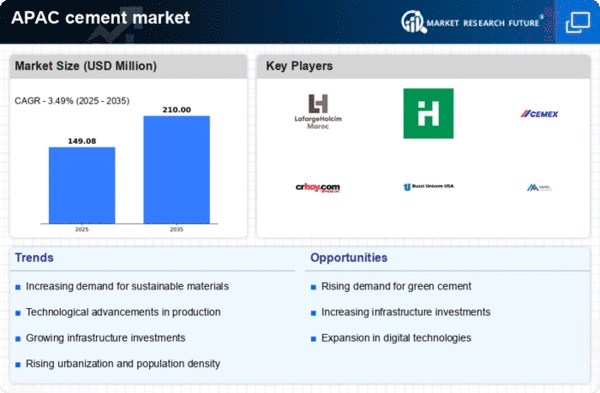
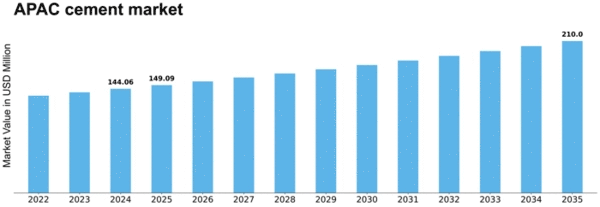
    As per MRFR analysis, the APAC cement market Size was estimated at 144.06 USD Million in 2024. The APAC cement market is projected to grow from 149.08 USD Million in 2025 to 210.0 USD Million by 2035, exhibiting a compound annual growth rate (CAGR) of 3.49% during the forecast period 2025 - 2035.

    Key Market Trends & Highlights

    The APAC cement market is experiencing robust growth driven by urbanization and sustainability initiatives.

    • Sustainability initiatives are increasingly shaping the cement market, with a focus on reducing carbon emissions.
    • Technological advancements in cement production are enhancing efficiency and product quality across the region.
    • China remains the largest market for cement, while India is recognized as the fastest-growing region in the APAC sector.
    • Rising construction activities and government infrastructure investments are key drivers propelling market expansion.

    Market Size & Forecast

    2024 Market Size 144.06 (USD Million)
    2035 Market Size 210.0 (USD Million)
    CAGR (2025 - 2035) 3.49%

    Major Players

    <p>LafargeHolcim (CH), HeidelbergCement (DE), Cemex (MX), CRH (IE), Buzzi Unicem (IT), Martin Marietta Materials (US), UltraTech Cement (IN), Taiwan Cement (TW), Anhui Conch Cement (CN)</p>

    Market Trends

    The cement market in the APAC region is currently experiencing a dynamic phase characterized by evolving demand patterns and innovative production techniques. The region's rapid urbanization and infrastructure development initiatives are driving a notable increase in cement consumption. Governments are investing heavily in construction projects, which appears to be a response to the growing population and the need for improved housing and transportation networks. Furthermore, sustainability concerns are influencing the industry, prompting manufacturers to explore eco-friendly alternatives and reduce carbon emissions associated with cement production. In addition to these developments, the cement market is witnessing a shift towards digitalization and automation. Companies are increasingly adopting advanced technologies to enhance operational efficiency and reduce costs. This trend may lead to improved product quality and faster delivery times, thereby meeting the rising expectations of consumers. As the APAC region continues to evolve, the cement market is likely to adapt to these changes, positioning itself for future growth and innovation. The interplay of these factors suggests a complex landscape where traditional practices are being challenged by modern demands and environmental considerations.

    Sustainability Initiatives

    The cement market is increasingly focusing on sustainability, with manufacturers exploring alternative materials and production methods to minimize environmental impact. This trend is driven by regulatory pressures and consumer demand for greener products, leading to innovations in low-carbon cement technologies.

    Technological Advancements

    Digitalization and automation are transforming the cement market, as companies implement advanced technologies to streamline operations. This shift enhances efficiency, reduces costs, and improves product quality, allowing businesses to better meet the demands of a competitive landscape.

    Urbanization and Infrastructure Growth

    Rapid urbanization in the APAC region is fueling demand for cement, as governments invest in infrastructure projects to accommodate growing populations. This trend is expected to continue, with significant implications for cement consumption and market dynamics.

    Asia Pacific Cement Market Market Drivers

    Increasing Urban Population

    The rapid increase in urban population across APAC is a crucial driver for the cement market. As more individuals migrate to urban areas, the demand for housing and infrastructure rises correspondingly. In 2025, it is projected that urban areas in APAC will house over 2 billion people, necessitating extensive construction efforts. This demographic shift is likely to lead to a heightened demand for cement, as urbanization requires substantial investment in residential and commercial buildings. Consequently, the cement market in APAC is expected to experience robust growth, driven by the need to accommodate the burgeoning urban population.

    Rising Construction Activities

    The cement market in APAC is experiencing a surge in construction activities, driven by urbanization and infrastructure development. Countries such as India and China are investing heavily in housing, transportation, and commercial projects. For instance, India's construction sector is projected to grow at a CAGR of 7.1% from 2021 to 2026, significantly boosting cement demand. This growth is further supported by government initiatives aimed at enhancing infrastructure, which is expected to increase cement consumption in the region. The cement market in APAC is likely to benefit from these developments, as increased construction activities lead to higher demand for cement products.

    Government Infrastructure Investments

    Government investments in infrastructure projects are a key driver for the cement market in APAC. Various nations are allocating substantial budgets for the development of roads, bridges, and public facilities. For example, the Asian Development Bank has committed to financing infrastructure projects across the region, which is anticipated to enhance cement consumption. In 2023, it was reported that infrastructure spending in APAC reached approximately $1.5 trillion, with a significant portion directed towards cement-intensive projects. This trend indicates a robust demand for cement, as governments prioritize infrastructure to stimulate economic growth and improve living standards.

    Growing Demand for Green Building Materials

    The cement market in APAC is witnessing a shift towards sustainable construction practices, with an increasing demand for green building materials. This trend is driven by environmental regulations and consumer preferences for eco-friendly products. Countries like Japan and South Korea are leading the way in adopting sustainable construction methods, which often require innovative cement solutions. The market for green cement is expected to grow at a CAGR of 12% from 2025 to 2030, reflecting the rising awareness of sustainability in the construction sector. This shift presents opportunities for cement manufacturers to develop and market environmentally friendly products, thereby enhancing their competitiveness in the cement market.

    Technological Innovations in Cement Production

    Technological advancements in cement production are significantly influencing the cement market in APAC. Innovations such as alternative raw materials, energy-efficient processes, and automation are enhancing production efficiency and reducing costs. For instance, the adoption of carbon capture technology is gaining traction, allowing manufacturers to minimize emissions while maintaining output levels. In 2025, it is estimated that the implementation of such technologies could reduce production costs by up to 15%, thereby increasing profitability for cement producers. This trend not only supports the growth of the cement market but also aligns with global sustainability goals.

    Market Segment Insights

    By Type: Portland (Largest) vs. Blended (Fastest-Growing)

    <p>In the Asia Pacific Cement Market, Portland cement continues to dominate the landscape, accounting for a significant portion of the market share. This traditional type of cement is preferred for its strength and versatility, making it the go-to choice for various construction applications. In contrast, blended cement is gaining traction, offering superior properties like lower environmental impact and enhanced durability, making it attractive to modern construction practices. As focus shifts towards sustainable building solutions, the growth of blended cement is accelerated by increasing government regulations and consumer preference for eco-friendly materials. Its growth is further propelled by advancements in technology that enhance blended cement's performance, thereby attracting construction firms looking to innovate and improve project outcomes. This trend indicates a substantial shift towards more sustainable alternatives in cement production within the Asia Pacific region.</p>

    <p>Portland (Dominant) vs. Blended (Emerging)</p>

    <p>Portland cement remains the dominant player in the Asia Pacific Cement Market, favored for its reliable performance and widespread availability. Known for its strength and adaptability, it serves as the primary material for numerous construction projects, including residential, commercial, and infrastructural developments. On the other hand, blended cement represents an emerging alternative that combines various materials, including fly ash and slag, to enhance performance and sustainability. This segment appeals to environmentally conscious consumers and regulatory bodies that favor lower carbon footprints. As companies invest in research to develop innovative blended formulations, this segment is gaining momentum, promising not only to meet modern construction demands but also to support global sustainability goals.</p>

    By Application: Residential (Largest) vs. Non-Residential (Fastest-Growing)

    <p>In the Asia Pacific Cement Market, the application segment is primarily dominated by residential construction, which accounts for a significant share of overall consumption. The residential sector benefits from increasing urbanization and population growth, leading to a higher demand for housing. Meanwhile, the non-residential application, including commercial, industrial, and institutional buildings, is rapidly gaining traction, thanks to government investments and infrastructure developments. This shift in focus towards both sectors highlights a dynamic market landscape where each plays a crucial role in overall market health. The growth trends in the Asia Pacific region reflect a robust increase in cement consumption in non-residential applications, often described as the fastest-growing segment. Factors contributing to this growth include a surge in public and private sector infrastructure projects, urban renewal initiatives, and increasing commercial activities. The region is witnessing an uptrend in construction projects, including schools, hospitals, and office complexes, driven by a mix of policy support and evolving market dynamics. As a result, the cement market is expected to see continued momentum in both segments, but non-residential applications will likely experience more accelerated growth in the coming years.</p>

    <p>Residential (Dominant) vs. Non-Residential (Emerging)</p>

    <p>The residential application in the Asia Pacific Cement Market remains dominant, primarily fueled by continuous urban migration and the ever-growing demand for new housing developments. This sector often benefits from government housing schemes and incentives aimed at increasing home ownership and living standards. As cities expand, residential projects range from single-family homes to large apartment complexes, all utilizing cement for construction due to its durability and cost-effectiveness. Conversely, the non-residential application is emerging, focusing on various infrastructure developments, including commercial buildings, retail spaces, and public facilities. This segment is experiencing a notable shift as countries within the Asia Pacific invest heavily in their infrastructure, aiming to boost economic growth and improve living conditions. As a result, while residential remains a key player, non-residential is rapidly establishing itself as a vital and growing part of the cement market.</p>

    Get more detailed insights about Asia Pacific Cement Market Research Report—Forecast till 2035

    Regional Insights

    China : Unmatched Growth and Demand Trends

    China holds a staggering 60.0% market share in the APAC cement sector, valued at approximately $200 billion. Key growth drivers include rapid urbanization, government-backed infrastructure projects, and a booming construction sector. The demand for cement is primarily fueled by residential and commercial construction, with significant investments in transportation infrastructure. Regulatory policies favor sustainable practices, pushing for eco-friendly cement production and waste recycling initiatives.

    India : Infrastructure Boom Fuels Demand

    India commands a 35.0% share of the APAC cement market, valued at around $70 billion. The growth is driven by government initiatives like the 'Housing for All' scheme and significant investments in infrastructure. Demand is surging in urban areas, with a focus on affordable housing and smart city projects. Regulatory support for green building practices is also gaining traction, enhancing the market's sustainability profile.

    Japan : Innovation and Sustainability Focus

    Japan's cement market holds a 15.0% share in APAC, valued at approximately $15 billion. The market is characterized by a focus on innovation and sustainability, driven by government regulations promoting eco-friendly construction. Demand is stable, with a shift towards high-performance cement products. The aging infrastructure is prompting investments in renovation and seismic-resistant construction, further influencing consumption patterns.

    South Korea : Sustainability and Efficiency Drive Growth

    South Korea accounts for 10.0% of the APAC cement market, valued at about $10 billion. The industry is propelled by technological advancements and a strong emphasis on sustainability. Government policies encourage the use of alternative fuels and materials in cement production. Demand is primarily driven by construction and infrastructure projects, particularly in urban centers like Seoul and Busan, where high-rise buildings are prevalent.

    Malaysia : Growth Through Infrastructure Development

    Malaysia holds a 5.0% share of the APAC cement market, valued at around $5 billion. The market is experiencing growth due to government initiatives aimed at enhancing infrastructure, including roads and public transport systems. Demand is concentrated in urban areas, with significant projects in Kuala Lumpur and Penang. The competitive landscape features local players like YTL Cement and international firms, fostering a dynamic business environment.

    Thailand : Infrastructure Projects Drive Demand

    Thailand's cement market represents 4.0% of the APAC share, valued at approximately $4 billion. The growth is supported by ongoing infrastructure projects and government investments in transportation. Demand is particularly strong in Bangkok and surrounding provinces, where urbanization is accelerating. The competitive landscape includes both local and international players, with a focus on sustainable practices and product innovation.

    Indonesia : Urbanization Fuels Market Expansion

    Indonesia captures an 8.0% share of the APAC cement market, valued at around $8 billion. The market is driven by rapid urbanization and government initiatives to improve infrastructure. Key cities like Jakarta and Surabaya are witnessing a construction boom, leading to increased cement consumption. The competitive landscape features major players like Semen Indonesia and Holcim, focusing on meeting local demand through innovative products.

    Rest of APAC : Regional Variations in Demand

    The Rest of APAC accounts for 7.06% of the cement market, valued at approximately $7 billion. This sub-region includes various countries with unique market dynamics, driven by local infrastructure needs and economic conditions. Demand varies significantly, with emerging markets focusing on construction and established markets emphasizing sustainability. The competitive landscape is diverse, featuring both local and international players adapting to regional demands.

    Key Players and Competitive Insights

    The cement market exhibits a dynamic competitive landscape characterized by robust growth drivers such as urbanization, infrastructure development, and increasing demand for sustainable construction materials. Key players like LafargeHolcim (CH), UltraTech Cement (IN), and Anhui Conch Cement (CN) are strategically positioned to leverage these trends. LafargeHolcim (CH) focuses on innovation and sustainability, aiming to reduce carbon emissions through advanced technologies. UltraTech Cement (IN) emphasizes regional expansion and digital transformation, enhancing operational efficiency and customer engagement. Meanwhile, Anhui Conch Cement (CN) is concentrating on optimizing its supply chain and increasing production capacity to meet rising demand, collectively shaping a competitive environment that prioritizes sustainability and operational excellence.

    The market structure appears moderately fragmented, with several players competing for market share while also collaborating on sustainability initiatives. Key business tactics include localizing manufacturing to reduce transportation costs and optimizing supply chains to enhance responsiveness to market demands. This collective influence of major players fosters a competitive atmosphere where innovation and efficiency are paramount.

    In September 2025, LafargeHolcim (CH) announced a partnership with a leading technology firm to develop AI-driven solutions aimed at optimizing cement production processes. This strategic move is likely to enhance operational efficiency and reduce costs, positioning the company favorably in a market increasingly focused on technological advancements. The integration of AI into production processes may also lead to improved product quality and reduced environmental impact, aligning with global sustainability goals.

    In October 2025, UltraTech Cement (IN) launched a new range of eco-friendly cement products designed to meet the growing demand for sustainable construction materials. This initiative not only reflects the company's commitment to sustainability but also positions it competitively against other players in the market. By diversifying its product offerings, UltraTech Cement (IN) aims to capture a larger share of the market while addressing environmental concerns, which are becoming increasingly important to consumers and regulators alike.

    In August 2025, Anhui Conch Cement (CN) expanded its production capacity by 5 million tonnes per annum through the acquisition of a local cement plant. This strategic acquisition is expected to enhance the company's market presence and enable it to meet the rising demand for cement in the region. By increasing production capacity, Anhui Conch Cement (CN) is likely to strengthen its competitive position and improve its ability to respond to market fluctuations.

    As of November 2025, current trends in the cement market indicate a strong emphasis on digitalization, sustainability, and the integration of advanced technologies such as AI. Strategic alliances among key players are shaping the competitive landscape, fostering innovation and collaboration. The shift from price-based competition to a focus on technological differentiation and supply chain reliability is evident. Companies that prioritize innovation and sustainability are likely to emerge as leaders in this evolving market, suggesting a future where competitive differentiation hinges on the ability to adapt to changing consumer preferences and regulatory demands.

    Key Companies in the Asia Pacific Cement Market market include

    Industry Developments

    Future Outlook

    Asia Pacific Cement Market Future Outlook

    <p>The cement market is projected to grow at a 3.49% CAGR from 2024 to 2035, driven by urbanization, infrastructure development, and sustainable practices.</p>

    New opportunities lie in:

    • <p>Expansion of eco-friendly cement products to meet regulatory demands.</p>
    • <p>Investment in automated production technologies to enhance efficiency.</p>
    • <p>Development of strategic partnerships with construction firms for project collaborations.</p>

    <p>By 2035, the market is expected to achieve robust growth, driven by innovation and strategic initiatives.</p>

    Market Segmentation

    Asia Pacific Cement Market Type Outlook

    • Ordinary Portland Cement (OPC)
    • White Cements
    • Pozzolanic Cements
    • Blended Cements
    • Others

    Asia Pacific Cement Market End-Use Outlook

    • Industrial
    • Residential
    • Commercial

    Asia Pacific Cement Market Application Outlook

    • Construction
    • Infrastructure
    • Railway
    • Others

    Report Scope

    MARKET SIZE 2024144.06(USD Million)
    MARKET SIZE 2025149.08(USD Million)
    MARKET SIZE 2035210.0(USD Million)
    COMPOUND ANNUAL GROWTH RATE (CAGR)3.49% (2024 - 2035)
    REPORT COVERAGERevenue Forecast, Competitive Landscape, Growth Factors, and Trends
    BASE YEAR2024
    Market Forecast Period2025 - 2035
    Historical Data2019 - 2024
    Market Forecast UnitsUSD Million
    Key Companies Profiled["LafargeHolcim (CH)", "HeidelbergCement (DE)", "Cemex (MX)", "CRH (IE)", "Buzzi Unicem (IT)", "Martin Marietta Materials (US)", "UltraTech Cement (IN)", "Taiwan Cement (TW)", "Anhui Conch Cement (CN)"]
    Segments CoveredType, Application, End-Use
    Key Market OpportunitiesAdoption of sustainable cement production technologies to meet regulatory demands and consumer preferences.
    Key Market DynamicsRising demand for sustainable construction materials drives innovation and competition in the cement market.
    Countries CoveredChina, India, Japan, South Korea, Malaysia, Thailand, Indonesia, Rest of APAC

    FAQs

    How much is the cement market?

    The Asia Pacific Cement market size was valued at USD 251.5 Billion in 2022.

    What is the growth rate of the cement market?

    Asia Pacific Cement Market is expected to grow with a CAGR of 3.6% in the period 2025-2035

    Who are the key players in the cement market?

    The key players in the market are CNBM International Corporation, Anhui Conch Cement Co., Ltd., Jidong Development Group Co., Ltd., LafargeHolcim Ltd and HeidelbergCement AG.

    Which type led the cement market?

    The blended category dominated the market in 2022.

    Which application had the largest market share in the cement market?

    Which application had the largest market share in the cement market?

    1. SECTION I: EXECUTIVE SUMMARY AND KEY HIGHLIGHTS
      1. | 1.1 EXECUTIVE SUMMARY
      2. | | 1.1.1 Market Overview
      3. | | 1.1.2 Key Findings
      4. | | 1.1.3 Market Segmentation
      5. | | 1.1.4 Competitive Landscape
      6. | | 1.1.5 Challenges and Opportunities
      7. | | 1.1.6 Future Outlook
    2. SECTION II: SCOPING, METHODOLOGY AND MARKET STRUCTURE
      1. | 2.1 MARKET INTRODUCTION
      2. | | 2.1.1 Definition
      3. | | 2.1.2 Scope of the study
      4. | | | 2.1.2.1 Research Objective
      5. | | | 2.1.2.2 Assumption
      6. | | | 2.1.2.3 Limitations
      7. | 2.2 RESEARCH METHODOLOGY
      8. | | 2.2.1 Overview
      9. | | 2.2.2 Data Mining
      10. | | 2.2.3 Secondary Research
      11. | | 2.2.4 Primary Research
      12. | | | 2.2.4.1 Primary Interviews and Information Gathering Process
      13. | | | 2.2.4.2 Breakdown of Primary Respondents
      14. | | 2.2.5 Forecasting Model
      15. | | 2.2.6 Market Size Estimation
      16. | | | 2.2.6.1 Bottom-Up Approach
      17. | | | 2.2.6.2 Top-Down Approach
      18. | | 2.2.7 Data Triangulation
      19. | | 2.2.8 Validation
    3. SECTION III: QUALITATIVE ANALYSIS
      1. | 3.1 MARKET DYNAMICS
      2. | | 3.1.1 Overview
      3. | | 3.1.2 Drivers
      4. | | 3.1.3 Restraints
      5. | | 3.1.4 Opportunities
      6. | 3.2 MARKET FACTOR ANALYSIS
      7. | | 3.2.1 Value chain Analysis
      8. | | 3.2.2 Porter's Five Forces Analysis
      9. | | | 3.2.2.1 Bargaining Power of Suppliers
      10. | | | 3.2.2.2 Bargaining Power of Buyers
      11. | | | 3.2.2.3 Threat of New Entrants
      12. | | | 3.2.2.4 Threat of Substitutes
      13. | | | 3.2.2.5 Intensity of Rivalry
      14. | | 3.2.3 COVID-19 Impact Analysis
      15. | | | 3.2.3.1 Market Impact Analysis
      16. | | | 3.2.3.2 Regional Impact
      17. | | | 3.2.3.3 Opportunity and Threat Analysis
    4. SECTION IV: QUANTITATIVE ANALYSIS
      1. | 4.1 Chemicals and Materials, BY Type (USD Billion)
      2. | | 4.1.1 Portland
      3. | | 4.1.2 Blended
      4. | | 4.1.3 Others
      5. | 4.2 Chemicals and Materials, BY Application (USD Billion)
      6. | | 4.2.1 Residential
      7. | | 4.2.2 Non-Residential
      8. | 4.3 Chemicals and Materials, BY Region (USD Billion)
      9. | | 4.3.1 North America
      10. | | | 4.3.1.1 US
      11. | | | 4.3.1.2 Canada
      12. | | 4.3.2 Europe
      13. | | | 4.3.2.1 Germany
      14. | | | 4.3.2.2 UK
      15. | | | 4.3.2.3 France
      16. | | | 4.3.2.4 Russia
      17. | | | 4.3.2.5 Italy
      18. | | | 4.3.2.6 Spain
      19. | | | 4.3.2.7 Rest of Europe
      20. | | 4.3.3 APAC
      21. | | | 4.3.3.1 China
      22. | | | 4.3.3.2 India
      23. | | | 4.3.3.3 Japan
      24. | | | 4.3.3.4 South Korea
      25. | | | 4.3.3.5 Malaysia
      26. | | | 4.3.3.6 Thailand
      27. | | | 4.3.3.7 Indonesia
      28. | | | 4.3.3.8 Rest of APAC
      29. | | 4.3.4 South America
      30. | | | 4.3.4.1 Brazil
      31. | | | 4.3.4.2 Mexico
      32. | | | 4.3.4.3 Argentina
      33. | | | 4.3.4.4 Rest of South America
      34. | | 4.3.5 MEA
      35. | | | 4.3.5.1 GCC Countries
      36. | | | 4.3.5.2 South Africa
      37. | | | 4.3.5.3 Rest of MEA
    5. SECTION V: COMPETITIVE ANALYSIS
      1. | 5.1 Competitive Landscape
      2. | | 5.1.1 Overview
      3. | | 5.1.2 Competitive Analysis
      4. | | 5.1.3 Market share Analysis
      5. | | 5.1.4 Major Growth Strategy in the Chemicals and Materials
      6. | | 5.1.5 Competitive Benchmarking
      7. | | 5.1.6 Leading Players in Terms of Number of Developments in the Chemicals and Materials
      8. | | 5.1.7 Key developments and growth strategies
      9. | | | 5.1.7.1 New Product Launch/Service Deployment
      10. | | | 5.1.7.2 Merger & Acquisitions
      11. | | | 5.1.7.3 Joint Ventures
      12. | | 5.1.8 Major Players Financial Matrix
      13. | | | 5.1.8.1 Sales and Operating Income
      14. | | | 5.1.8.2 Major Players R&D Expenditure. 2023
      15. | 5.2 Company Profiles
      16. | | 5.2.1 LafargeHolcim (CH)
      17. | | | 5.2.1.1 Financial Overview
      18. | | | 5.2.1.2 Products Offered
      19. | | | 5.2.1.3 Key Developments
      20. | | | 5.2.1.4 SWOT Analysis
      21. | | | 5.2.1.5 Key Strategies
      22. | | 5.2.2 China National Building Material (CN)
      23. | | | 5.2.2.1 Financial Overview
      24. | | | 5.2.2.2 Products Offered
      25. | | | 5.2.2.3 Key Developments
      26. | | | 5.2.2.4 SWOT Analysis
      27. | | | 5.2.2.5 Key Strategies
      28. | | 5.2.3 HeidelbergCement (DE)
      29. | | | 5.2.3.1 Financial Overview
      30. | | | 5.2.3.2 Products Offered
      31. | | | 5.2.3.3 Key Developments
      32. | | | 5.2.3.4 SWOT Analysis
      33. | | | 5.2.3.5 Key Strategies
      34. | | 5.2.4 Taiwan Cement Corporation (TW)
      35. | | | 5.2.4.1 Financial Overview
      36. | | | 5.2.4.2 Products Offered
      37. | | | 5.2.4.3 Key Developments
      38. | | | 5.2.4.4 SWOT Analysis
      39. | | | 5.2.4.5 Key Strategies
      40. | | 5.2.5 UltraTech Cement (IN)
      41. | | | 5.2.5.1 Financial Overview
      42. | | | 5.2.5.2 Products Offered
      43. | | | 5.2.5.3 Key Developments
      44. | | | 5.2.5.4 SWOT Analysis
      45. | | | 5.2.5.5 Key Strategies
      46. | | 5.2.6 Cemex Holdings Philippines (PH)
      47. | | | 5.2.6.1 Financial Overview
      48. | | | 5.2.6.2 Products Offered
      49. | | | 5.2.6.3 Key Developments
      50. | | | 5.2.6.4 SWOT Analysis
      51. | | | 5.2.6.5 Key Strategies
      52. | | 5.2.7 Siam Cement Group (TH)
      53. | | | 5.2.7.1 Financial Overview
      54. | | | 5.2.7.2 Products Offered
      55. | | | 5.2.7.3 Key Developments
      56. | | | 5.2.7.4 SWOT Analysis
      57. | | | 5.2.7.5 Key Strategies
      58. | | 5.2.8 Asia Cement Corporation (TW)
      59. | | | 5.2.8.1 Financial Overview
      60. | | | 5.2.8.2 Products Offered
      61. | | | 5.2.8.3 Key Developments
      62. | | | 5.2.8.4 SWOT Analysis
      63. | | | 5.2.8.5 Key Strategies
      64. | | 5.2.9 Shree Cement (IN)
      65. | | | 5.2.9.1 Financial Overview
      66. | | | 5.2.9.2 Products Offered
      67. | | | 5.2.9.3 Key Developments
      68. | | | 5.2.9.4 SWOT Analysis
      69. | | | 5.2.9.5 Key Strategies
      70. | 5.3 Appendix
      71. | | 5.3.1 References
      72. | | 5.3.2 Related Reports
    6. LIST OF FIGURES
      1. | 6.1 MARKET SYNOPSIS
      2. | 6.2 NORTH AMERICA MARKET ANALYSIS
      3. | 6.3 US MARKET ANALYSIS BY TYPE
      4. | 6.4 US MARKET ANALYSIS BY APPLICATION
      5. | 6.5 CANADA MARKET ANALYSIS BY TYPE
      6. | 6.6 CANADA MARKET ANALYSIS BY APPLICATION
      7. | 6.7 EUROPE MARKET ANALYSIS
      8. | 6.8 GERMANY MARKET ANALYSIS BY TYPE
      9. | 6.9 GERMANY MARKET ANALYSIS BY APPLICATION
      10. | 6.10 UK MARKET ANALYSIS BY TYPE
      11. | 6.11 UK MARKET ANALYSIS BY APPLICATION
      12. | 6.12 FRANCE MARKET ANALYSIS BY TYPE
      13. | 6.13 FRANCE MARKET ANALYSIS BY APPLICATION
      14. | 6.14 RUSSIA MARKET ANALYSIS BY TYPE
      15. | 6.15 RUSSIA MARKET ANALYSIS BY APPLICATION
      16. | 6.16 ITALY MARKET ANALYSIS BY TYPE
      17. | 6.17 ITALY MARKET ANALYSIS BY APPLICATION
      18. | 6.18 SPAIN MARKET ANALYSIS BY TYPE
      19. | 6.19 SPAIN MARKET ANALYSIS BY APPLICATION
      20. | 6.20 REST OF EUROPE MARKET ANALYSIS BY TYPE
      21. | 6.21 REST OF EUROPE MARKET ANALYSIS BY APPLICATION
      22. | 6.22 APAC MARKET ANALYSIS
      23. | 6.23 CHINA MARKET ANALYSIS BY TYPE
      24. | 6.24 CHINA MARKET ANALYSIS BY APPLICATION
      25. | 6.25 INDIA MARKET ANALYSIS BY TYPE
      26. | 6.26 INDIA MARKET ANALYSIS BY APPLICATION
      27. | 6.27 JAPAN MARKET ANALYSIS BY TYPE
      28. | 6.28 JAPAN MARKET ANALYSIS BY APPLICATION
      29. | 6.29 SOUTH KOREA MARKET ANALYSIS BY TYPE
      30. | 6.30 SOUTH KOREA MARKET ANALYSIS BY APPLICATION
      31. | 6.31 MALAYSIA MARKET ANALYSIS BY TYPE
      32. | 6.32 MALAYSIA MARKET ANALYSIS BY APPLICATION
      33. | 6.33 THAILAND MARKET ANALYSIS BY TYPE
      34. | 6.34 THAILAND MARKET ANALYSIS BY APPLICATION
      35. | 6.35 INDONESIA MARKET ANALYSIS BY TYPE
      36. | 6.36 INDONESIA MARKET ANALYSIS BY APPLICATION
      37. | 6.37 REST OF APAC MARKET ANALYSIS BY TYPE
      38. | 6.38 REST OF APAC MARKET ANALYSIS BY APPLICATION
      39. | 6.39 SOUTH AMERICA MARKET ANALYSIS
      40. | 6.40 BRAZIL MARKET ANALYSIS BY TYPE
      41. | 6.41 BRAZIL MARKET ANALYSIS BY APPLICATION
      42. | 6.42 MEXICO MARKET ANALYSIS BY TYPE
      43. | 6.43 MEXICO MARKET ANALYSIS BY APPLICATION
      44. | 6.44 ARGENTINA MARKET ANALYSIS BY TYPE
      45. | 6.45 ARGENTINA MARKET ANALYSIS BY APPLICATION
      46. | 6.46 REST OF SOUTH AMERICA MARKET ANALYSIS BY TYPE
      47. | 6.47 REST OF SOUTH AMERICA MARKET ANALYSIS BY APPLICATION
      48. | 6.48 MEA MARKET ANALYSIS
      49. | 6.49 GCC COUNTRIES MARKET ANALYSIS BY TYPE
      50. | 6.50 GCC COUNTRIES MARKET ANALYSIS BY APPLICATION
      51. | 6.51 SOUTH AFRICA MARKET ANALYSIS BY TYPE
      52. | 6.52 SOUTH AFRICA MARKET ANALYSIS BY APPLICATION
      53. | 6.53 REST OF MEA MARKET ANALYSIS BY TYPE
      54. | 6.54 REST OF MEA MARKET ANALYSIS BY APPLICATION
      55. | 6.55 KEY BUYING CRITERIA OF CHEMICALS AND MATERIALS
      56. | 6.56 RESEARCH PROCESS OF MRFR
      57. | 6.57 DRO ANALYSIS OF CHEMICALS AND MATERIALS
      58. | 6.58 DRIVERS IMPACT ANALYSIS: CHEMICALS AND MATERIALS
      59. | 6.59 RESTRAINTS IMPACT ANALYSIS: CHEMICALS AND MATERIALS
      60. | 6.60 SUPPLY / VALUE CHAIN: CHEMICALS AND MATERIALS
      61. | 6.61 CHEMICALS AND MATERIALS, BY TYPE, 2024 (% SHARE)
      62. | 6.62 CHEMICALS AND MATERIALS, BY TYPE, 2024 TO 2035 (USD Billion)
      63. | 6.63 CHEMICALS AND MATERIALS, BY APPLICATION, 2024 (% SHARE)
      64. | 6.64 CHEMICALS AND MATERIALS, BY APPLICATION, 2024 TO 2035 (USD Billion)
      65. | 6.65 BENCHMARKING OF MAJOR COMPETITORS
    7. LIST OF TABLES
      1. | 7.1 LIST OF ASSUMPTIONS
      2. | | 7.1.1
      3. | 7.2 North America MARKET SIZE ESTIMATES; FORECAST
      4. | | 7.2.1 BY TYPE, 2025-2035 (USD Billion)
      5. | | 7.2.2 BY APPLICATION, 2025-2035 (USD Billion)
      6. | 7.3 US MARKET SIZE ESTIMATES; FORECAST
      7. | | 7.3.1 BY TYPE, 2025-2035 (USD Billion)
      8. | | 7.3.2 BY APPLICATION, 2025-2035 (USD Billion)
      9. | 7.4 Canada MARKET SIZE ESTIMATES; FORECAST
      10. | | 7.4.1 BY TYPE, 2025-2035 (USD Billion)
      11. | | 7.4.2 BY APPLICATION, 2025-2035 (USD Billion)
      12. | 7.5 Europe MARKET SIZE ESTIMATES; FORECAST
      13. | | 7.5.1 BY TYPE, 2025-2035 (USD Billion)
      14. | | 7.5.2 BY APPLICATION, 2025-2035 (USD Billion)
      15. | 7.6 Germany MARKET SIZE ESTIMATES; FORECAST
      16. | | 7.6.1 BY TYPE, 2025-2035 (USD Billion)
      17. | | 7.6.2 BY APPLICATION, 2025-2035 (USD Billion)
      18. | 7.7 UK MARKET SIZE ESTIMATES; FORECAST
      19. | | 7.7.1 BY TYPE, 2025-2035 (USD Billion)
      20. | | 7.7.2 BY APPLICATION, 2025-2035 (USD Billion)
      21. | 7.8 France MARKET SIZE ESTIMATES; FORECAST
      22. | | 7.8.1 BY TYPE, 2025-2035 (USD Billion)
      23. | | 7.8.2 BY APPLICATION, 2025-2035 (USD Billion)
      24. | 7.9 Russia MARKET SIZE ESTIMATES; FORECAST
      25. | | 7.9.1 BY TYPE, 2025-2035 (USD Billion)
      26. | | 7.9.2 BY APPLICATION, 2025-2035 (USD Billion)
      27. | 7.10 Italy MARKET SIZE ESTIMATES; FORECAST
      28. | | 7.10.1 BY TYPE, 2025-2035 (USD Billion)
      29. | | 7.10.2 BY APPLICATION, 2025-2035 (USD Billion)
      30. | 7.11 Spain MARKET SIZE ESTIMATES; FORECAST
      31. | | 7.11.1 BY TYPE, 2025-2035 (USD Billion)
      32. | | 7.11.2 BY APPLICATION, 2025-2035 (USD Billion)
      33. | 7.12 Rest of Europe MARKET SIZE ESTIMATES; FORECAST
      34. | | 7.12.1 BY TYPE, 2025-2035 (USD Billion)
      35. | | 7.12.2 BY APPLICATION, 2025-2035 (USD Billion)
      36. | 7.13 APAC MARKET SIZE ESTIMATES; FORECAST
      37. | | 7.13.1 BY TYPE, 2025-2035 (USD Billion)
      38. | | 7.13.2 BY APPLICATION, 2025-2035 (USD Billion)
      39. | 7.14 China MARKET SIZE ESTIMATES; FORECAST
      40. | | 7.14.1 BY TYPE, 2025-2035 (USD Billion)
      41. | | 7.14.2 BY APPLICATION, 2025-2035 (USD Billion)
      42. | 7.15 India MARKET SIZE ESTIMATES; FORECAST
      43. | | 7.15.1 BY TYPE, 2025-2035 (USD Billion)
      44. | | 7.15.2 BY APPLICATION, 2025-2035 (USD Billion)
      45. | 7.16 Japan MARKET SIZE ESTIMATES; FORECAST
      46. | | 7.16.1 BY TYPE, 2025-2035 (USD Billion)
      47. | | 7.16.2 BY APPLICATION, 2025-2035 (USD Billion)
      48. | 7.17 South Korea MARKET SIZE ESTIMATES; FORECAST
      49. | | 7.17.1 BY TYPE, 2025-2035 (USD Billion)
      50. | | 7.17.2 BY APPLICATION, 2025-2035 (USD Billion)
      51. | 7.18 Malaysia MARKET SIZE ESTIMATES; FORECAST
      52. | | 7.18.1 BY TYPE, 2025-2035 (USD Billion)
      53. | | 7.18.2 BY APPLICATION, 2025-2035 (USD Billion)
      54. | 7.19 Thailand MARKET SIZE ESTIMATES; FORECAST
      55. | | 7.19.1 BY TYPE, 2025-2035 (USD Billion)
      56. | | 7.19.2 BY APPLICATION, 2025-2035 (USD Billion)
      57. | 7.20 Indonesia MARKET SIZE ESTIMATES; FORECAST
      58. | | 7.20.1 BY TYPE, 2025-2035 (USD Billion)
      59. | | 7.20.2 BY APPLICATION, 2025-2035 (USD Billion)
      60. | 7.21 Rest of APAC MARKET SIZE ESTIMATES; FORECAST
      61. | | 7.21.1 BY TYPE, 2025-2035 (USD Billion)
      62. | | 7.21.2 BY APPLICATION, 2025-2035 (USD Billion)
      63. | 7.22 South America MARKET SIZE ESTIMATES; FORECAST
      64. | | 7.22.1 BY TYPE, 2025-2035 (USD Billion)
      65. | | 7.22.2 BY APPLICATION, 2025-2035 (USD Billion)
      66. | 7.23 Brazil MARKET SIZE ESTIMATES; FORECAST
      67. | | 7.23.1 BY TYPE, 2025-2035 (USD Billion)
      68. | | 7.23.2 BY APPLICATION, 2025-2035 (USD Billion)
      69. | 7.24 Mexico MARKET SIZE ESTIMATES; FORECAST
      70. | | 7.24.1 BY TYPE, 2025-2035 (USD Billion)
      71. | | 7.24.2 BY APPLICATION, 2025-2035 (USD Billion)
      72. | 7.25 Argentina MARKET SIZE ESTIMATES; FORECAST
      73. | | 7.25.1 BY TYPE, 2025-2035 (USD Billion)
      74. | | 7.25.2 BY APPLICATION, 2025-2035 (USD Billion)
      75. | 7.26 Rest of South America MARKET SIZE ESTIMATES; FORECAST
      76. | | 7.26.1 BY TYPE, 2025-2035 (USD Billion)
      77. | | 7.26.2 BY APPLICATION, 2025-2035 (USD Billion)
      78. | 7.27 MEA MARKET SIZE ESTIMATES; FORECAST
      79. | | 7.27.1 BY TYPE, 2025-2035 (USD Billion)
      80. | | 7.27.2 BY APPLICATION, 2025-2035 (USD Billion)
      81. | 7.28 GCC Countries MARKET SIZE ESTIMATES; FORECAST
      82. | | 7.28.1 BY TYPE, 2025-2035 (USD Billion)
      83. | | 7.28.2 BY APPLICATION, 2025-2035 (USD Billion)
      84. | 7.29 South Africa MARKET SIZE ESTIMATES; FORECAST
      85. | | 7.29.1 BY TYPE, 2025-2035 (USD Billion)
      86. | | 7.29.2 BY APPLICATION, 2025-2035 (USD Billion)
      87. | 7.30 Rest of MEA MARKET SIZE ESTIMATES; FORECAST
      88. | | 7.30.1 BY TYPE, 2025-2035 (USD Billion)
      89. | | 7.30.2 BY APPLICATION, 2025-2035 (USD Billion)
      90. | 7.31 PRODUCT LAUNCH/PRODUCT DEVELOPMENT/APPROVAL
      91. | | 7.31.1
      92. | 7.32 ACQUISITION/PARTNERSHIP
      93. | | 7.32.1

    Asia Pacific Cement Market Segmentation

    Market Segmentation Overview

    • Detailed segmentation data will be available in the full report
    • Comprehensive analysis by multiple parameters
    • Regional and country-level breakdowns
    • Market size forecasts by segment
    Infographic

    Free Sample Request

    Kindly complete the form below to receive a free sample of this Report

    Get Free Sample

    Customer Strories

    “I am very pleased with how market segments have been defined in a relevant way for my purposes (such as "Portable Freezers & refrigerators" and "last-mile"). In general the report is well structured. Thanks very much for your efforts.”

    Victoria Milne

    Founder
    Case Study
    Chemicals and Materials

    Compare Licence

    ×
    Features License Type
    Single User Multiuser License Enterprise User
    Price $4,950 $5,950 $7,250
    Maximum User Access Limit 1 User Upto 10 Users Unrestricted Access Throughout the Organization
    Free Customization
    Direct Access to Analyst
    Deliverable Format
    Platform Access
    Discount on Next Purchase 10% 15% 15%
    Printable Versions