Aramid Fiber Market (2026 - 2035)

ID: MRFR/CnM/4412-HCR 100 Pages Priya Nagrale Last Updated: October 26, 2026
Aramid Fiber Market Research Report Information By Product Type (Para Aramid and Meta Aramid), By Spinning Process (Wet Spinning and Dry Jet Wet Spinning), By Application (Security and Protection Equipment, Frictional and Brake Materials, Optical Fiber Cables, Aerospace Components, Automotive Composites, Electrical Insulation, and Others (Industrial Filtration, Rubber and Tire Reinforcement)), By End-User Industry (Safety and Protection Equipment, Aerospace, Automotive, Electronics and Telecommunication, and Other End-User Industries), And By Region (North America, Europe, Asia-Pacific, and Rest of the World) – Market Forecast Till 2035.
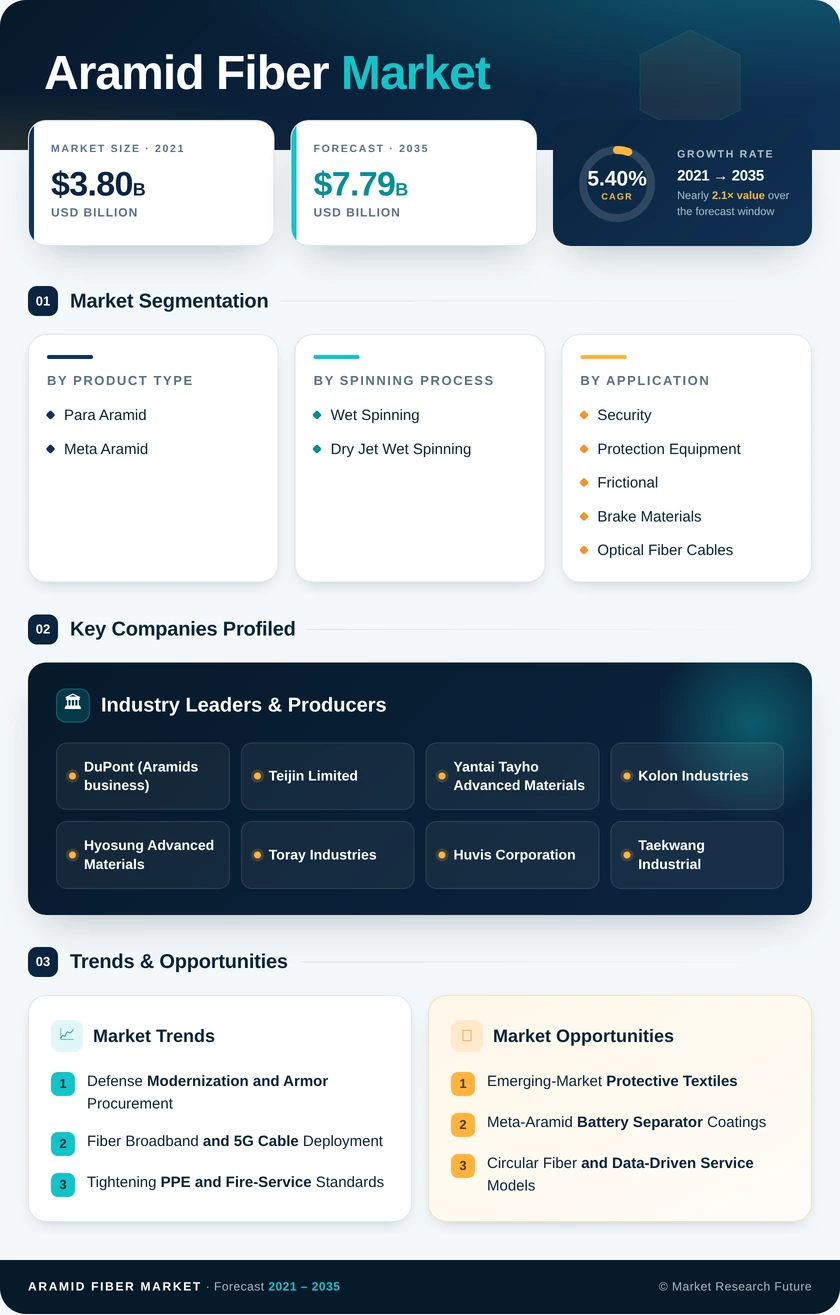
Aramid Fiber Market
Market Size
Forecast Period2026-2035
CAGR (2026-2035)5.40%
2025 Market SizeUSD 4.60 billion
2035 Market SizeUSD 7.79 billion
Key Players
DuPont
Teijin Limited
Yantai Tayho Advanced Materials
Kolon Industries
Hyosung Advanced Materials
Toray Industries
Opportunities
  • Emerging-Market Protective Textiles
  • Meta-Aramid Battery Separator Coatings
  • Circular Fiber and Data-Driven Service Models
  1. 1 Market Summary | |
  2. 2 Key Report Takeaways | |
    1. 2.1 By Product Type | |
    2. 2.2 By Spinning Process | |
    3. 2.3 By Application | |
    4. 2.4 By End User Industry | |
    5. 2.5 By Region | |
  3. 3 Market Size and Forecast (2021–2035) | |
  4. 4 Driver Impact Analysis | |
    1. 4.1 Defense Modernization and Armor Procurement | |
    2. 4.2 Fiber Broadband and 5G Cable Deployment | |
    3. 4.3 Tightening PPE and Fire-Service Standards | |
    4. 4.4 Commercial Aircraft Production Ramp | |
    5. 4.5 EV Lightweighting and Battery Thermal Protection | |
    6. 4.6 Grid and Electrical Equipment Upgrades | |
  5. 5 Restraints Impact Analysis | |
    1. 5.1 High Capital and Production Costs | |
    2. 5.2 Feedstock Price Volatility | |
    3. 5.3 Substitution by UHMWPE and Carbon Fiber | |
    4. 5.4 Trade Restrictions and Tariffs | |
    5. 5.5 Limited End-of-Life Recycling | |
  6. 6 Opportunities | |
    1. 6.1 Emerging-Market Protective Textiles | |
    2. 6.2 Meta-Aramid Battery Separator Coatings | |
    3. 6.3 Circular Fiber and Data-Driven Service Models | |
    4. 6.4 Offshore Energy and Hydrogen Storage | |
    5. 6.5 Western Supply Security Partnerships | |
  7. 7 Regional Market Share and Country-Level Analysis | |
    1. 7.1 North America | | |
      1. 7.1.1 US | | |
      2. 7.1.2 Canada | | |
      3. 7.1.3 Mexico | |
    2. 7.2 Europe | | |
      1. 7.2.1 Germany | | |
      2. 7.2.2 UK | | |
      3. 7.2.3 France | | |
      4. 7.2.4 Italy | | |
      5. 7.2.5 Spain | | |
      6. 7.2.6 Nordic Countries | | |
      7. 7.2.7 Russia | | |
      8. 7.2.8 Rest of Europe | |
    3. 7.3 Asia-Pacific | | |
      1. 7.3.1 China | | |
      2. 7.3.2 India | | |
      3. 7.3.3 Japan | | |
      4. 7.3.4 South Korea | | |
      5. 7.3.5 ASEAN | | |
      6. 7.3.6 Rest of Asia-Pacific | |
    4. 7.4 South America | | |
      1. 7.4.1 Brazil | | |
      2. 7.4.2 Argentina | | |
      3. 7.4.3 Rest of South America | |
    5. 7.5 Middle East & Africa | | |
      1. 7.5.1 Saudi Arabia | | |
      2. 7.5.2 UAE | | |
      3. 7.5.3 South Africa | | |
      4. 7.5.4 Egypt | | |
      5. 7.5.5 Rest of MEA | |
  8. 8 Future Outlook (2026–2035) | |
    1. 8.1 Defense Spending as a Structural Demand Floor | |
    2. 8.2 AI Data Centers and Network Densification | |
    3. 8.3 Electrification Supercycle | |
    4. 8.4 Sustainability and Low-Carbon Production | |
  9. 9 Segmentation Analysis | |
    1. 9.1 By Product Type | | |
      1. 9.1.1 Para Aramid | | |
      2. 9.1.2 Meta Aramid | |
    2. 9.2 By Spinning Process | | |
      1. 9.2.1 Wet Spinning | | |
      2. 9.2.2 Dry Jet Wet Spinning | |
    3. 9.3 By Application | | |
      1. 9.3.1 Security and Protection Equipment | | |
      2. 9.3.2 Frictional and Brake Materials | | |
      3. 9.3.3 Optical Fiber Cables | | |
      4. 9.3.4 Aerospace Components | | |
      5. 9.3.5 Automotive Composites | | |
      6. 9.3.6 Electrical Insulation | | |
      7. 9.3.7 Others (industrial filtration, rubber and tire reinforcement) | |
    4. 9.4 By End User Industry | | |
      1. 9.4.1 Safety and Protection Equipment | | |
      2. 9.4.2 Aerospace | | |
      3. 9.4.3 Automotive | | |
      4. 9.4.4 Electronics and Telecommunication | | |
      5. 9.4.5 Other End User Industries | |
  10. 10 Competitive Landscape | |
  11. 11 Recent News & Developments | |
  12. 12 Report Scope and Methodology | |
  13. 13 Detailed Sources and Citations | |
  14. 14 Frequently Asked Questions (FAQs) | | LIST OF TABLES | |
  15. TABLE 1 Report Snapshot – Key Market Metrics, 2025–2035 | |
  16. TABLE 2 Global Market Size & Forecast, by Revenue (USD billion), 2021–2035 | |
  17. TABLE 3 Driver Impact Analysis on CAGR, 2026–2035 | |
  18. TABLE 4 Restraints Impact Analysis on CAGR, 2026–2035 | |
  19. TABLE 5 Regional Summary, 2025 | |
  20. TABLE 6 North America – Country-Level Analysis, 2025 | |
  21. TABLE 7 Europe – Country-Level Analysis, 2025 | |
  22. TABLE 8 Asia-Pacific – Country-Level Analysis, 2025 | |
  23. TABLE 9 South America – Country-Level Analysis, 2025 | |
  24. TABLE 10 Middle East & Africa – Country-Level Analysis, 2025 | |
  25. TABLE 11 Market Segmentation, by Product Type, 2025 | |
  26. TABLE 12 Market Segmentation, by Spinning Process, 2025 | |
  27. TABLE 13 Market Segmentation, by Application, 2025 | |
  28. TABLE 14 Market Segmentation, by End User Industry, 2025 | |
  29. TABLE 15 Competitive Benchmarking Matrix, 2025 | |
  30. TABLE 16 Report Scope and Methodology | |
  31. TABLE 17 Detailed Sources and Citations | | LIST OF FIGURES | |
  32. FIGURE 1 Market Dynamics Overview – Drivers, Restraints and Opportunities | |
  33. FIGURE 2 Industry Value Chain Analysis | |
  34. FIGURE 3 Porter's Five Forces Analysis | |
  35. FIGURE 4 Global Market Size Trend, 2021–2035 (USD billion) | |
  36. FIGURE 5 Year-over-Year Growth Rate, 2022–2035 | |
  37. FIGURE 6 Market Share, by Product Type, 2025 | |
  38. FIGURE 7 Market Share, by Spinning Process, 2025 | |
  39. FIGURE 8 Market Share, by Application, 2025 | |
  40. FIGURE 9 Market Share, by End User Industry, 2025 | |
  41. FIGURE 10 Regional Market Share, 2025 | |
  42. FIGURE 11 Regional Growth Comparison, 2026–2035 | |
  43. FIGURE 12 Competitive Landscape – Estimated Revenue Share Ranges, 2025

Segmentation Quick Reference

DimensionSub-SegmentsDominant SegmentFastest Growing Segment
By Product TypePara Aramid; Meta AramidPara Aramid (68.4% share)Meta Aramid (5.7% CAGR)
By Spinning ProcessWet Spinning; Dry Jet Wet SpinningWet Spinning (63.6% share)Wet Spinning (63.6% share; growing above market)
By ApplicationSecurity and Protection Equipment; Frictional and Brake Materials; Optical Fiber Cables; Aerospace Components; Automotive Composites; Electrical Insulation; Others (industrial filtration, rubber and tire reinforcement)Security and Protection Equipment (39.0% share)Optical Fiber Cables (5.8% CAGR)
By End User IndustrySafety and Protection Equipment; Aerospace; Automotive; Electronics and Telecommunication; Other End User IndustriesAerospace (6.3% CAGR; largest end user)Aerospace (6.3% CAGR)
By RegionNorth America; Europe; Asia-Pacific; South America; Middle East & AfricaEurope (33.5% share)North America (5.9% CAGR)

Market Segmentation Overview

By Product Type

Sub-SegmentKey Trend
Para AramidDefense armor and cable reinforcement sustain volume; new Korean and Chinese capacity adds price competition.
Meta AramidTransformer papers, hot-gas filtration and turnout gear drive above-market growth

Para Aramid leads with a 68.4% share because ballistic, friction and cable buyers prize its tensile strength and modulus. Meta Aramid grows fastest at a 5.7% CAGR as transformer, filtration and firefighting specifications reward thermal stability over raw strength.

By Spinning Process

Sub-SegmentKey Trend
Wet SpinningSolvent-recovery upgrades lower costs for meta-aramid filament and paper feedstock
Dry Jet Wet SpinningLine upgrades target higher-modulus ballistic and aerospace yarn.

Wet Spinning leads with a 63.6% share and also outpaces the market, since meta-aramid papers and filter media depend on its uniform, dielectric-stable fibers. Dry Jet Wet Spinning remains essential for high-modulus para-aramid filament in armor and aerospace, where chain orientation matters more than throughput.

By Application

Sub-SegmentKey Trend
Security and Protection EquipmentLighter multilayer armor and updated NIJ and NFPA standards drive refresh cycles.
Frictional and Brake MaterialsAramid pulp replaces copper in low-dust brake pads.
Optical Fiber CablesAll-dielectric FTTH and backhaul cables expand yarn demand.
Aerospace ComponentsNarrowbody build-rate recovery lifts honeycomb core orders.
Automotive CompositesEV battery enclosures and lightweight inserts gain traction
Electrical InsulationTransformer replacement and data-center substations raise paper demand.
Others (industrial filtration, rubber and tire reinforcement)Emission rules sustain hot-gas filter bags; tires and hoses provide steady base volume

Security and Protection Equipment leads with a 39.0% share, sustained by armor procurement and PPE certification rules. Optical Fiber Cables grow fastest at a 5.8% CAGR because all-dielectric FTTH and backhaul designs rely on aramid yarn to absorb pulling loads. Electrical Insulation and Frictional and Brake Materials provide stable mid-tier volumes.

By End User Industry

Sub-SegmentKey Trend
Safety and Protection EquipmentStricter fire, police and industrial PPE standards widen adoption
AerospaceRising aircraft output and military platforms consume honeycomb and ballistic laminates.
AutomotiveBrake pads, hoses and battery barriers diversify demand.
Electronics and TelecommunicationCable reinforcement and circuit-board substrates expand with 5G.
Other End User IndustriesFiltration, oil and gas, and marine ropes add niche tonnage.

Aerospace leads and grows fastest at a 6.3% CAGR, as rising aircraft build rates and military platforms consume honeycomb cores and ballistic laminates. Safety and Protection Equipment follows as the second-largest buyer, while Automotive and Electronics and Telecommunication gain from battery barriers and circuit-board reinforcement.


Download PDF ×

We do not share your information with anyone. However, we may send you emails based on your report interest from time to time. You may contact us at any time to opt-out.