Request Free Sample ×

Kindly complete the form below to receive a free sample of this Report

* Please use a valid business email

Leading companies partner with us for data-driven Insights

clients tt-cursor
Hero Background

APAC Genset Market

ID: MRFR/EnP/46931-HCR
200 Pages
Chitranshi Jaiswal
Last Updated: April 06, 2026

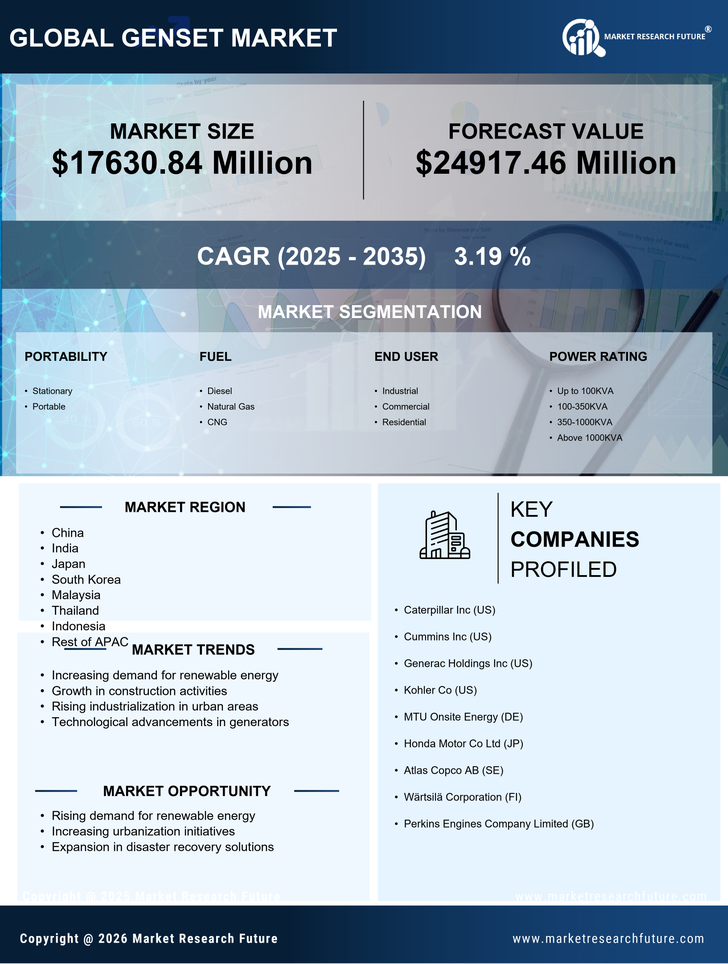
APAC Genset Market Research Report By Portability (Stationary, Portable), By Fuel (Diesel, Natural Gas, CNG), By End User (Industrial, Commercial, Residential), By Power Rating (Up to 100KVA, 100-350KVA, 350-1000KVA, Above 1000 KVA), By Application (Agriculture, Construction, Forestry, Industrial, Pumps, Power Generation) and By Regional (China, India, Japan, South Korea, Malaysia, Thailand, Indonesia, Rest of APAC)-Forecast to 2035

Share:
Download PDF ×

We do not share your information with anyone. However, we may send you emails based on your report interest from time to time. You may contact us at any time to opt-out.

APAC Genset Market Infographic
Purchase Options
  1. 1 SECTION I: EXECUTIVE SUMMARY AND KEY HIGHLIGHTS
  2.   1.1 EXECUTIVE SUMMARY
  3.     1.1.1 Market Overview
  4.     1.1.2 Key Findings
  5.     1.1.3 Market Segmentation
  6.     1.1.4 Competitive Landscape
  7.     1.1.5 Challenges and Opportunities
  8.     1.1.6 Future Outlook
  9. 2 SECTION II: SCOPING, METHODOLOGY AND MARKET STRUCTURE
  10.   2.1 MARKET INTRODUCTION
  11.     2.1.1 Definition
  12.     2.1.2 Scope of the study
  13.       2.1.2.1 Research Objective
  14.       2.1.2.2 Assumption
  15.       2.1.2.3 Limitations
  16.   2.2 RESEARCH METHODOLOGY
  17.     2.2.1 Overview
  18.     2.2.2 Data Mining
  19.     2.2.3 Secondary Research
  20.     2.2.4 Primary Research
  21.       2.2.4.1 Primary Interviews and Information Gathering Process
  22.       2.2.4.2 Breakdown of Primary Respondents
  23.     2.2.5 Forecasting Model
  24.     2.2.6 Market Size Estimation
  25.       2.2.6.1 Bottom-Up Approach
  26.       2.2.6.2 Top-Down Approach
  27.     2.2.7 Data Triangulation
  28.     2.2.8 Validation
  29. 3 SECTION III: QUALITATIVE ANALYSIS
  30.   3.1 MARKET DYNAMICS
  31.     3.1.1 Overview
  32.     3.1.2 Drivers
  33.     3.1.3 Restraints
  34.     3.1.4 Opportunities
  35.   3.2 MARKET FACTOR ANALYSIS
  36.     3.2.1 Value chain Analysis
  37.     3.2.2 Porter's Five Forces Analysis
  38.       3.2.2.1 Bargaining Power of Suppliers
  39.       3.2.2.2 Bargaining Power of Buyers
  40.       3.2.2.3 Threat of New Entrants
  41.       3.2.2.4 Threat of Substitutes
  42.       3.2.2.5 Intensity of Rivalry
  43.     3.2.3 COVID-19 Impact Analysis
  44.       3.2.3.1 Market Impact Analysis
  45.       3.2.3.2 Regional Impact
  46.       3.2.3.3 Opportunity and Threat Analysis
  47. 4 SECTION IV: QUANTITATIVE ANALYSIS
  48.   4.1 Security, Access Control and Robotics, BY Portability (USD Million)
  49.     4.1.1 Stationary
  50.     4.1.2 Portable
  51.   4.2 Security, Access Control and Robotics, BY Fuel (USD Million)
  52.     4.2.1 Diesel
  53.     4.2.2 Natural Gas
  54.     4.2.3 CNG
  55.   4.3 Security, Access Control and Robotics, BY End User (USD Million)
  56.     4.3.1 Industrial
  57.     4.3.2 Commercial
  58.     4.3.3 Residential
  59.   4.4 Security, Access Control and Robotics, BY Power Rating (USD Million)
  60.     4.4.1 Up to 100KVA
  61.     4.4.2 100-350KVA
  62.     4.4.3 350-1000KVA
  63.     4.4.4 Above 1000KVA
  64.   4.5 Security, Access Control and Robotics, BY Application (USD Million)
  65.     4.5.1 Agriculture
  66.     4.5.2 Construction
  67.     4.5.3 Forestry
  68.     4.5.4 Industrial
  69.     4.5.5 Pumps
  70.     4.5.6 Power Generation
  71. 5 SECTION V: COMPETITIVE ANALYSIS
  72.   5.1 Competitive Landscape
  73.     5.1.1 Overview
  74.     5.1.2 Competitive Analysis
  75.     5.1.3 Market share Analysis
  76.     5.1.4 Major Growth Strategy in the Security, Access Control and Robotics
  77.     5.1.5 Competitive Benchmarking
  78.     5.1.6 Leading Players in Terms of Number of Developments in the Security, Access Control and Robotics
  79.     5.1.7 Key developments and growth strategies
  80.       5.1.7.1 New Product Launch/Service Deployment
  81.       5.1.7.2 Merger & Acquisitions
  82.       5.1.7.3 Joint Ventures
  83.     5.1.8 Major Players Financial Matrix
  84.       5.1.8.1 Sales and Operating Income
  85.       5.1.8.2 Major Players R&D Expenditure. 2023
  86.   5.2 Company Profiles
  87.     5.2.1 Caterpillar Inc (US)
  88.       5.2.1.1 Financial Overview
  89.       5.2.1.2 Products Offered
  90.       5.2.1.3 Key Developments
  91.       5.2.1.4 SWOT Analysis
  92.       5.2.1.5 Key Strategies
  93.     5.2.2 Cummins Inc (US)
  94.       5.2.2.1 Financial Overview
  95.       5.2.2.2 Products Offered
  96.       5.2.2.3 Key Developments
  97.       5.2.2.4 SWOT Analysis
  98.       5.2.2.5 Key Strategies
  99.     5.2.3 Generac Holdings Inc (US)
  100.       5.2.3.1 Financial Overview
  101.       5.2.3.2 Products Offered
  102.       5.2.3.3 Key Developments
  103.       5.2.3.4 SWOT Analysis
  104.       5.2.3.5 Key Strategies
  105.     5.2.4 Kohler Co (US)
  106.       5.2.4.1 Financial Overview
  107.       5.2.4.2 Products Offered
  108.       5.2.4.3 Key Developments
  109.       5.2.4.4 SWOT Analysis
  110.       5.2.4.5 Key Strategies
  111.     5.2.5 MTU Onsite Energy (DE)
  112.       5.2.5.1 Financial Overview
  113.       5.2.5.2 Products Offered
  114.       5.2.5.3 Key Developments
  115.       5.2.5.4 SWOT Analysis
  116.       5.2.5.5 Key Strategies
  117.     5.2.6 Honda Motor Co Ltd (JP)
  118.       5.2.6.1 Financial Overview
  119.       5.2.6.2 Products Offered
  120.       5.2.6.3 Key Developments
  121.       5.2.6.4 SWOT Analysis
  122.       5.2.6.5 Key Strategies
  123.     5.2.7 Atlas Copco AB (SE)
  124.       5.2.7.1 Financial Overview
  125.       5.2.7.2 Products Offered
  126.       5.2.7.3 Key Developments
  127.       5.2.7.4 SWOT Analysis
  128.       5.2.7.5 Key Strategies
  129.     5.2.8 Wärtsilä Corporation (FI)
  130.       5.2.8.1 Financial Overview
  131.       5.2.8.2 Products Offered
  132.       5.2.8.3 Key Developments
  133.       5.2.8.4 SWOT Analysis
  134.       5.2.8.5 Key Strategies
  135.     5.2.9 Perkins Engines Company Limited (GB)
  136.       5.2.9.1 Financial Overview
  137.       5.2.9.2 Products Offered
  138.       5.2.9.3 Key Developments
  139.       5.2.9.4 SWOT Analysis
  140.       5.2.9.5 Key Strategies
  141.   5.3 Appendix
  142.     5.3.1 References
  143.     5.3.2 Related Reports
  144. 6 LIST OF FIGURES
  145.   6.1 MARKET SYNOPSIS
  146.   6.2 APAC MARKET ANALYSIS BY PORTABILITY
  147.   6.3 APAC MARKET ANALYSIS BY FUEL
  148.   6.4 APAC MARKET ANALYSIS BY END USER
  149.   6.5 APAC MARKET ANALYSIS BY POWER RATING
  150.   6.6 APAC MARKET ANALYSIS BY APPLICATION
  151.   6.7 KEY BUYING CRITERIA OF SECURITY, ACCESS CONTROL AND ROBOTICS
  152.   6.8 RESEARCH PROCESS OF MRFR
  153.   6.9 DRO ANALYSIS OF SECURITY, ACCESS CONTROL AND ROBOTICS
  154.   6.10 DRIVERS IMPACT ANALYSIS: SECURITY, ACCESS CONTROL AND ROBOTICS
  155.   6.11 RESTRAINTS IMPACT ANALYSIS: SECURITY, ACCESS CONTROL AND ROBOTICS
  156.   6.12 SUPPLY / VALUE CHAIN: SECURITY, ACCESS CONTROL AND ROBOTICS
  157.   6.13 SECURITY, ACCESS CONTROL AND ROBOTICS, BY PORTABILITY, 2024 (% SHARE)
  158.   6.14 SECURITY, ACCESS CONTROL AND ROBOTICS, BY PORTABILITY, 2024 TO 2035 (USD Million)
  159.   6.15 SECURITY, ACCESS CONTROL AND ROBOTICS, BY FUEL, 2024 (% SHARE)
  160.   6.16 SECURITY, ACCESS CONTROL AND ROBOTICS, BY FUEL, 2024 TO 2035 (USD Million)
  161.   6.17 SECURITY, ACCESS CONTROL AND ROBOTICS, BY END USER, 2024 (% SHARE)
  162.   6.18 SECURITY, ACCESS CONTROL AND ROBOTICS, BY END USER, 2024 TO 2035 (USD Million)
  163.   6.19 SECURITY, ACCESS CONTROL AND ROBOTICS, BY POWER RATING, 2024 (% SHARE)
  164.   6.20 SECURITY, ACCESS CONTROL AND ROBOTICS, BY POWER RATING, 2024 TO 2035 (USD Million)
  165.   6.21 SECURITY, ACCESS CONTROL AND ROBOTICS, BY APPLICATION, 2024 (% SHARE)
  166.   6.22 SECURITY, ACCESS CONTROL AND ROBOTICS, BY APPLICATION, 2024 TO 2035 (USD Million)
  167.   6.23 BENCHMARKING OF MAJOR COMPETITORS
  168. 7 LIST OF TABLES
  169.   7.1 LIST OF ASSUMPTIONS
  170.     7.1.1
  171.   7.2 APAC MARKET SIZE ESTIMATES; FORECAST
  172.     7.2.1 BY PORTABILITY, 2025-2035 (USD Million)
  173.     7.2.2 BY FUEL, 2025-2035 (USD Million)
  174.     7.2.3 BY END USER, 2025-2035 (USD Million)
  175.     7.2.4 BY POWER RATING, 2025-2035 (USD Million)
  176.     7.2.5 BY APPLICATION, 2025-2035 (USD Million)
  177.   7.3 PRODUCT LAUNCH/PRODUCT DEVELOPMENT/APPROVAL
  178.     7.3.1
  179.   7.4 ACQUISITION/PARTNERSHIP
  180.     7.4.1

APAC Security, Access Control and Robotics Market Segmentation

Security, Access Control and Robotics By Portability (USD Million, 2025-2035)

  • Stationary
  • Portable

Security, Access Control and Robotics By Fuel (USD Million, 2025-2035)

  • Diesel
  • Natural Gas
  • CNG

Security, Access Control and Robotics By End User (USD Million, 2025-2035)

  • Industrial
  • Commercial
  • Residential

Security, Access Control and Robotics By Power Rating (USD Million, 2025-2035)

  • Up to 100KVA
  • 100-350KVA
  • 350-1000KVA
  • Above 1000KVA

Security, Access Control and Robotics By Application (USD Million, 2025-2035)

  • Agriculture
  • Construction
  • Forestry
  • Industrial
  • Pumps
  • Power Generation

Compare Licence

×
Features License Type
Single User Multiuser License Enterprise User
Price $4,950 $5,950 $7,250
Maximum User Access Limit 1 User Upto 10 Users Unrestricted Access Throughout the Organization
Free Customization
Direct Access to Analyst
Deliverable Format
Platform Access
Discount on Next Purchase 10% 15% 15%
Printable Versions