Certified Global Research Member
Isomar fd.webp Wcrc 57.webp
Key Questions Answered
  • Global Market Outlook
  • In-depth analysis of global and regional trends
  • Analyze and identify the major players in the market, their market share, key developments, etc.
  • To understand the capability of the major players based on products offered, financials, and strategies.
  • Identify disrupting products, companies, and trends.
  • To identify opportunities in the market.
  • Analyze the key challenges in the market.
  • Analyze the regional penetration of players, products, and services in the market.
  • Comparison of major players’ financial performance.
  • Evaluate strategies adopted by major players.
  • Recommendations
Why Choose Market Research Future?
  • Vigorous research methodologies for specific market.
  • Knowledge partners across the globe
  • Large network of partner consultants.
  • Ever-increasing/ Escalating data base with quarterly monitoring of various markets
  • Trusted by fortune 500 companies/startups/ universities/organizations
  • Large database of 5000+ markets reports.
  • Effective and prompt pre- and post-sales support.

Global 
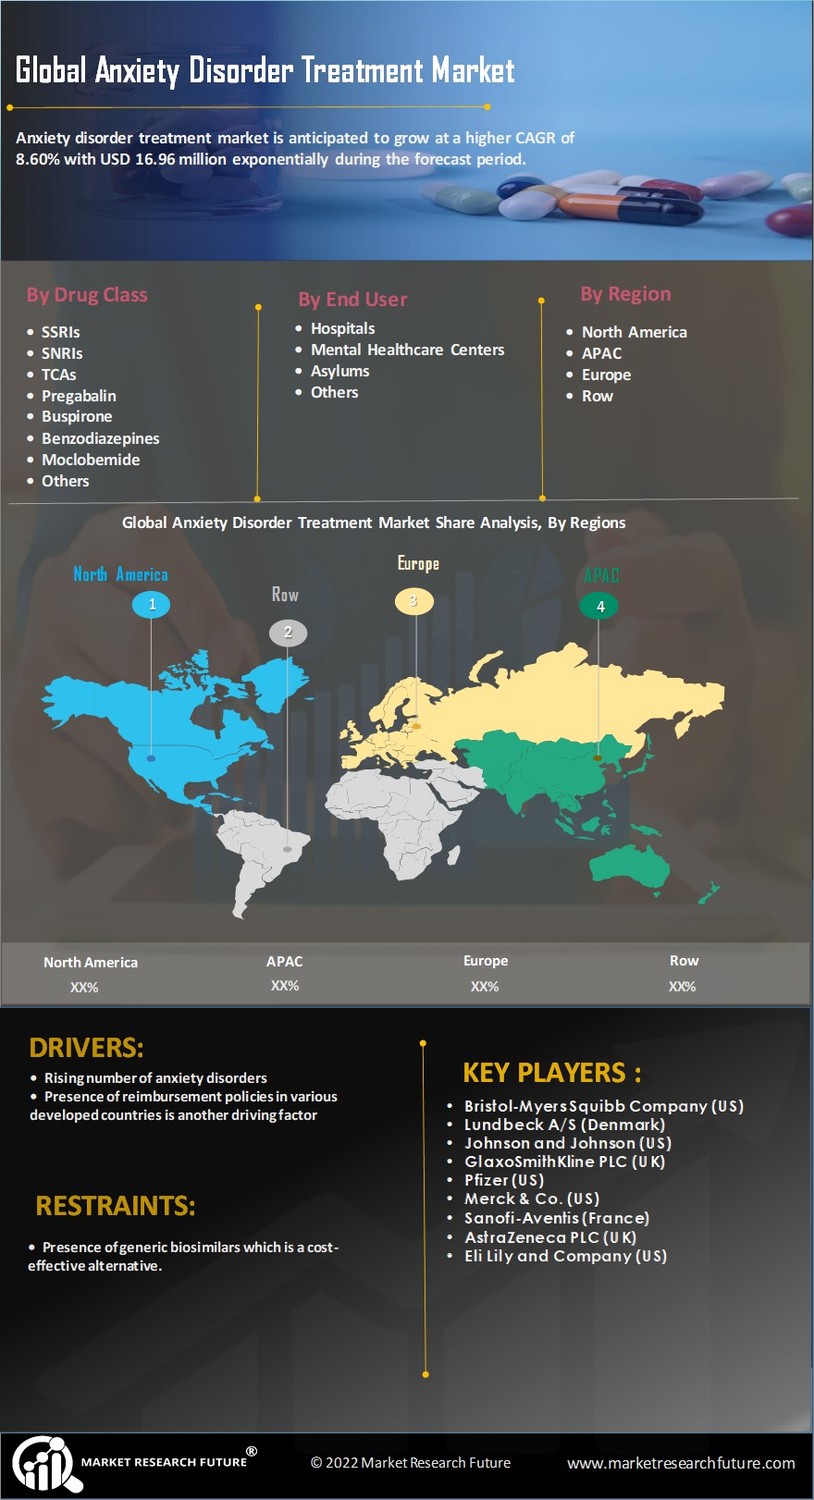
Anxiety Disorder Treatment Market Research Report Information By Drug Class (SSRIs, SNRIs, TCAs, Pregabalin, Buspirone, Benzodiazepines, Moclobemide, Others) and By End-User (Hospitals, Mental Healthcare Centers, Asylums, Others) – Forecast to 2032


ID: MRFR/HC/6983-HCR | 100 Pages | Author: Rahul Gotadki| April 2024
Leading companies partner with us for data-driven Insights
client_1 client_2 client_3 client_4 client_5 client_6 client_7 client_8 client_9 client_10
Please fill in Business Email for Quick Response

Table of Contents

1. REPORT PROLOGUE

2. MARKET INTRODUCTION

2.1. Definition

2.2. Scope of the Study

2.2.1. Research Objective

2.2.2. Assumptions

2.2.3. Limitations

3. RESEARCH METHODOLOGY

3.1. Overview

3.2. Primary Research

3.3. Secondary Research

3.4. Market Size Estimation

4. MARKET DYNAMICS

4.1. Overview

4.2. Drivers

4.3. Restraints

4.4. Opportunities

5. MARKET FACTOR ANALYSIS

5.1. Porter’s Five Forces Analysis

5.1.1. Bargaining Power of Suppliers

5.1.2. Bargaining Power of Buyers

5.1.3. Threat of New Entrants

5.1.4. Threat of Substitutes

5.1.5. Intensity of Rivalry

5.2. Value Chain Analysis

6. GLOBAL ANXIETY DISORDER TREATMENT MARKET, BY DRUG CLASS

6.1. Overview

6.2. SSRIs (Selective Serotonin Reuptake Inhibitors)

Market Estimates & Forecast, by Region, 2020-2027

Market Estimates & Forecast, by Country, 2020-2027

6.3. SNRIs (Serotonin-Norepinephrine Reuptake Inhibitors)

Market Estimates & Forecast, by Region, 2020-2027

Market Estimates & Forecast, by Country, 2020-2027

6.4. TCAs (Tricyclic Antidepressants)

Market Estimates & Forecast, by Region, 2020-2027

Market Estimates & Forecast, by Country, 2020-2027

6.5. Pregabalin

Market Estimates & Forecast, by Region, 2020-2027

Market Estimates & Forecast, by Country, 2020-2027

6.6. Buspirone

Market Estimates & Forecast, by Region, 2020-2027

Market Estimates & Forecast, by Country, 2020-2027

6.7. Benzodiazepines

Market Estimates & Forecast, by Region, 2020-2027

Market Estimates & Forecast, by Country, 2020-2027

6.8. Moclobemide

Market Estimates & Forecast, by Region, 2020-2027

Market Estimates & Forecast, by Country, 2020-2027

6.9. Others

Market Estimates & Forecast, by Region, 2020-2027

Market Estimates & Forecast, by Country, 2020-2027

7. GLOBAL ANXIETY DISORDER TREATMENT MARKET, BY END USER

7.1. Overview

7.2. Hospitals

Market Estimates & Forecast, by Region, 2020-2027

Market Estimates & Forecast, by Country, 2020-2027

7.3. Mental Healthcare Centers

Market Estimates & Forecast, by Region, 2020-2027

Market Estimates & Forecast, by Country, 2020-2027

7.4. Asylums

Market Estimates & Forecast, by Region, 2020-2027

Market Estimates & Forecast, by Country, 2020-2027

7.5. Others

Market Estimates & Forecast, by Region, 2020-2027

Market Estimates & Forecast, by Country, 2020-2027

8. GLOBAL ANXIETY DISORDER TREATMENT MARKET, BY REGION

8.1. Overview

8.2. Americas

8.2.1. North America

8.2.1.1. US

8.2.1.2. Canada

8.2.2. Latin America

8.3. Europe

8.3.1. Western Europe

8.3.1.1. Germany

8.3.1.2. France

8.3.1.3. Italy

8.3.1.4. Spain

8.3.1.5. UK

8.3.1.6. Rest of Western Europe

8.3.2. Eastern Europe

8.4. Asia-Pacific

8.4.1. Japan

8.4.2. China

8.4.3. India

8.4.4. Australia

8.4.5. South Korea

8.4.6. Rest of Asia-Pacific

8.5. Middle East & Africa

8.5.1. Middle East

8.5.2. Africa

9. COMPANY LANDSCAPE

9.1.1. Overview

9.1.2. Competitive Analysis

10. COMPANY PROFILES

10.1. Eli Lilly and Company

10.1.1. Company Overview

10.1.2. Product Type Overview

10.1.3. Financial Overview

10.1.4. Key Developments

10.1.5. SWOT Analysis

10.1.6. Key Strategies

10.2. Forest Laboratories, Inc.

10.2.1. Company Overview

10.2.2. Product Type Overview

10.2.3. Financial Overview

10.2.4. Key Developments

10.2.5. SWOT Analysis

10.2.6. Key Strategies

10.3. AstraZeneca PLC

10.3.1. Company Overview

10.3.2. Product Type Overview

10.3.3. Financial Overview

10.3.4. Key Developments

10.3.5. SWOT Analysis

10.3.6. Key Strategies

10.4. Sanofi-Aventis

10.4.1. Company Overview

10.4.2. Product Type Overview

10.4.3. Financial Overview

10.4.4. Key Developments

10.4.5. SWOT Analysis

10.4.6. Key Strategies

10.5. Merck & Co., Inc.

10.5.1. Company Overview

10.5.2. Product Type Overview

10.5.3. Financial Overview

10.5.4. Key Developments

10.5.5. SWOT Analysis

10.5.6. Key Strategies

10.6. Pfizer, Inc.

10.6.1. Company Overview

10.6.2. Product Type Overview

10.6.3. Financial Overview

10.6.4. Key Developments

10.6.5. SWOT Analysis

10.6.6. Key Strategies

10.7. GlaxoSmithKline PLC

10.7.1. Company Overview

10.7.2. Product Type Overview

10.7.3. Financial Overview

10.7.4. Key Developments

10.7.5. SWOT Analysis

10.7.6. Key Strategies

10.8. Johnson & Johnson

10.8.1. Company Overview

10.8.2. Product Type Overview

10.8.3. Financial Overview

10.8.4. Key Developments

10.8.5. SWOT Analysis

10.8.6. Key Strategies

10.9. Lundbeck A/S

10.9.1. Company Overview

10.9.2. Product Type Overview

10.9.3. Financial Overview

10.9.4. Key Developments

10.9.5. SWOT Analysis

10.9.6. Key Strategies

10.10. Bristol-Myers Squibb Company

10.10.1. Company Overview

10.10.2. Product Type Overview

10.10.3. Financial Overview

10.10.4. Key Developments

10.10.5. SWOT Analysis

10.10.6. Key Strategies

10.11. Others

11. APPENDIX

11.1. References

11.2. Related Reports

LIST OF TABLES

TABLE 1 GLOBAL ANXIETY DISORDER TREATMENT MARKET SYNOPSIS, 2020-2027

TABLE 2 GLOBAL ANXIETY DISORDER TREATMENT MARKET ESTIMATES & FORECAST, 2020-2027 (USD MILLION)

TABLE 3 GLOBAL ANXIETY DISORDER TREATMENT MARKET, BY DRUG CLASS, 2020-2027 (USD MILLION)

TABLE 4 GLOBAL ANXIETY DISORDER TREATMENT MARKET, BY END USER, 2020-2027 (USD MILLION)

TABLE 5 GLOBAL ANXIETY DISORDER TREATMENT MARKET, BY REGION, 2020-2027 (USD MILLION)

TABLE 6 NORTH AMERICA: ANXIETY DISORDER TREATMENT MARKET, BY DRUG CLASS, 2020-2027 (USD MILLION)

TABLE 7 NORTH AMERICA: ANXIETY DISORDER TREATMENT MARKET, BY END USER, 2020-2027 (USD MILLION)

TABLE 8 US: ANXIETY DISORDER TREATMENT MARKET, BY DRUG CLASS, 2020-2027 (USD MILLION)

TABLE 9 US: ANXIETY DISORDER TREATMENT MARKET, BY END USER, 2020-2027 (USD MILLION)

TABLE 10 CANADA: ANXIETY DISORDER TREATMENT MARKET, BY DRUG CLASS, 2020-2027 (USD MILLION)

TABLE 11 CANADA: ANXIETY DISORDER TREATMENT MARKET, BY END USER, 2020-2027 (USD MILLION)

TABLE 12 LATIN AMERICA: ANXIETY DISORDER TREATMENT MARKET, BY DRUG CLASS, 2020-2027 (USD MILLION)

TABLE 13 LATIN AMERICA: ANXIETY DISORDER TREATMENT MARKET, BY END USER, 2020-2027 (USD MILLION)

TABLE 14 EUROPE: ANXIETY DISORDER TREATMENT MARKET, BY DRUG CLASS, 2020-2027 (USD MILLION)

TABLE 15 EUROPE: ANXIETY DISORDER TREATMENT MARKET, BY END USER, 2020-2027 (USD MILLION)

TABLE 16 WESTERN EUROPE: ANXIETY DISORDER TREATMENT MARKET, BY DRUG CLASS, 2020-2027 (USD MILLION)

TABLE 17 WESTERN EUROPE: ANXIETY DISORDER TREATMENT MARKET, BY END USER, 2020-2027 (USD MILLION)

TABLE 18 EASTERN EUROPE: ANXIETY DISORDER TREATMENT MARKET, BY DRUG CLASS, 2020-2027 (USD MILLION)

TABLE 19 EASTERN EUROPE: ANXIETY DISORDER TREATMENT MARKET, BY END USER, 2020-2027 (USD MILLION)

TABLE 20 ASIA-PACIFIC: ANXIETY DISORDER TREATMENT MARKET, BY DRUG CLASS, 2020-2027 (USD MILLION)

TABLE 21 ASIA-PACIFIC: ANXIETY DISORDER TREATMENT MARKET, BY END USER, 2020-2027 (USD MILLION)

TABLE 22 MIDDLE EAST & AFRICA: ANXIETY DISORDER TREATMENT MARKET, BY DRUG CLASS, 2020-2027 (USD MILLION)

TABLE 23 MIDDLE EAST & AFRICA: ANXIETY DISORDER TREATMENT MARKET, BY END USER, 2020-2027 (USD MILLION)

LIST OF FIGURES

FIGURE 1 RESEARCH PROCESS

FIGURE 2 MARKET STRUCTURE FOR THE GLOBAL ANXIETY DISORDER TREATMENT MARKET

FIGURE 3 MARKET DYNAMICS FOR THE GLOBAL ANXIETY DISORDER TREATMENT MARKET

FIGURE 4 GLOBAL ANXIETY DISORDER TREATMENT MARKET SHARE, BY DRUG CLASS, 2018 (%)

FIGURE 5 GLOBAL ANXIETY DISORDER TREATMENT MARKET SHARE, BY END USER, 2018 (%)

FIGURE 6 GLOBAL ANXIETY DISORDER TREATMENT MARKET SHARE, BY REGION, 2018 (%)

FIGURE 7 AMERICAS: ANXIETY DISORDER TREATMENT MARKET SHARE BY REGION, 2018 (%)

FIGURE 7 NORTH AMERICA: ANXIETY DISORDER TREATMENT MARKET SHARE, BY COUNTRY, 2018 (%)

FIGURE 8 EUROPE: ANXIETY DISORDER TREATMENT MARKET SHARE, BY REGION, 2018 (%)

FIGURE 9 WESTERN EUROPE: ANXIETY DISORDER TREATMENT MARKET SHARE, BY COUNTRY, 2018 (%)

FIGURE 10 ASIA-PACIFIC: ANXIETY DISORDER TREATMENT MARKET SHARE, BY COUNTRY, 2018 (%)

FIGURE 11 MIDDLE EAST & AFRICA: ANXIETY DISORDER TREATMENT MARKET SHARE, BY COUNTRY, 2018 (%)

FIGURE 12 GLOBAL ANXIETY DISORDER TREATMENT MARKET: COMPANY SHARE ANALYSIS, 2018 (%)

FIGURE 13 ELI LILLY AND COMPANY: KEY FINANCIALS

FIGURE 14 ELI LILLY AND COMPANY: SEGMENTAL REVENUE

FIGURE 15 ELI LILLY AND COMPANY: REGIONAL REVENUE

FIGURE 16 FOREST LABORATORIES, INC.: KEY FINANCIALS

FIGURE 17 FOREST LABORATORIES, INC.: SEGMENTAL REVENUE

FIGURE 18 FOREST LABORATORIES, INC.: REGIONAL REVENUE

FIGURE 19 ASTRAZENECA PLC: KEY FINANCIALS

FIGURE 20 ASTRAZENECA PLC: SEGMENTAL REVENUES

FIGURE 21 ASTRAZENECA PLC: REGIONAL REVENUE

FIGURE 22 SANOFI-AVENTIS: KEY FINANCIALS

FIGURE 23 SANOFI-AVENTIS: SEGMENTAL REVENUE

FIGURE 24 SANOFI-AVENTIS: REGIONAL REVENUE

FIGURE 25 MERCK & CO., INC.: KEY FINANCIALS

FIGURE 26 MERCK & CO., INC.: SEGMENTAL REVENUE

FIGURE 27 MERCK & CO., INC.: REGIONAL REVENUE

FIGURE 28 PFIZER, INC.: KEY FINANCIALS

FIGURE 29 PFIZER, INC.: SEGMENTAL REVENUE

FIGURE 30 PFIZER, INC.: REGIONAL REVENUE

FIGURE 31 GLAXOSMITHKLINE PLC: KEY FINANCIALS

FIGURE 32 GLAXOSMITHKLINE PLC: SEGMENTAL REVENUE

FIGURE 33 GLAXOSMITHKLINE PLC: REGIONAL REVENUE

FIGURE 34 JOHNSON & JOHNSON: KEY FINANCIALS

FIGURE 35 JOHNSON & JOHNSON: SEGMENTAL REVENUE

FIGURE 36 JOHNSON & JOHNSON: REGIONAL REVENUE

FIGURE 37 LUNDBECK A/S: KEY FINANCIALS

FIGURE 38 LUNDBECK A/S SEGMENTAL REVENUE

FIGURE 39 LUNDBECK A/S: REGIONAL REVENUE

FIGURE 40 BRISTOL-MYERS SQUIBB COMPANY: KEY FINANCIALS

FIGURE 41 BRISTOL-MYERS SQUIBB COMPANY: SEGMENTAL REVENUE

FIGURE 42 BRISTOL-MYERS SQUIBB COMPANY: REGIONAL REVENUE

Purchase Option
Single User $ 4,950
Multiuser License $ 5,950
Enterprise User $ 7,250
Compare Licenses
Tailored for You
  • Dedicated Research on any specifics segment or region.
  • Focused Research on specific players in the market.
  • Custom Report based only on your requirements.
  • Flexibility to add or subtract any chapter in the study.
  • Historic data from 2014 and forecasts outlook till 2040.
  • Flexibility of providing data/insights in formats (PDF, PPT, Excel).
  • Provide cross segmentation in applicable scenario/markets.