Antibiotics Market (2026 - 2035)

ID: MRFR/HC/6975-HCR 200 Pages Nidhi Mandole Last Updated: October 27, 2026
Antibiotics Market Research Report: Size, Share, Trend Analysis By Types (Penicillins, Cephalosporins, Macrolides, Tetracyclines, Aminoglycosides), By Route of Administration (Oral, Intravenous, Intramuscular, Topical), By Applications (Infectious Diseases, Prophylaxis, Surgery, Cancer Treatment), By End Users (Hospitals, Clinics, Homecare, Pharmaceutical Laboratories) and By Regional (North America, Europe, South America, Asia Pacific, Middle East and Africa) - Growth Outlook & Industry Forecast 2026 To 2035
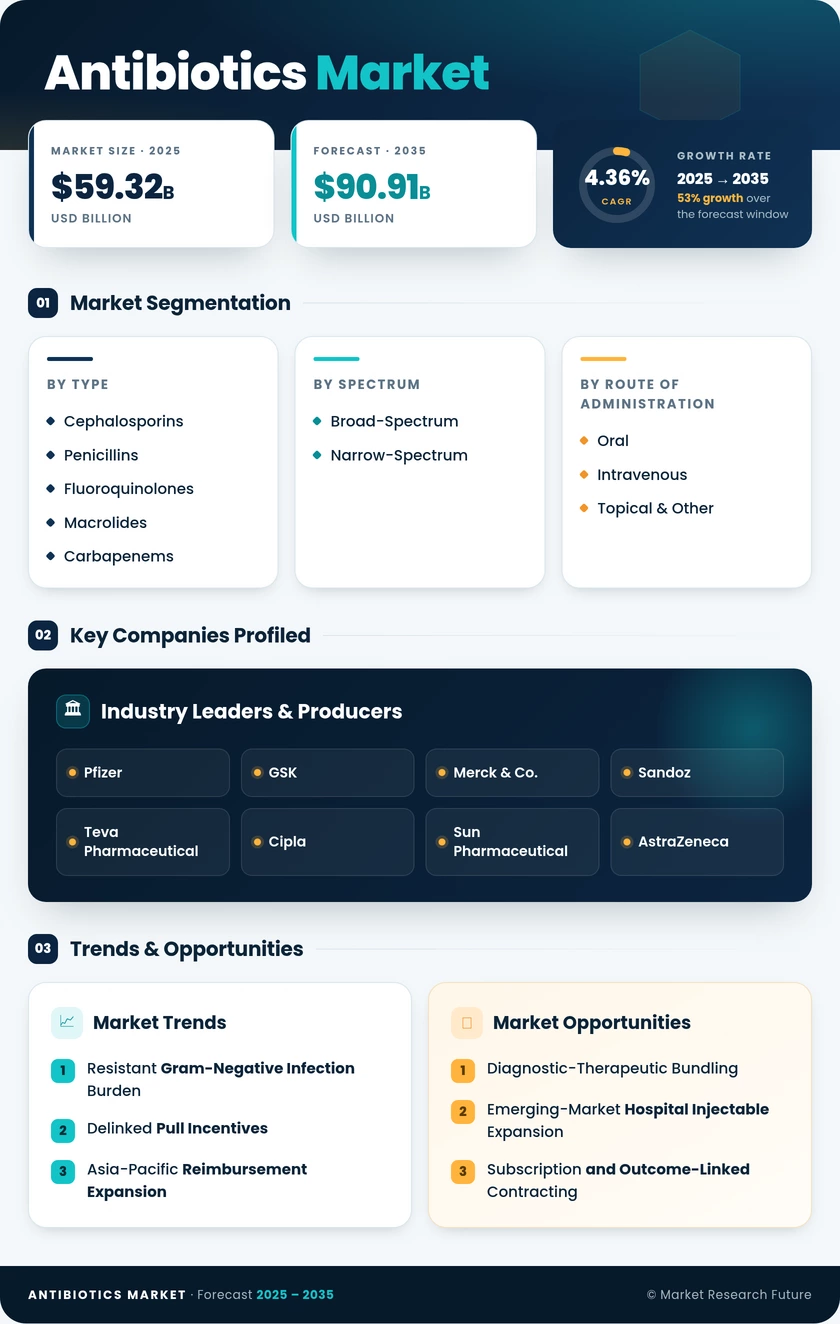
Antibiotics Market
Market Size
Forecast Period2026-2035
CAGR (2026-2035)4.36%
2025 Market SizeUSD 59.32 Billion
2035 Market SizeUSD 90.91 Billion
Key Players
Pfizer
GSK
Merck & Co.
Sandoz
Teva Pharmaceutical
Cipla
Opportunities
  • Diagnostic-Therapeutic Bundling
  • Emerging-Market Hospital Injectable Expansion
  • Subscription and Outcome-Linked Contracting
  1. 1 Market Overview |
    1. 1.1 Study Assumptions & Market Definition |
    2. 1.2 Scope of the Study |
    3. 1.3 Research Methodology |
    4. 1.4 Market Summary
  2. 2 Key Report Takeaways |
    1. 2.1 By Product Class |
    2. 2.2 By Spectrum and Route |
    3. 2.3 By Geography
  3. 3 Global Market Size & Forecast (2021–2035) |
    1. 3.1 Historical Market Size (2021–2025) |
    2. 3.2 Current & Forecast Market Size (2026–2035) |
    3. 3.3 Year-over-Year Growth Analysis |
    4. 3.4 Data Sourcing Methodology
  4. 4 Market Drivers Analysis |
    1. 4.1 Resistant Gram-Negative Infection Burden |
    2. 4.2 Delinked Pull Incentives |
    3. 4.3 Asia-Pacific Reimbursement Expansion |
    4. 4.4 β-Lactamase Inhibitor Approvals
  5. 5 Market Restraints Analysis |
    1. 5.1 Stewardship-Driven Prescription Reduction |
    2. 5.2 Tender Deflation in Generics |
    3. 5.3 Thin Commercial Returns on Novel Agents
  6. 6 Market Opportunity Analysis |
    1. 6.1 Diagnostic-Therapeutic Bundling |
    2. 6.2 Emerging-Market Hospital Injectable Expansion |
    3. 6.3 Subscription and Outcome-Linked Contracting |
    4. 6.4 Surveillance Data Monetisation |
    5. 6.5 Veterinary-to-Human Spillover Governance |
    6. 6.6 Industry Value Chain Analysis |
    7. 6.7 Porter's Five Forces Analysis
  7. 7 Regional Analysis |
    1. 7.1 North America | |
      1. 7.1.1 US | |
      2. 7.1.2 Canada | |
      3. 7.1.3 Mexico |
    2. 7.2 Europe | |
      1. 7.2.1 Germany | |
      2. 7.2.2 UK | |
      3. 7.2.3 France | |
      4. 7.2.4 Italy | |
      5. 7.2.5 Spain | |
      6. 7.2.6 Nordic Countries | |
      7. 7.2.7 Russia | |
      8. 7.2.8 Rest of Europe |
    3. 7.3 Asia-Pacific | |
      1. 7.3.1 China | |
      2. 7.3.2 India | |
      3. 7.3.3 Japan | |
      4. 7.3.4 South Korea | |
      5. 7.3.5 ASEAN | |
      6. 7.3.6 Rest of Asia-Pacific |
    4. 7.4 South America | |
      1. 7.4.1 Brazil | |
      2. 7.4.2 Argentina | |
      3. 7.4.3 Rest of South America |
    5. 7.5 Middle East & Africa | |
      1. 7.5.1 Saudi Arabia | |
      2. 7.5.2 UAE | |
      3. 7.5.3 South Africa | |
      4. 7.5.4 Egypt | |
      5. 7.5.5 Rest of Middle East & Africa
  8. 8 Future Outlook (2026–2035) |
    1. 8.1 AI-Guided Prescribing and Discovery |
    2. 8.2 Delinked Revenue Becomes Standard |
    3. 8.3 Supply-Chain Regionalisation |
    4. 8.4 Environmental Manufacturing Standards
  9. 9 Segmentation Analysis |
    1. 9.1 By Product Class | |
      1. 9.1.1 Cephalosporins | |
      2. 9.1.2 Penicillins | |
      3. 9.1.3 Fluoroquinolones | |
      4. 9.1.4 Macrolides | |
      5. 9.1.5 Carbapenems | |
      6. 9.1.6 Aminoglycosides | |
      7. 9.1.7 Sulfonamides & Others |
    2. 9.2 By Spectrum | |
      1. 9.2.1 Broad-Spectrum | |
      2. 9.2.2 Narrow-Spectrum |
    3. 9.3 By Route of Administration | |
      1. 9.3.1 Oral | |
      2. 9.3.2 Intravenous | |
      3. 9.3.3 Topical & Other
  10. 10 Competitive Landscape |
    1. 10.1 Market Concentration Analysis |
    2. 10.2 Competitive Benchmarking Matrix |
    3. 10.3 Company Profiles | |
      1. 10.3.1 Pfizer | |
      2. 10.3.2 GSK | |
      3. 10.3.3 Merck & Co. | |
      4. 10.3.4 Sandoz | |
      5. 10.3.5 Teva Pharmaceutical | |
      6. 10.3.6 Cipla | |
      7. 10.3.7 Sun Pharmaceutical | |
      8. 10.3.8 AstraZeneca | |
      9. 10.3.9 Shionogi | |
      10. 10.3.10 Viatris | |
      11. 10.3.11 Fresenius Kabi
  11. 11 Recent News & Developments
  12. 12 Report Scope & Methodology |
    1. 12.1 Study Period & Base Year |
    2. 12.2 Valuation Currency & Assumptions |
    3. 12.3 Abbreviations
  13. 13 Detailed Sources & Citations
  14. 14 Frequently Asked Questions
  15. 15 LIST OF TABLES |
  16. TABLE 1 Global Antibiotics Market Size & Forecast, by Revenue (USD Billion), 2021–2035 |
  17. TABLE 2 Global Antibiotics Market – Year-over-Year Growth Analysis, 2021–2035 |
  18. TABLE 3 Driver Impact Analysis Matrix, 2026–2035 |
  19. TABLE 4 Restraint Impact Analysis Matrix, 2026–2035 |
  20. TABLE 5 Global Antibiotics Market Size, by Region, 2021–2035 (USD Billion) |
  21. TABLE 6 North America Antibiotics Market Size, by Country, 2021–2035 (USD Billion) |
  22. TABLE 7 Europe Antibiotics Market Size, by Country, 2021–2035 (USD Billion) |
  23. TABLE 8 Asia-Pacific Antibiotics Market Size, by Country, 2021–2035 (USD Billion) |
  24. TABLE 9 South America Antibiotics Market Size, by Country, 2021–2035 (USD Billion) |
  25. TABLE 10 Middle East & Africa Antibiotics Market Size, by Country, 2021–2035 (USD Billion) |
  26. TABLE 11 Global Antibiotics Market Size, by Product Class, 2021–2035 (USD Billion) |
  27. TABLE 12 Global Antibiotics Market Size, by Spectrum, 2021–2035 (USD Billion) |
  28. TABLE 13 Global Antibiotics Market Size, by Route of Administration, 2021–2035 (USD Billion) |
  29. TABLE 14 North America Antibiotics Market Size, by Product Class, 2021–2035 (USD Billion) |
  30. TABLE 15 North America Antibiotics Market Size, by Spectrum, 2021–2035 (USD Billion) |
  31. TABLE 16 North America Antibiotics Market Size, by Route of Administration, 2021–2035 (USD Billion) |
  32. TABLE 17 Europe Antibiotics Market Size, by Product Class, 2021–2035 (USD Billion) |
  33. TABLE 18 Europe Antibiotics Market Size, by Spectrum, 2021–2035 (USD Billion) |
  34. TABLE 19 Europe Antibiotics Market Size, by Route of Administration, 2021–2035 (USD Billion) |
  35. TABLE 20 Asia-Pacific Antibiotics Market Size, by Product Class, 2021–2035 (USD Billion) |
  36. TABLE 21 Asia-Pacific Antibiotics Market Size, by Spectrum, 2021–2035 (USD Billion) |
  37. TABLE 22 Asia-Pacific Antibiotics Market Size, by Route of Administration, 2021–2035 (USD Billion) |
  38. TABLE 23 South America Antibiotics Market Size, by Product Class, 2021–2035 (USD Billion) |
  39. TABLE 24 South America Antibiotics Market Size, by Route of Administration, 2021–2035 (USD Billion) |
  40. TABLE 25 Middle East & Africa Antibiotics Market Size, by Product Class, 2021–2035 (USD Billion) |
  41. TABLE 26 Middle East & Africa Antibiotics Market Size, by Route of Administration, 2021–2035 (USD Billion) |
  42. TABLE 27 US Antibiotics Market Size, by Product Class, 2021–2035 (USD Billion) |
  43. TABLE 28 China Antibiotics Market Size, by Product Class, 2021–2035 (USD Billion) |
  44. TABLE 29 India Antibiotics Market Size, by Product Class, 2021–2035 (USD Billion) |
  45. TABLE 30 Germany Antibiotics Market Size, by Product Class, 2021–2035 (USD Billion) |
  46. TABLE 31 Competitive Benchmarking Matrix – Global Antibiotics Market, 2026 |
  47. TABLE 32 Company Profiles – Key Players, Global Antibiotics Market |
  48. TABLE 33 Recent Developments & Strategic Announcements, 2023–2025 |
  49. TABLE 34 Report Scope & Methodology Summary |
  50. TABLE 35 Detailed Sources & Citations Index
  51. 16 LIST OF FIGURES |
  52. FIGURE 1 Global Antibiotics Market Dynamics – Drivers, Restraints & Opportunities |
  53. FIGURE 2 Industry Value Chain Analysis – Antibiotics Market |
  54. FIGURE 3 Porter's Five Forces Analysis – Antibiotics Market |
  55. FIGURE 4 Global Antibiotics Market Size Trend, 2021–2035 (USD Billion) |
  56. FIGURE 5 Year-over-Year Growth Trend, 2022–2035 (%) |
  57. FIGURE 6 Market Share by Product Class, 2025 vs 2035 (%) |
  58. FIGURE 7 Market Share by Spectrum, 2025 vs 2035 (%) |
  59. FIGURE 8 Market Share by Route of Administration, 2025 vs 2035 (%) |
  60. FIGURE 9 Regional Revenue Share Distribution, 2025 (%) |
  61. FIGURE 10 Regional Revenue Share Distribution, 2035 (%) |
  62. FIGURE 11 Regional CAGR Comparison, 2026–2035 (%) |
  63. FIGURE 12 Country-Level Revenue Contribution – Top 10 Markets, 2025 |
  64. FIGURE 13 Competitive Landscape – Estimated Revenue Share Bands, 2026 |
  65. FIGURE 14 Competitive Positioning Matrix – Innovation Depth vs Volume Scale |
  66. FIGURE 15 Pipeline and Approval Timeline, 2023–2035

Segmentation Quick Reference

DimensionSub-SegmentsDominant SegmentFastest Growing Segment
By Product ClassCephalosporins; Penicillins; Fluoroquinolones; Macrolides; Carbapenems; Aminoglycosides; Sulfonamides & OthersCephalosporinsFluoroquinolones
By SpectrumBroad-Spectrum; Narrow-SpectrumBroad-SpectrumNarrow-Spectrum
By Route of AdministrationOral; Intravenous; Topical & OtherOralTopical & Other
By GeographyNorth America; Europe; Asia-Pacific; South America; Middle East & AfricaNorth AmericaAsia-Pacific


Market Segmentation Overview

By Product Class

Sub-SegmentKey Trend
CephalosporinsFifth-generation and inhibitor-paired agents defend share against resistance erosion
PenicillinsVolume leadership persists; revenue share slips under tender price compression
FluoroquinolonesGrowth sustained by shortened drug-resistant tuberculosis regimens despite safety labelling
MacrolidesStable community respiratory demand; rising resistance limits upside
CarbapenemsReserved last-line status supports premium pricing and controlled dispensing
AminoglycosidesRenewed interest as synergistic partners in severe Gram-negative sepsis
Sulfonamides & OthersNiche urinary and dermatologic indications; low-cost commodity dynamics


Class economics diverge sharply. Cephalosporins and carbapenems earn value from hospital acuity, while penicillins and sulfonamides compete purely on manufacturing cost, and fluoroquinolones ride a public-health mandate that no commercial forecast fully captures.

By Spectrum

Sub-SegmentKey Trend
Broad-SpectrumRemains the empiric default in undifferentiated sepsis and febrile neutropenia
Narrow-SpectrumGains wherever rapid identification reaches the bedside within 12 hours


Stewardship policy and diagnostic availability jointly determine this split. Systems with slow microbiology turnaround stay locked into empiric breadth, regardless of guideline intent.

By Route of Administration

Sub-SegmentKey Trend
OralOutpatient step-down therapy sustains unit dominance and pharmacy channel share
IntravenousHighest revenue per treatment course; tied to ICU bed growth and surgical volume
Topical & OtherFastest growth from dermatologic, ophthalmic and otic formulations


Route mix functions as a proxy for care-setting mix. As hospital-at-home infusion programmes scale, intravenous revenue increasingly originates outside inpatient walls — a reporting shift that will complicate channel analysis through 2030.

By Geography

Sub-SegmentKey Trend
North AmericaPremium hospital pricing plus federal pull incentives sustain revenue leadership
EuropeJoint procurement and stockpiling mandates offset restrictive prescribing culture
Asia-PacificReimbursement expansion converts high infection burden into funded demand
South AmericaCentralised national tenders dominate; currency volatility caps dollar revenue
Middle East & AfricaGulf premium purchasing coexists with donor-financed access in sub-Saharan markets


Geography drives price far more than volume. The same molecule can clear at a twenty-fold price differential between a US hospital contract and a donor-funded African tender, which is why revenue-share rankings invert almost completely when measured in treatment courses.

Opus 5 High

Download PDF ×

We do not share your information with anyone. However, we may send you emails based on your report interest from time to time. You may contact us at any time to opt-out.