Aluminium Metals Market Segmentation
Aluminium Metals Market By Type (USD Billion, 2025-2035)
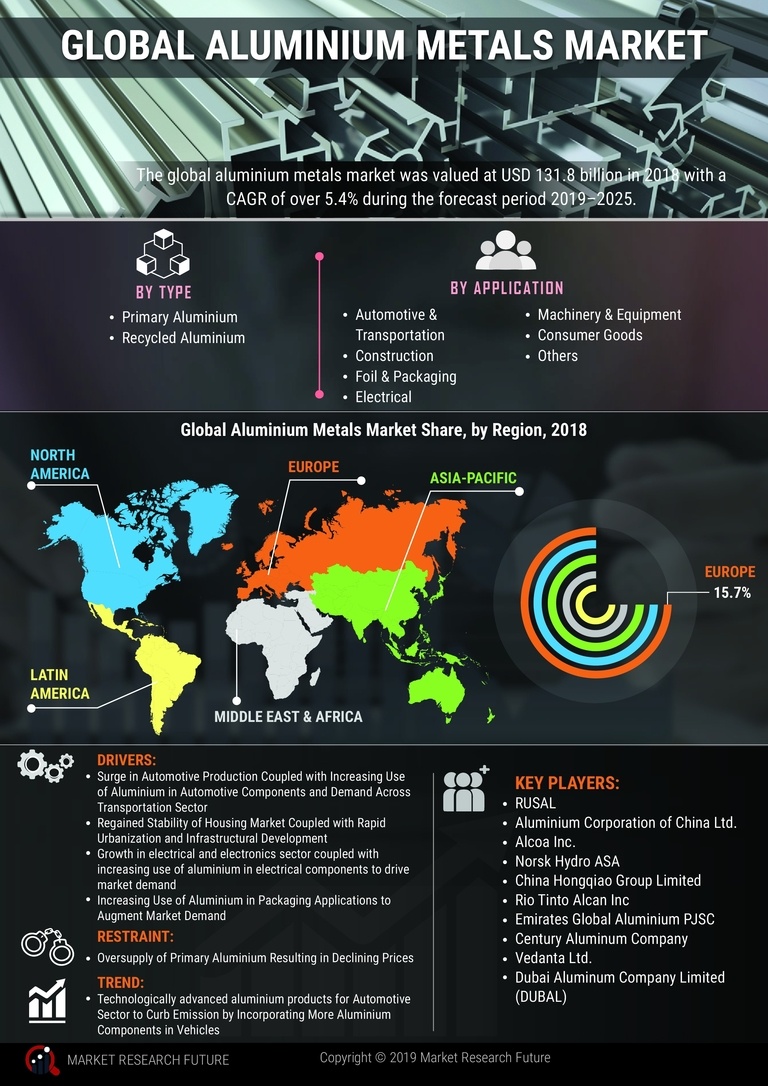
- Primary Aluminium
- Recycled Aluminium
Aluminium Metals Market By Application (USD Billion, 2025-2035)
- Automotive & Transportation
- Aluminium Metals Market
- Foil & Packaging
- Electrical
- Machinery & Equipment
- Consumer Goods
- Others