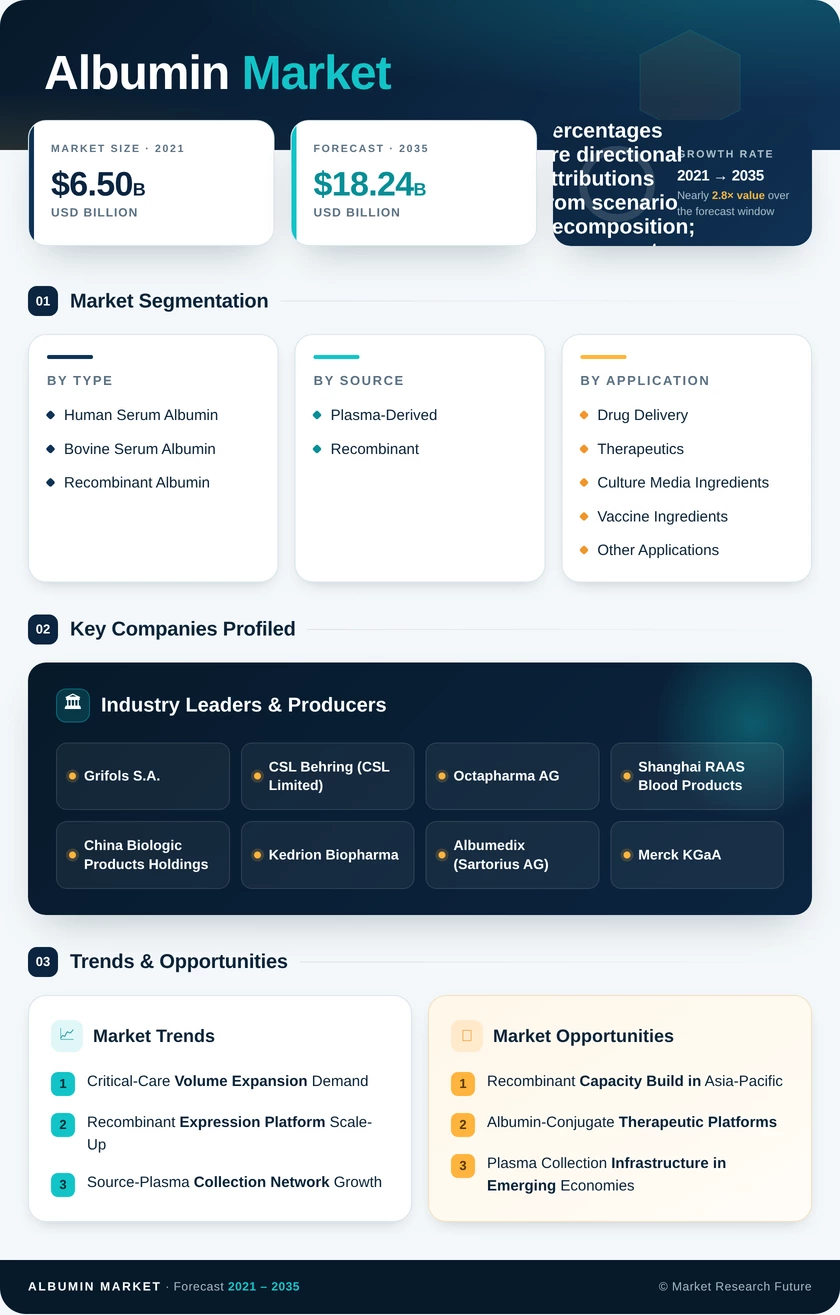
Albumin Market (2026 - 2035)

ID: MRFR/HC/5973-HCR 200 Pages Vikita Thakur Last Updated: September 27, 2026
Albumin (as Excipient) Market Research Report: Size, Share, Trend Analysis By Applications (Pharmaceuticals, Biotechnology, Diagnostics, Research), By Formulation Type (Injectables, Lyophilized, Oral Solids, Topicals), By Source (Human Serum Albumin, Bovine Serum Albumin, Recombinant Albumin), By End Use (Hospitals, Diagnostic Laboratories, Pharmaceutical Companies, Research Institutions) and By Regional (North America, Europe, South America, Asia Pacific, Middle East and Africa) - Growth Outlook & Industry Forecast 2025 To 2035
Albumin Market
Market Size
Forecast Period2026-2035
CAGR (2026-2035)8.2%
2025 Market SizeUSD 8.34 Billion
2035 Market SizeUSD 18.24 Billion
Key Players
Grifols S.A.
CSL Behring
Octapharma AG
Shanghai RAAS Blood Products
China Biologic Products Holdings
Kedrion Biopharma
Opportunities
  • Recombinant Capacity Build in Asia-Pacific
  • Albumin-Conjugate Therapeutic Platforms
  • Plasma Collection Infrastructure in Emerging Economies
  1. 1 Market Summary | |
    1. 1.1 Study Assumptions & Market Definition | |
    2. 1.2 Scope of the Study | |
    3. 1.3 Research Methodology | |
  2. 2 Key Report Takeaways | |
    1. 2.1 By Type | |
    2. 2.2 By Source | |
    3. 2.3 By Application | |
    4. 2.4 By End User | |
    5. 2.5 By Region | |
  3. 3 Market Size and Forecast (2021–2035) | |
    1. 3.1 Historical Market Size (2021–2024) | |
    2. 3.2 Base Year Estimate (2025) | |
    3. 3.3 Forecast Market Size (2026–2035) | |
    4. 3.4 Year-over-Year Growth Analysis | |
  4. 4 Driver Impact Analysis | |
    1. 4.1 Critical-Care Volume Expansion Demand | |
    2. 4.2 Recombinant Expression Platform Scale-Up | |
    3. 4.3 Source-Plasma Collection Network Growth | |
    4. 4.4 Albumin-Bound Nanoparticle Oncology Formats | |
    5. 4.5 Animal-Component-Free Media Conversion | |
    6. 4.6 Vaccine Stabiliser Adoption | |
    7. 4.7 Cultivated Protein and Regenerative Research Spend | |
  5. 5 Restraints Impact Analysis | |
    1. 5.1 Donation Policy Limits Outside the United States | |
    2. 5.2 Cost-of-Goods Gap for Recombinant Grades | |
    3. 5.3 Contested Clinical Evidence in Sepsis Protocols | |
    4. 5.4 Excipient Change Qualification Burden | |
    5. 5.5 Chemically Defined Media Displacing Bovine Fractions | |
  6. 6 Opportunities | |
    1. 6.1 Recombinant Capacity Build in Asia-Pacific | |
    2. 6.2 Albumin-Conjugate Therapeutic Platforms | |
    3. 6.3 Plasma Collection Infrastructure in Emerging Economies | |
    4. 6.4 Batch Traceability and Donor Analytics as Commercial Products | |
    5. 6.5 Food-Technology Culture Media | |
  7. 7 Regional Market Share and Country-Level Analysis | |
    1. 7.1 North America | | |
      1. 7.1.1 US | | |
      2. 7.1.2 Canada | | |
      3. 7.1.3 Mexico | |
    2. 7.2 Europe | | |
      1. 7.2.1 Germany | | |
      2. 7.2.2 UK | | |
      3. 7.2.3 France | | |
      4. 7.2.4 Italy | | |
      5. 7.2.5 Spain | | |
      6. 7.2.6 Nordic Countries | | |
      7. 7.2.7 Russia | | |
      8. 7.2.8 Rest of Europe | |
    3. 7.3 Asia-Pacific | | |
      1. 7.3.1 China | | |
      2. 7.3.2 India | | |
      3. 7.3.3 Japan | | |
      4. 7.3.4 South Korea | | |
      5. 7.3.5 ASEAN | | |
      6. 7.3.6 Rest of Asia-Pacific | |
    4. 7.4 South America | | |
      1. 7.4.1 Brazil | | |
      2. 7.4.2 Argentina | | |
      3. 7.4.3 Rest of South America | |
    5. 7.5 Middle East & Africa | | |
      1. 7.5.1 Saudi Arabia | | |
      2. 7.5.2 UAE | | |
      3. 7.5.3 South Africa | | |
      4. 7.5.4 Egypt | | |
      5. 7.5.5 Rest of MEA | |
  8. 8 Future Outlook (2026–2035) | |
    1. 8.1 Recombinant Cost Curves Reset Supply Economics | |
    2. 8.2 Digital Donor Management Reshapes Collection Yield | |
    3. 8.3 Regulatory Convergence on Pathogen Safety Documentation | |
    4. 8.4 Animal-Component-Free Sourcing Becomes a Procurement Standard | |
  9. 9 Segmentation Analysis | |
    1. 9.1 By Type | | |
      1. 9.1.1 Human Serum Albumin | | |
      2. 9.1.2 Bovine Serum Albumin | | |
      3. 9.1.3 Recombinant Albumin | |
    2. 9.2 By Source | | |
      1. 9.2.1 Plasma-Derived | | |
      2. 9.2.2 Recombinant | |
    3. 9.3 By Application | | |
      1. 9.3.1 Drug Delivery | | |
      2. 9.3.2 Therapeutics | | |
      3. 9.3.3 Culture Media Ingredients | | |
      4. 9.3.4 Vaccine Ingredients | | |
      5. 9.3.5 Other Applications | |
    4. 9.4 By End User | | |
      1. 9.4.1 Pharmaceutical & Biotechnology Companies | | |
      2. 9.4.2 Research Institutes & CROs | | |
      3. 9.4.3 Hospitals & Clinics | | |
      4. 9.4.4 Diagnostic Centers | | |
      5. 9.4.5 Others | |
  10. 10 Competitive Landscape | |
    1. 10.1 Market Concentration Analysis | |
    2. 10.2 Competitive Benchmarking Matrix | |
    3. 10.3 Company Profiles | |
  11. 11 Recent News and Developments | |
  12. 12 Report Scope and Methodology | |
  13. 13 Detailed Sources and Citations | |
  14. 14 Frequently Asked Questions | | LIST OF TABLES | |
  15. TABLE 1 Global Albumin Market Size & Forecast, by Revenue (USD Billion), 2021–2035 | |
  16. TABLE 2 Year-over-Year Growth Analysis, 2021–2035 | |
  17. TABLE 3 Driver Impact Matrix, 2026–2035 | |
  18. TABLE 4 Restraint Impact Matrix, 2026–2035 | |
  19. TABLE 5 Regional Summary Table, 2025 | |
  20. TABLE 6 North America Market Size, by Country, 2021–2035 (USD Billion) | |
  21. TABLE 7 Europe Market Size, by Country, 2021–2035 (USD Billion) | |
  22. TABLE 8 Asia-Pacific Market Size, by Country, 2021–2035 (USD Billion) | |
  23. TABLE 9 South America Market Size, by Country, 2021–2035 (USD Billion) | |
  24. TABLE 10 Middle East & Africa Market Size, by Country, 2021–2035 (USD Billion) | |
  25. TABLE 11 Market Size, by Type, 2021–2035 (USD Billion) | |
  26. TABLE 12 Market Size, by Source, 2021–2035 (USD Billion) | |
  27. TABLE 13 Market Size, by Application, 2021–2035 (USD Billion) | |
  28. TABLE 14 Market Size, by End User, 2021–2035 (USD Billion) | |
  29. TABLE 15 Competitive Benchmarking Matrix, 2026 | |
  30. TABLE 16 Company Profiles — Key Players | |
  31. TABLE 17 Recent Developments & Strategic Announcements, 2023–2025 | |
  32. TABLE 18 Report Scope & Methodology Summary | |
  33. TABLE 19 Detailed Sources and Citations | |
  34. TABLE 20 Segmentation Quick Reference Matrix | | LIST OF FIGURES | |
  35. FIGURE 1 Market Dynamics — Drivers, Restraints and Opportunities | |
  36. FIGURE 2 Industry Value Chain Analysis — Collection to Finished Albumin | |
  37. FIGURE 3 Porter's Five Forces Analysis | |
  38. FIGURE 4 Market Size Trend and Forecast, 2021–2035 (USD Billion) | |
  39. FIGURE 5 Segment Share by Type, 2025 vs 2035 | |
  40. FIGURE 6 Segment Share by Source, 2025 vs 2035 | |
  41. FIGURE 7 Segment Share by Application, 2025 | |
  42. FIGURE 8 Segment Share by End User, 2025 | |
  43. FIGURE 9 Regional Revenue Share, 2025 | |
  44. FIGURE 10 Regional CAGR Comparison, 2026–2035 | |
  45. FIGURE 11 Competitive Landscape — Estimated Revenue Share Bands, 2026 | |
  46. FIGURE 12 Strategic Positioning Map — Plasma-Derived vs Recombinant Suppliers

Segmentation Quick Reference

DimensionSub-SegmentsDominant SegmentFastest Growing Segment
By TypeHuman Serum Albumin, Bovine Serum Albumin, Recombinant AlbuminHuman Serum Albumin (55.6% share, 2025)Recombinant Albumin (12.6% CAGR)
By SourcePlasma-Derived, RecombinantPlasma-Derived (77.1% share, 2025)Recombinant (11.4% CAGR)
By ApplicationDrug Delivery, Therapeutics, Culture Media Ingredients, Vaccine Ingredients, Other ApplicationsTherapeutics (38.8% share, 2025)Drug Delivery (10.1% CAGR)
By End UserPharmaceutical & Biotechnology Companies, Research Institutes & CROs, Hospitals & Clinics, Diagnostic Centers, OthersPharmaceutical & Biotechnology Companies (42.3% share, 2025)Research Institutes & CROs (11.8% CAGR)
By RegionNorth America, Europe, Asia-Pacific, South America, Middle East & AfricaNorth America (33.4% share)Asia-Pacific (8.6% CAGR (2026–2035))


Market Segmentation Overview

By Type

Sub-SegmentKey Trend
Human Serum AlbuminProtocol-locked demand in volume expansion, burn care and hypoalbuminemia
Bovine Serum AlbuminStable diagnostics and blocking-buffer use; displaced in production media
Recombinant AlbuminFastest expansion via vaccine excipients and defined culture media


Human Serum Albumin leads because hospital formularies, pharmacopoeial monographs and reimbursement codes are all written around its 20% and 25% presentations, which makes substitution a regulatory exercise rather than a purchasing decision. Recombinant Albumin grows fastest at a 12.6% CAGR since formulation scientists will pay a premium to eliminate donor variability and adventitious-agent testing from their filings. Bovine Serum Albumin, by contrast, is neither growing nor collapsing: chemically defined media removed it from antibody production, but diagnostic assay developers still find no technical reason to replace it.

By Source

Sub-SegmentKey Trend
Plasma-DerivedAmortised fractionation capacity and clinical qualification sustain dominance
RecombinantYeast, rice and transgenic plant platforms scale toward cost parity


Plasma-Derived material holds 77.1% of supply because the fractionation asset base is already built, inspected and written down, giving it a cost floor that new entrants cannot match on bulk therapeutic grades. Recombinant supply expands at an 11.4% CAGR from a smaller base, with yeast fermentation carrying most current volume on titre advantages while rice-derived material competes for price-sensitive research and food-technology buyers. The decisive variable is donor policy: where collection is capped, buyers hedge toward synthetic sources regardless of price.

By Application

Sub-SegmentKey Trend
Drug DeliveryAlbumin-bound nanoparticles remove solvent toxicity in oncology regimens
TherapeuticsCritical care, cirrhosis and burn protocols anchor baseline volume
Culture Media IngredientsCell and gene therapy pipelines drive defined-supplement demand
Vaccine IngredientsLyophilisation stability and outbreak stockpiling create episodic pull
Other ApplicationsDiagnostics, reagents and coating solutions provide residual volume


Therapeutics holds 38.8% of demand because intensive-care and hepatology protocols specify albumin by concentration and indication, giving it volume stability that no other application matches. Drug Delivery grows fastest at a 10.1% CAGR as nanoparticle albumin-bound cytotoxics prove that the protein can function as a targeting vehicle rather than an inert carrier, and each new conjugate approval locks in specification-grade recurring demand. Culture Media Ingredients sit between the two, tracking cell-therapy pipeline progression rather than hospital census.

By End User

Sub-SegmentKey Trend
Pharmaceutical & Biotechnology CompaniesDual consumption as finished therapeutic and formulation excipient
Research Institutes & CROsCultivated protein and regenerative programmes drive fastest growth
Hospitals & ClinicsICU, surgical and emergency protocols deliver predictable volume
Diagnostic CentersAssay development use faces gradual synthetic substitution
OthersVeterinary and industrial reagent applications


Pharmaceutical & Biotechnology Companies buy 42.3% of volume because they consume albumin twice over — once as a marketed infusion product and again as an excipient inside other biologics — which makes them the least price-elastic buyer group. Research Institutes & CROs grow fastest at an 11.8% CAGR on cultivated-protein and stem-cell work that requires animal-component-free consistency at small lot sizes. Hospitals & Clinics remain the volume backbone, but their purchasing is tender-driven and offers suppliers little room to differentiate beyond container format and delivery reliability.




Download PDF ×

We do not share your information with anyone. However, we may send you emails based on your report interest from time to time. You may contact us at any time to opt-out.