SEGMENTATION QUICK REFERENCE
| Dimension | Sub-Segments | Dominant Segment | Fastest Growing Segment |
| Occupancy Type | Single, Shared | Single (61.24% share, 2025) | Shared (9.38% CAGR) |
| Stay Duration | Short Stay, Standard Stay, Overnight Stay | Standard Stay (46.12% share, 2025) | Overnight Stay (8.52% CAGR) |
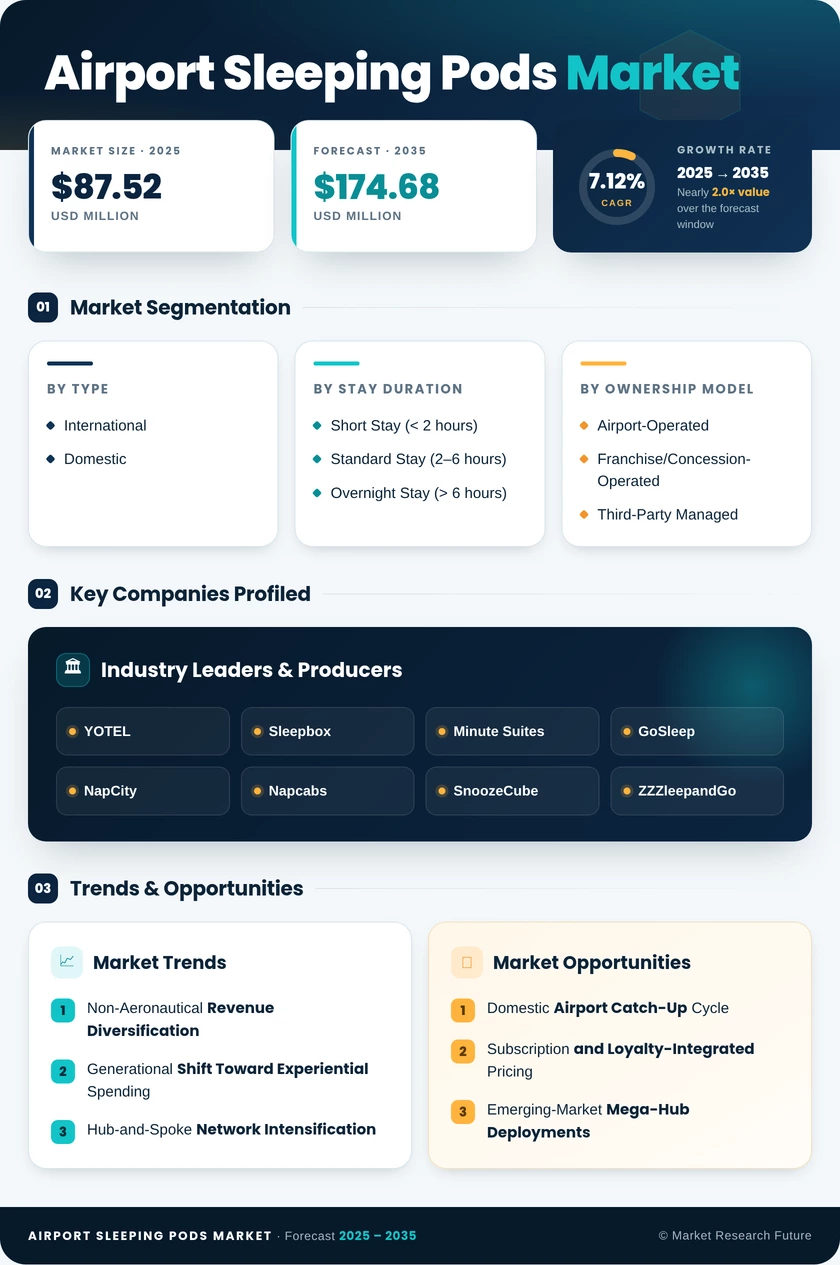
| Airport Type | International, Domestic | International (68.42% share, 2025) | Domestic (8.78% CAGR) |
| Ownership Model | Airport-Operated, Franchise/Concession-Operated, Third-Party Managed | Franchise/Concession-Operated (48.14% share, 2025) | Third-Party Managed (9.22% CAGR) |
| Geography | North America, Europe, Asia-Pacific, South America, MEA | North America (35.08% share, 2025) | Asia-Pacific (9.48% CAGR) |
MARKET SEGMENTATION OVERVIEW
By Occupancy Type
| Sub-Segment | Key Trend |
| Single | Privacy-driven demand; premium pricing for noise isolation and personal climate control |
| Shared | Budget-tier growth; twin/bunk configurations gaining traction among younger flyers |
Single-occupancy pods remain the revenue backbone, while shared configurations are rapidly expanding as operators target cost-sensitive transit passengers across Asia-Pacific and European budget terminals.
By Stay Duration
| Sub-Segment | Key Trend |
| Short Stay (< 2 hours) | Power-nap sessions averaging 60–70 minutes at high-traffic hubs |
| Standard Stay (2–6 hours) | Core demand aligned with typical mid-layover connection windows |
| Overnight Stay (> 6 hours) | Fastest growth driven by airline delay-compensation and red-eye connections |
Standard stays dominate by revenue share, but overnight stays represent the highest-growth opportunity as airlines increasingly reimburse passengers with pod vouchers rather than off-airport hotel bookings.
By Airport Type
| Sub-Segment | Key Trend |
| International | Established pod infrastructure at mega-hubs with high transit volumes |
| Domestic | Fastest adoption driven by expanding hub-and-spoke connectivity |
International airports account for the majority of current installations, yet domestic facilities are narrowing the gap as connecting-passenger volumes rise at secondary hubs across North America and Asia-Pacific.
By Ownership Model
| Sub-Segment | Key Trend |
| Airport-Operated | Direct operator control; higher capex but stronger brand integration |
| Franchise/Concession-Operated | Scalable brand-driven rollouts under revenue-sharing agreements |
| Third-Party Managed | Asset-light model shifting financial risk to specialized hospitality operators |
Franchise and concession models lead by installation count, but third-party-managed concepts are growing fastest as airport authorities seek to deploy pods without committing direct capital.