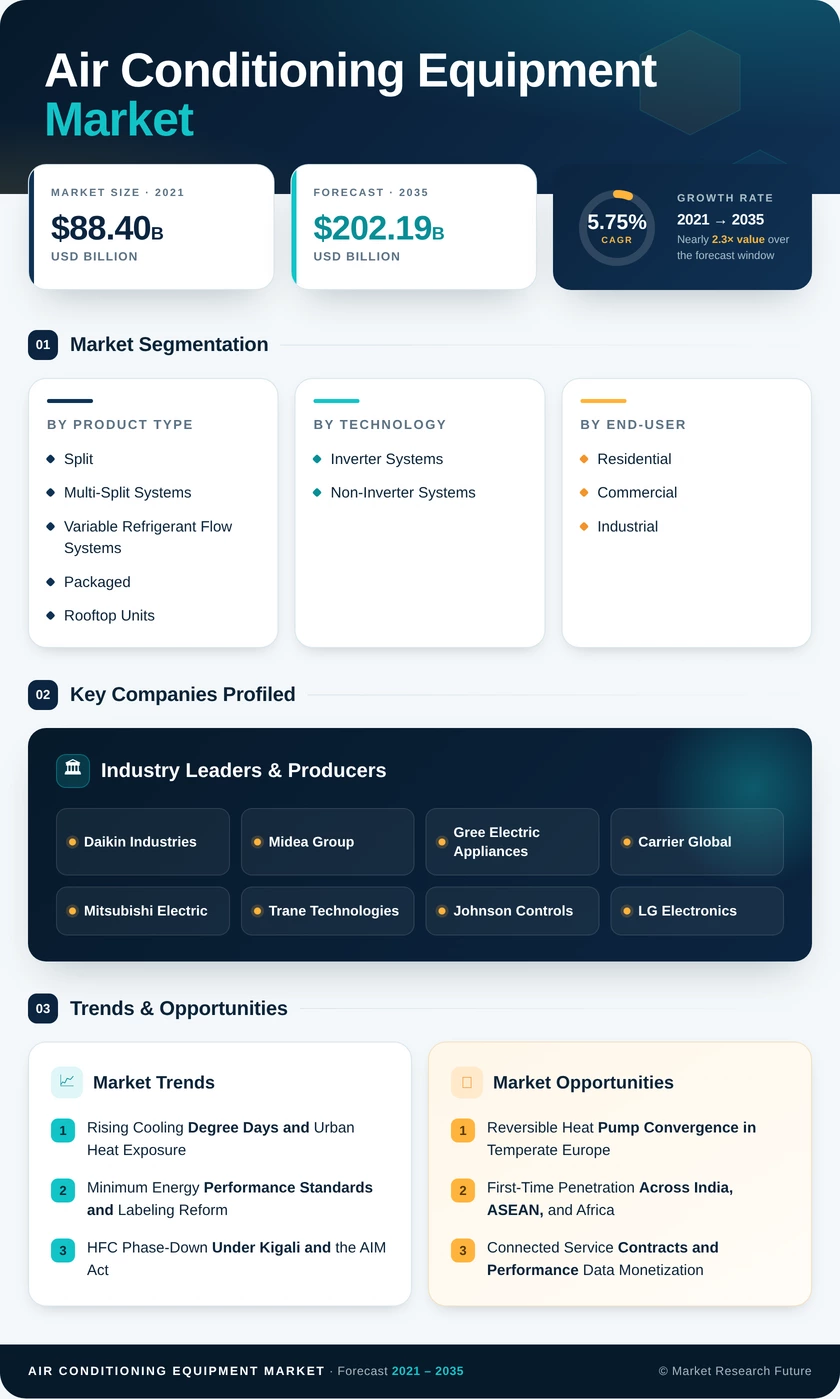
Air Conditioning Equipment Market (2026 - 2035)

ID: MRFR/EnP/41049-HCR 200 Pages Garvit Vyas Last Updated: September 22, 2026
Air Conditioning Equipment Market Research Report By Product Type (Split and Multi-Split Systems, Variable Refrigerant Flow Systems, Packaged and Rooftop Units, Chillers, Window and Portable Units, Others), By Technology (Inverter Systems, Non-Inverter Systems), By End-User (Residential, Commercial, Industrial), By Capacity (Up To 10 Tons, 11-18 Tons, 19-26 Tons, Above 26 Tons), By Distribution Channel (Dealer and Retail Outlets, Direct Sales, Distributors and Wholesalers, Online Retail) - Forecast to 2035
Air Conditioning Equipment Market
Market Size
Forecast Period2026-2035
CAGR (2026-2035)5.75%
2025 Market SizeUSD 115.60 Billion
2035 Market SizeUSD 202.19 Billion
Key Players
Daikin Industries
Midea Group
Gree Electric Appliances
Carrier Global
Mitsubishi Electric
Trane Technologies
Opportunities
  • Reversible Heat Pump Convergence in Temperate Europe
  • First-Time Penetration Across India, ASEAN, and Africa
  • Connected Service Contracts and Performance Data Monetization
  1. 1 Market Summary | |
    1. 1.1 Study Assumptions & Market Definition | |
    2. 1.2 Scope of the Study | |
    3. 1.3 Research Methodology | |
  2. 2 Key Report Takeaways | |
    1. 2.1 By Product Type | |
    2. 2.2 By Technology | |
    3. 2.3 By End-User | |
    4. 2.4 By Capacity | |
    5. 2.5 By Distribution Channel | |
    6. 2.6 By Region | |
  3. 3 Market Size and Forecast (2021–2035) | |
    1. 3.1 Historical Market Size (2021–2024) | |
    2. 3.2 Base Year Estimate (2025) | |
    3. 3.3 Forecast Market Size (2026–2035) | |
    4. 3.4 Year-over-Year Growth Analysis | |
  4. 4 Driver Impact Analysis | |
    1. 4.1 Rising Cooling Degree Days and Urban Heat Exposure | |
    2. 4.2 Minimum Energy Performance Standards and Labeling Reform | |
    3. 4.3 HFC Phase-Down Under Kigali and the AIM Act | |
    4. 4.4 Commercial Construction and Data-Center Buildout | |
    5. 4.5 Falling Inverter and Variable-Speed Component Costs | |
    6. 4.6 Utility Rebate and Electrification Incentive Programs | |
    7. 4.7 First-Time AC Penetration in Emerging Economies | |
  5. 5 Restraints Impact Analysis | |
    1. 5.1 High Upfront Cost and Installation Labor Shortage | |
    2. 5.2 Refrigerant Transition and A2L Code Compliance Burden | |
    3. 5.3 Grid Capacity Limits and Peak Demand Charges | |
    4. 5.4 Raw Material and Semiconductor Price Volatility | |
    5. 5.5 Fragmented Standards and Weak Enforcement in Emerging Economies | |
  6. 6 Opportunities | |
    1. 6.1 Reversible Heat Pump Convergence in Temperate Europe | |
    2. 6.2 First-Time Penetration Across India, ASEAN, and Africa | |
    3. 6.3 Connected Service Contracts and Performance Data Monetization | |
    4. 6.4 Precision Cooling for Data Centers and Semiconductor Fabs | |
    5. 6.5 Retrofit and Refrigerant Transition Services | |
  7. 7 Regional Market Share and Country-Level Analysis | |
    1. 7.1 North America | | |
      1. 7.1.1 US | | |
      2. 7.1.2 Canada | | |
      3. 7.1.3 Mexico | |
    2. 7.2 Europe | | |
      1. 7.2.1 Germany | | |
      2. 7.2.2 UK | | |
      3. 7.2.3 France | | |
      4. 7.2.4 Italy | | |
      5. 7.2.5 Spain | | |
      6. 7.2.6 Nordic Countries | | |
      7. 7.2.7 Russia | | |
      8. 7.2.8 Rest of Europe | |
    3. 7.3 Asia-Pacific | | |
      1. 7.3.1 China | | |
      2. 7.3.2 India | | |
      3. 7.3.3 Japan | | |
      4. 7.3.4 South Korea | | |
      5. 7.3.5 ASEAN | | |
      6. 7.3.6 Rest of Asia-Pacific | |
    4. 7.4 South America | | |
      1. 7.4.1 Brazil | | |
      2. 7.4.2 Argentina | | |
      3. 7.4.3 Rest of South America | |
    5. 7.5 Middle East & Africa | | |
      1. 7.5.1 Saudi Arabia | | |
      2. 7.5.2 UAE | | |
      3. 7.5.3 South Africa | | |
      4. 7.5.4 Egypt | | |
      5. 7.5.5 Rest of MEA | |
  8. 8 Future Outlook (2026–2035) | |
    1. 8.1 Controls Intelligence and Autonomous Plant Operation | |
    2. 8.2 Refrigerant Sequencing Beyond A2L | |
    3. 8.3 Cooling as a Grid Asset | |
    4. 8.4 Embodied Carbon and Product-Level Disclosure | |
  9. 9 Segmentation Analysis | |
    1. 9.1 By Product Type | | |
      1. 9.1.1 Split and Multi-Split Systems | | |
      2. 9.1.2 Variable Refrigerant Flow Systems | | |
      3. 9.1.3 Packaged and Rooftop Units | | |
      4. 9.1.4 Chillers | | |
      5. 9.1.5 Window and Portable Units | | |
      6. 9.1.6 Others | |
    2. 9.2 By Technology | | |
      1. 9.2.1 Inverter Systems | | |
      2. 9.2.2 Non-Inverter Systems | |
    3. 9.3 By End-User | | |
      1. 9.3.1 Residential | | |
      2. 9.3.2 Commercial | | |
      3. 9.3.3 Industrial | |
    4. 9.4 By Capacity | | |
      1. 9.4.1 Up To 10 Tons | | |
      2. 9.4.2 11-18 Tons | | |
      3. 9.4.3 19-26 Tons | | |
      4. 9.4.2 Above 26 Tons | |
    5. 9.5 By Distribution Channel | | |
      1. 9.5.1 Dealer and Retail Outlets | | |
      2. 9.5.2 Direct Sales | | |
      3. 9.5.3 Distributors and Wholesalers | | |
      4. 9.5.4 Online Retail | |
  10. 10 Competitive Landscape | |
    1. 10.1 Market Concentration Analysis (2025) | |
    2. 10.2 Competitive Benchmarking Matrix | |
    3. 10.3 Company Profiles | |
  11. 11 Recent News & Developments | |
  12. 12 Report Scope and Methodology | |
  13. 13 Detailed Sources and Citations | |
  14. 14 Frequently Asked Questions | | LIST OF TABLES | |
  15. TABLE 1 Global Air Conditioning Equipment Market Size & Forecast, by Revenue (USD Billion), 2021–2035 | |
  16. TABLE 2 Global Air Conditioning Equipment Market — Year-over-Year Growth Analysis, 2021–2035 | |
  17. TABLE 3 Driver Impact Analysis — Weighting, Geographic Relevance and Timeline | |
  18. TABLE 4 Restraint Impact Analysis — Weighting, Geographic Relevance and Timeline | |
  19. TABLE 5 Global Air Conditioning Equipment Market Size, by Region, 2021–2035 (USD Billion) | |
  20. TABLE 6 North America Air Conditioning Equipment Market Size, by Country, 2021–2035 (USD Billion) | |
  21. TABLE 7 Europe Air Conditioning Equipment Market Size, by Country, 2021–2035 (USD Billion) | |
  22. TABLE 8 Asia-Pacific Air Conditioning Equipment Market Size, by Country, 2021–2035 (USD Billion) | |
  23. TABLE 9 South America Air Conditioning Equipment Market Size, by Country, 2021–2035 (USD Billion) | |
  24. TABLE 10 Middle East & Africa Air Conditioning Equipment Market Size, by Country, 2021–2035 (USD Billion) | |
  25. TABLE 11 Global Air Conditioning Equipment Market Size, by Product Type, 2021–2035 (USD Billion) | |
  26. TABLE 12 Global Air Conditioning Equipment Market Size, by Technology, 2021–2035 (USD Billion) | |
  27. TABLE 13 Global Air Conditioning Equipment Market Size, by End-User, 2021–2035 (USD Billion) | |
  28. TABLE 14 Global Air Conditioning Equipment Market Size, by Capacity, 2021–2035 (USD Billion) | |
  29. TABLE 15 Global Air Conditioning Equipment Market Size, by Distribution Channel, 2021–2035 (USD Billion) | |
  30. TABLE 16 Competitive Benchmarking Matrix — Global Air Conditioning Equipment Market, 2025 | |
  31. TABLE 17 Company Profiles — Key Players, Global Air Conditioning Equipment Market | |
  32. TABLE 18 Recent Developments & Strategic Announcements, 2023–2025 | |
  33. TABLE 19 Report Scope & Methodology Summary | |
  34. TABLE 20 Detailed Sources and Citations Index | |
  35. TABLE 21 Segmentation Quick Reference — Dominant and Fastest-Growing Segments | | LIST OF FIGURES | |
  36. FIGURE 1 Global Air Conditioning Equipment Market — Market Dynamics Overview (Drivers, Restraints, Opportunities) | |
  37. FIGURE 2 Industry Value Chain Analysis — Component Supply to Installation and Service | |
  38. FIGURE 3 Porter's Five Forces Analysis — Global Air Conditioning Equipment Market | |
  39. FIGURE 4 Market Size Trend and Forecast, 2021–2035 (USD Billion) | |
  40. FIGURE 5 Year-over-Year Growth Rate Trend, 2022–2035 (%) | |
  41. FIGURE 6 Market Share by Product Type, 2025 (%) | |
  42. FIGURE 7 Market Share by Technology, 2025 (%) | |
  43. FIGURE 8 Market Share by End-User, 2025 (%) | |
  44. FIGURE 9 Market Share by Capacity, 2025 (%) | |
  45. FIGURE 10 Market Share by Distribution Channel, 2025 (%) | |
  46. FIGURE 11 Regional Revenue Share, 2025 (%) | |
  47. FIGURE 12 Regional CAGR Comparison, 2026–2035 (%) | |
  48. FIGURE 13 Country-Level Share Within Asia-Pacific, 2025 (%) | |
  49. FIGURE 14 Competitive Landscape — Estimated Revenue Share Bands, 2025 | |
  50. FIGURE 15 Refrigerant Platform Transition Timeline, 2024–2035

Segmentation Quick Reference

DimensionSub-SegmentsDominant SegmentFastest Growing Segment
By Product TypeSplit and Multi-Split Systems; Variable Refrigerant Flow Systems; Packaged and Rooftop Units; Chillers; Window and Portable Units; OthersSplit and Multi-Split Systems (41.5% share)Variable Refrigerant Flow Systems (6.26% CAGR)
By TechnologyInverter Systems; Non-Inverter SystemsInverter Systems (64.0% share)Inverter Systems (6.07% CAGR)
By End-UserResidential; Commercial; IndustrialResidential (59.6% share)Commercial (6.37% CAGR)
By CapacityUp To 10 Tons; 11-18 Tons; 19-26 Tons; Above 26 TonsUp To 10 Tons (36.2% share)Above 26 Tons (6.98% CAGR)
By Distribution ChannelDealer and Retail Outlets; Direct Sales; Distributors and Wholesalers; Online RetailDealer and Retail Outlets (39.2% share)Direct Sales (7.24% CAGR)
By RegionNorth America; Europe; Asia-Pacific; South America; Middle East & AfricaAsia-Pacific (46.8% share)Asia-Pacific (6.62% CAGR)


Market Segmentation Overview

By Product Type

Sub-SegmentKey Trend
Split and Multi-Split SystemsEntry-tier volume anchor across emerging Asia; mix shifting to inverter variants
Variable Refrigerant Flow SystemsZone control and heat recovery specified in mixed-use and high-rise developments.
Packaged and Rooftop UnitsSteady light-commercial replacement cycle concentrated in North America.
ChillersCentrifugal and screw platforms serving fabs, pharma, and hyperscale facilities
Window and Portable UnitsLosing share as efficiency labels and noise codes tighten
OthersSpecialty, marine, and transport-adjacent cooling applications


Split and Multi-Split Systems lead on revenue because single-room cooling remains the default purchase wherever household penetration is still climbing, and dealer networks are built around installing them. Variable Refrigerant Flow Systems grow fastest as developers weigh zone control, energy recovery, and plant-room savings in towers above 30 storeys, helped by utility rebates and falling inverter module costs that have narrowed the price gap against conventional splits. Chillers and Packaged and Rooftop Units sit in separate buying channels — engineer-specified applied plant versus contractor-driven replacement — while Window and Portable Units continue to shrink under tightening efficiency thresholds.

By Technology

Sub-SegmentKey Trend
Inverter SystemsVariable-speed compressors becoming the regulatory default in most major economies.
Non-Inverter SystemsRetained in rental stock and voltage-unstable grids; declining annually.


Inverter Systems dominate shipments and also grow faster than Non-Inverter Systems, an unusual combination that reflects how completely efficiency regulation has settled the technology question. Minimum performance thresholds in the EU, India, China, and the United States now exclude most fixed-speed products from compliant catalogues, while the incremental component cost has fallen below the level at which consumers trade it away. Non-Inverter Systems persist mainly where split incentives between landlord and tenant suppress efficiency spending, or where unstable supply voltage damages drive electronics faster than the efficiency saving justifies.

By End-User

Sub-SegmentKey Trend
ResidentialPenetration growth in emerging Asia plus mature-market replacement cycles
CommercialRetrofit obligations under carbon-intensity caps and certification schemes
IndustrialCold chain, semiconductor, and pharmaceutical stability requirements


Residential carries the largest revenue block, but Commercial is the segment reshaping vendor strategy because retrofit deadlines convert discretionary upgrades into compliance purchases with fixed dates attached. Carbon-intensity caps on large buildings and sustainability certification requirements push landlords toward heat-recovery VRF and high-efficiency chiller plant rather than like-for-like replacement. Industrial remains the smallest by value yet the most demanding technically, since fabs and vaccine cold chains specify redundancy and tight temperature tolerances that exclude most comfort-grade equipment from consideration.

By Capacity

Sub-SegmentKey Trend
Up To 10 TonsResidential and small-office workhorse tier; highest unit volumes globally
11-18 TonsMid-rise apartments and boutique hospitality rooftop applications
19-26 TonsMid-market commercial and institutional buildings
Above 26 TonsHyperscale data-center and pharmaceutical infrastructure investment


Up To 10 Tons holds the largest revenue share on sheer unit count across homes and small offices, and it will keep that position throughout the forecast because first-time buyers in India, ASEAN, and Africa purchase almost exclusively in this bracket. Above 26 Tons grows fastest, driven by large centrifugal chillers paired with free-cooling towers that let hyperscale operators hit PUE targets below 1.20, plus modular arrays providing N+1 redundancy in vaccine storage. The 11-18 Tons and 19-26 Tons tiers grow steadily as mid-rise developers trade capital cost against available roof and plant-room area.

By Distribution Channel

Sub-SegmentKey Trend
Dealer and Retail OutletsLocal installation expertise and after-sales trust sustain the largest unit share.
Direct SalesTurnkey developer and facility-manager contracts bundling equipment and services
Distributors and WholesalersRegional inventory depth serving independent mechanical contractors
Online RetailConfigure-online, install-locally models scaling in urban India and ASEAN


Dealer and Retail Outlets move the most units because installation quality determines warranty outcomes and buyers still value a local relationship, but Direct Sales grow fastest as developers and facility managers consolidate equipment, commissioning, analytics, and refrigerant transition work into single turnkey contracts that unlock 15–25% volume discounts. Online Retail expands at double-digit rates in urban India and Southeast Asia through hybrid portals that let consumers configure a system digitally and then assign installation to a certified local dealer. Distributors and Wholesalers retain their role by buffering inventory for independent contractors during component shortages.




Download PDF ×

We do not share your information with anyone. However, we may send you emails based on your report interest from time to time. You may contact us at any time to opt-out.