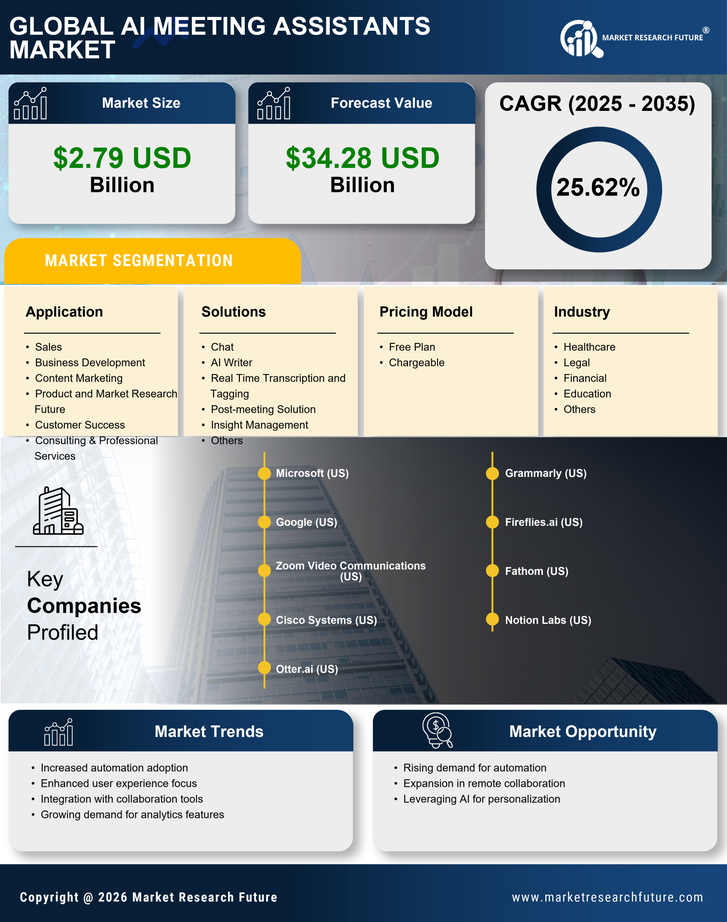
info@marketresearchfuture.com   📞 +1 (855) 661-4441(US)   📞 +44 1720 412 167(UK)   📞 +91 2269738890(APAC)
Certified Global Research Member
Isomar 1 Iso 1
Key Questions Answered
  • Global Market Outlook
  • In-depth analysis of global and regional trends
  • Analyze and identify the major players in the market, their market share, key developments, etc.
  • To understand the capability of the major players based on products offered, financials, and strategies.
  • Identify disrupting products, companies, and trends.
  • To identify opportunities in the market.
  • Analyze the key challenges in the market.
  • Analyze the regional penetration of players, products, and services in the market.
  • Comparison of major players’ financial performance.
  • Evaluate strategies adopted by major players.
  • Recommendations
Why Choose Market Research Future?
  • Vigorous research methodologies for specific market.
  • Knowledge partners across the globe
  • Large network of partner consultants.
  • Ever-increasing/ Escalating data base with quarterly monitoring of various markets
  • Trusted by fortune 500 companies/startups/ universities/organizations
  • Large database of 5000+ markets reports.
  • Effective and prompt pre- and post-sales support.

AI Meeting Assistants Market Research Report Information By Solutions (Chat, AI Writer, Real-Time Transcription and Tagging, Post-meeting Solution, Insight Management, and Others), By Pricing Model (Free Plan and Chargeable), By Application (Sales, Business Development, Content Marketing, Product and Market Research, Customer Success, Consulting & Professional Services), By Industry (Healthcare, Legal, Financial, Education, and Others), By Region - Forecast Till 2034


ID: MRFR/ICT/10697-HCR | 215 Pages | Author: Aarti Dhapte| May 2025
Leading companies partner with us for data-driven Insights
client_1 client_2 client_3 client_4 client_5 client_6 client_7 client_8 client_9 client_10
Please fill in Business Email for Quick Response


TABLE OF CONTENTS

1. EXECUTIVE SUMMARY

1.1. Market Attractiveness Analysis

1.2. Global AI Meeting Assistants Market, by Solution

1.3. Global AI Meeting Assistants Market, by Pricing Model

1.4. Global AI Meeting Assistants Market, by Application

1.5. Global AI Meeting Assistants Market, by Industry

1.6. Global AI Meeting Assistants Market, by Region

2. MARKET INTRODUCTION

2.1. Definition

2.2. Scope of the Study

2.3. Market Structure

3. RESEARCH METHODOLOGY

3.1. Research Process

3.2. Primary Research

3.3. Secondary Research

3.4. Market Size Estimation

3.5. Forecast Model

3.6. List of Assumptions

4. MARKET DYNAMICS

4.1. Introduction

4.2. Drivers

4.2.1. Increased demand for productivity tools

4.2.2. Advances in AI technology

4.2.3. Driver Impact Analysis

4.3. Restraints

4.3.1. Data privacy and security

4.4. Opportunities

4.4.1. Improved meeting efficiency

4.4.2. Enhanced collaboration

4.5. Impact Analysis of COVID Pandemic on the Market

4.5.1. Impact on ICT Industry

4.5.2. Impact on AI Meeting Assistants Market

4.5.3. Impact on AI Meeting Assistants Providers

4.5.4. Covid-19 Impact on End-Use Industry

5. MARKET FACTOR ANALYSIS

5.1. Value Chain Analysis/Supply Chain Analysis

5.2. Porter’s Five Forces Model

5.2.1. Bargaining Power of Suppliers

5.2.2. Bargaining Power of Buyers

5.2.3. Threat of New Entrants

5.2.4. Threat of Substitutes

5.2.5. Intensity of Rivalry

6. GLOBAL AI MEETING ASSISTANTS MARKET SIZE ESTIMATION & FORECAST, BY SOLUTION

6.1. Introduction

6.2. Chat

6.3. AI Writer

6.4. Real Time Transcription and Tagging

6.5. Post-meeting Solution

6.6. Insight Management

6.7. Others

7. GLOBAL AI MEETING ASSISTANTS MARKET SIZE ESTIMATION & FORECAST, BY PRICING MODEL

7.1. Introduction

7.2. Free Plan

7.3. Chargeable

8. GLOBAL AI MEETING ASSISTANTS MARKET SIZE ESTIMATION & FORECAST, BY APPLICATION

8.1. Introduction

8.2. Sales

8.3. Business Development

8.4. Content Marketing

8.5. Product and Market Research

8.6. Customer Success

8.7. Consulting & Professional Services

9. GLOBAL AI MEETING ASSISTANTS MARKET SIZE ESTIMATION & FORECAST, BY INDUSTRY

9.1. Introduction

9.2. Healthcare

9.3. Legal

9.4. Financial

9.5. Education

9.6. Others

10. GLOBAL AI MEETING ASSISTANTS MARKET SIZE ESTIMATION & FORECAST, BY REGION

10.1. Introduction

10.2. North America

10.2.1. Market Estimates & Forecast, By Country, 2019–2032

10.2.2. Market Estimates & Forecast, By Solution, 2019–2032

10.2.3. Market Estimates & Forecast, By Pricing Model, 2019–2032

10.2.4. Market Estimates & Forecast, By Application, 2019–2032

10.2.5. Market Estimates & Forecast, By Industry, 2019–2032

10.2.6. US

10.2.6.1. Market Estimates & Forecast, By Solution, 2019–2032

10.2.6.2. Market Estimates & Forecast, By Pricing Model, 2019–2032

10.2.6.3. Market Estimates & Forecast, By Application, 2019–2032

10.2.6.4. Market Estimates & Forecast, By Industry, 2019–2032

10.2.7. Canada

10.2.7.1. Market Estimates & Forecast, By Solution, 2019–2032

10.2.7.2. Market Estimates & Forecast, By Pricing Model, 2019–2032

10.2.7.3. Market Estimates & Forecast, By Application, 2019–2032

10.2.7.4. Market Estimates & Forecast, By Industry,2019–2032

10.2.8. Mexico

10.2.8.1. Market Estimates & Forecast, By Solution, 2019–2032

10.2.8.2. Market Estimates & Forecast, By Pricing Model, 2019–2032

10.2.8.3. Market Estimates & Forecast, By Application, 2019–2032

10.2.8.4. Market Estimates & Forecast, By Industry,2019–2032

10.3. Europe

10.3.1. Market Estimates & Forecast, By Country, 2019–2032

10.3.2. Market Estimates & Forecast, By Solution, 2019–2032

10.3.3. Market Estimates & Forecast, By Pricing Model, 2019–2032

10.3.4. Market Estimates & Forecast, By Application, 2019–2032

10.3.5. Market Estimates & Forecast, By Industry, 2019–2032

10.3.6. Germany

10.3.6.1. Market Estimates & Forecast, By Solution, 2019–2032

10.3.6.2. Market Estimates & Forecast, By Pricing Model, 2019–2032

10.3.6.3. Market Estimates & Forecast, By Application, 2019–2032

10.3.6.4. Market Estimates & Forecast, By Industry,2019–2032

10.3.7. UK

10.3.7.1. Market Estimates & Forecast, By Solution, 2019–2032

10.3.7.2. Market Estimates & Forecast, By Pricing Model, 2019–2032

10.3.7.3. Market Estimates & Forecast, By Application, 2019–2032

10.3.7.4. Market Estimates & Forecast, By Industry,2019–2032

10.3.8. France

10.3.8.1. Market Estimates & Forecast, By Solution, 2019–2032

10.3.8.2. Market Estimates & Forecast, By Pricing Model, 2019–2032

10.3.8.3. Market Estimates & Forecast, By Application, 2019–2032

10.3.8.4. Market Estimates & Forecast, By Industry,2019–2032

10.3.9. Rest of Europe

10.3.9.1. Market Estimates & Forecast, By Solution, 2019–2032

10.3.9.2. Market Estimates & Forecast, By Pricing Model, 2019–2032

10.3.9.3. Market Estimates & Forecast, By Application, 2019–2032

10.3.9.4. Market Estimates & Forecast, By Industry,2019–2032

10.4. Asia Pacific

10.4.1. Market Estimates & Forecast, By Country, 2019–2032

10.4.2. Market Estimates & Forecast, By Solution, 2019–2032

10.4.3. Market Estimates & Forecast, By Pricing Model, 2019–2032

10.4.4. Market Estimates & Forecast, By Application, 2019–2032

10.4.5. Market Estimates & Forecast, By Industry, 2019–2032

10.4.6. China

10.4.6.1. Market Estimates & Forecast, By Solution, 2019–2032

10.4.6.2. Market Estimates & Forecast, By Pricing Model, 2019–2032

10.4.6.3. Market Estimates & Forecast, By Application, 2019–2032

10.4.6.4. Market Estimates & Forecast, By Industry,2019–2032

10.4.7. India

10.4.7.1. Market Estimates & Forecast, By Solution, 2019–2032

10.4.7.2. Market Estimates & Forecast, By Pricing Model, 2019–2032

10.4.7.3. Market Estimates & Forecast, By Application, 2019–2032

10.4.7.4. Market Estimates & Forecast, By Industry,2019–2032

10.4.8. Japan

10.4.8.1. Market Estimates & Forecast, By Solution, 2019–2032

10.4.8.2. Market Estimates & Forecast, By Pricing Model, 2019–2032

10.4.8.3. Market Estimates & Forecast, By Application, 2019–2032

10.4.8.4. Market Estimates & Forecast, By Industry,2019–2032

10.4.9. Rest of Asia Pacific

10.4.9.1. Market Estimates & Forecast, By Solution, 2019–2032

10.4.9.2. Market Estimates & Forecast, By Pricing Model, 2019–2032

10.4.9.3. Market Estimates & Forecast, By Application, 2019–2032

10.4.9.4. Market Estimates & Forecast, By Industry,2019–2032

10.5. Middle East and Africa

10.5.1. Market Estimates & Forecast, By Solution, 2019–2032

10.5.2. Market Estimates & Forecast, By Pricing Model, 2019–2032

10.5.3. Market Estimates & Forecast, By Application, 2019–2032

10.5.4. Market Estimates & Forecast, By Industry, 2019–2032

10.6. South America

10.6.1. Market Estimates & Forecast, By Solution, 2019–2032

10.6.2. Market Estimates & Forecast, By Pricing Model, 2019–2032

10.6.3. Market Estimates & Forecast, By Application, 2019–2032

10.6.4. Market Estimates & Forecast, By Industry, 2019–2032

11. COMPETITIVE LANDSCAPE

11.1. Introduction

11.2. Competitive Analysis

11.3. Market Share Analysis, 2021 (%)

11.4. Major Growth Strategy in the Global AI Meeting Assistants Market

11.5. Competitive Benchmarking

11.6. Key Developments & Growth Strategies

11.6.1. New Industry Vertical Development

11.6.2. Merger & Acquisition

11.6.3. Contracts & Agreements

12. COMPANY PROFILES

12.1. Laxis, Inc.

12.1.1. Company Overview

12.1.2. Financial Overview

12.1.3. Products Offered

12.1.4. Key Developments

12.1.5. SWOT Analysis

12.1.6. Key Strategies

12.2. Fireflies

12.2.1. Company Overview

12.2.2. Financial Overview

12.2.3. Products Offered

12.2.4. Key Developments

12.2.5. SWOT Analysis

12.2.6. Key Strategies

12.3. Airgram

12.3.1. Company Overview

12.3.2. Financial Overview

12.3.3. Products Offered

12.3.4. Key Developments

12.3.5. SWOT Analysis

12.3.6. Key Strategies

12.4. Krisp

12.4.1. Company Overview

12.4.2. Financial Overview

12.4.3. Products Offered

12.4.4. Key Developments

12.4.5. SWOT Analysis

12.4.6. Key Strategies

12.5. Avoma

12.5.1. Company Overview

12.5.2. Financial Overview

12.5.3. Products Offered

12.5.4. Key Developments

12.5.5. SWOT Analysis

12.5.6. Key Strategies

12.6. tl;dv

12.6.1. Company Overview

12.6.2. Financial Overview

12.6.3. Products Offered

12.6.4. Key Developments

12.6.5. SWOT Analysis

12.6.6. Key Strategies

12.7. Equal Time

12.7.1. Company Overview

12.7.2. Financial Overview

12.7.3. Products Offered

12.7.4. Key Developments

12.7.5. SWOT Analysis

12.7.6. Key Strategies

12.8. Rewatch

12.8.1. Company Overview

12.8.2. Financial Overview

12.8.3. Products Offered

12.8.4. Key Developments

12.8.5. SWOT Analysis

12.8.6. Key Strategies

12.9. Nyota

12.9.1. Company Overview

12.9.2. Financial Overview

12.9.3. Products Offered

12.9.4. Key Developments

12.9.5. SWOT Analysis

12.9.6. Key Strategies

12.10. Fellow

12.10.1. Company Overview

12.10.2. Financial Overview

12.10.3. Products Offered

12.10.4. Key Developments

12.10.5. SWOT Analysis

12.10.6. Key Strategies

12.11. Fathom

12.11.1. Company Overview

12.11.2. Financial Overview

12.11.3. Products Offered

12.11.4. Key Developments

12.11.5. SWOT Analysis

12.11.6. Key Strategies

LIST OF TABLES

TABLE 1 MARKET SYNOPSIS 19

TABLE 2 GLOBAL AI MEETING ASSISTANTS MARKET, BY SOLUTION, 2019–2032 (USD MILLION) 52

TABLE 3 GLOBAL AI MEETING ASSISTANTS MARKET, BY PRICING MODEL, 2019–2032 (USD MILLION) 55

TABLE 4 GLOBAL AI MEETING ASSISTANTS MARKET, BY APPLICATION, 2019–2032 (USD MILLION) 57

TABLE 5 GLOBAL AI MEETING ASSISTANTS MARKET, BY INDUSTRY, 2019–2032 (USD MILLION) 57

TABLE 6 GLOBAL AI MEETING ASSISTANTS MARKET, BY REGION, 2019–2032 (USD MILLION) 61

TABLE 7 NORTH AMERICA AI MEETING ASSISTANTS MARKET, BY COUNTRY, 2019–2032 (USD MILLION) 63

TABLE 8 NORTH AMERICA AI MEETING ASSISTANTS MARKET, BY SOLUTION, 2019–2032 (USD MILLION) 64

TABLE 9 NORTH AMERICA AI MEETING ASSISTANTS MARKET, BY PRICING MODEL, 2019–2032 (USD MILLION) 65

TABLE 10 NORTH AMERICA AI MEETING ASSISTANTS MARKET, BY APPLICATION, 2019–2032 (USD MILLION) 66

TABLE 11 NORTH AMERICA AI MEETING ASSISTANTS MARKET, BY INDUSTRY, 2019–2032 (USD MILLION) 66

TABLE 12 US AI MEETING ASSISTANTS MARKET, BY SOLUTION, 2019–2032 (USD MILLION) 68

TABLE 13 US AI MEETING ASSISTANTS MARKET, BY PRICING MODEL, 2019–2032 (USD MILLION) 68

TABLE 14 US AI MEETING ASSISTANTS MARKET, BY APPLICATION, 2019–2032 (USD MILLION) 68

TABLE 15 US AI MEETING ASSISTANTS MARKET, BY INDUSTRY, 2019–2032 (USD MILLION) 68

TABLE 16 CANADA AI MEETING ASSISTANTS MARKET, BY SOLUTION, 2019–2032 (USD MILLION) 70

TABLE 17 CANADA AI MEETING ASSISTANTS MARKET, BY PRICING MODEL, 2019–2032 (USD MILLION) 71

TABLE 18 CANADA AI MEETING ASSISTANTS MARKET, BY APPLICATION, 2019–2032 (USD MILLION) 71

TABLE 19 CANADA AI MEETING ASSISTANTS MARKET, BY INDUSTRY, 2019–2032 (USD MILLION) 71

TABLE 20 MEXICO AI MEETING ASSISTANTS MARKET, BY SOLUTION, 2019–2032 (USD MILLION) 73

TABLE 21 MEXICO AI MEETING ASSISTANTS MARKET, BY PRICING MODEL, 2019–2032 (USD MILLION) 74

TABLE 22 MEXICO AI MEETING ASSISTANTS MARKET, BY APPLICATION, 2019–2032 (USD MILLION) 74

TABLE 23 MEXICO AI MEETING ASSISTANTS MARKET, BY INDUSTRY, 2019–2032 (USD MILLION) 74

TABLE 24 EUROPE AI MEETING ASSISTANTS MARKET, BY COUNTRY, 2019–2032 (USD MILLION) 77

TABLE 25 EUROPE AI MEETING ASSISTANTS MARKET, BY SOLUTION, 2019–2032 (USD MILLION) 78

TABLE 26 EUROPE AI MEETING ASSISTANTS MARKET, BY PRICING MODEL, 2019–2032 (USD MILLION) 79

TABLE 27 EUROPE AI MEETING ASSISTANTS MARKET, BY APPLICATION, 2019–2032 (USD MILLION) 80

TABLE 28 EUROPE AI MEETING ASSISTANTS MARKET, BY INDUSTRY, 2019–2032 (USD MILLION) 80

TABLE 29 UK AI MEETING ASSISTANTS MARKET, BY SOLUTION, 2019–2032 (USD MILLION) 81

TABLE 30 UK AI MEETING ASSISTANTS MARKET, BY PRICING MODEL, 2019–2032 (USD MILLION) 82

TABLE 31 UK AI MEETING ASSISTANTS MARKET, BY APPLICATION, 2019–2032 (USD MILLION) 82

TABLE 32 UK AI MEETING ASSISTANTS MARKET, BY INDUSTRY, 2019–2032 (USD MILLION) 82

TABLE 33 GERMANY AI MEETING ASSISTANTS MARKET, BY SOLUTION, 2019–2032 (USD MILLION) 85

TABLE 34 GERMANY AI MEETING ASSISTANTS MARKET, BY PRICING MODEL, 2019–2032 (USD MILLION) 85

TABLE 35 GERMANY AI MEETING ASSISTANTS MARKET, BY APPLICATION, 2019–2032 (USD MILLION) 85

TABLE 36 GERMANY AI MEETING ASSISTANTS MARKET, BY INDUSTRY, 2019–2032 (USD MILLION) 85

TABLE 37 FRANCE AI MEETING ASSISTANTS MARKET, BY SOLUTION, 2019–2032 (USD MILLION) 87

TABLE 38 FRANCE AI MEETING ASSISTANTS MARKET, BY PRICING MODEL, 2019–2032 (USD MILLION) 88

TABLE 39 FRANCE AI MEETING ASSISTANTS MARKET, BY APPLICATION, 2019–2032 (USD MILLION) 88

TABLE 40 FRANCE AI MEETING ASSISTANTS MARKET, BY INDUSTRY, 2019–2032 (USD MILLION) 88

TABLE 41 SPAIN AI MEETING ASSISTANTS MARKET, BY SOLUTION, 2019–2032 (USD MILLION) 90

TABLE 42 SPAIN AI MEETING ASSISTANTS MARKET, BY PRICING MODEL, 2019–2032 (USD MILLION) 90

TABLE 43 SPAIN AI MEETING ASSISTANTS MARKET, BY APPLICATION, 2019–2032 (USD MILLION) 91

TABLE 44 SPAIN AI MEETING ASSISTANTS MARKET, BY INDUSTRY, 2019–2032 (USD MILLION) 91

TABLE 45 ITALY AI MEETING ASSISTANTS MARKET, BY SOLUTION, 2019–2032 (USD MILLION) 92

TABLE 46 ITALY AI MEETING ASSISTANTS MARKET, BY PRICING MODEL, 2019–2032 (USD MILLION) 93

TABLE 47 ITALY AI MEETING ASSISTANTS MARKET, BY APPLICATION, 2019–2032 (USD MILLION) 93

TABLE 48 ITALY AI MEETING ASSISTANTS MARKET, BY INDUSTRY, 2019–2032 (USD MILLION) 93

TABLE 49 REST OF EUROPE AI MEETING ASSISTANTS MARKET, BY SOLUTION, 2019–2032 (USD MILLION) 95

TABLE 50 REST OF EUROPE AI MEETING ASSISTANTS MARKET, BY PRICING MODEL, 2019–2032 (USD MILLION) 96

TABLE 51 REST OF EUROPE AI MEETING ASSISTANTS MARKET, BY APPLICATION, 2019–2032 (USD MILLION) 96

TABLE 52 REST OF EUROPE AI MEETING ASSISTANTS MARKET, BY INDUSTRY, 2019–2032 (USD MILLION) 96

TABLE 53 ASIA-PACIFIC AI MEETING ASSISTANTS MARKET, BY COUNTRY, 2019–2032 (USD MILLION) 99

TABLE 54 ASIA-PACIFIC AI MEETING ASSISTANTS MARKET, BY SOLUTION, 2019–2032 (USD MILLION) 100

TABLE 55 ASIA-PACIFIC AI MEETING ASSISTANTS MARKET, BY PRICING MODEL, 2019–2032 (USD MILLION) 101

TABLE 56 ASIA-PACIFIC AI MEETING ASSISTANTS MARKET, BY APPLICATION, 2019–2032 (USD MILLION) 102

TABLE 57 ASIA-PACIFIC AI MEETING ASSISTANTS MARKET, BY INDUSTRY, 2019–2032 (USD MILLION) 102

TABLE 58 CHINA AI MEETING ASSISTANTS MARKET, BY SOLUTION, 2019–2032 (USD MILLION) 103

TABLE 59 CHINA AI MEETING ASSISTANTS MARKET, BY PRICING MODEL, 2019–2032 (USD MILLION) 104

TABLE 60 CHINA AI MEETING ASSISTANTS MARKET, BY APPLICATION, 2019–2032 (USD MILLION) 104

TABLE 61 CHINA AI MEETING ASSISTANTS MARKET, BY INDUSTRY, 2019–2032 (USD MILLION) 104

TABLE 62 JAPAN AI MEETING ASSISTANTS MARKET, BY SOLUTION, 2019–2032 (USD MILLION) 105

TABLE 63 JAPAN AI MEETING ASSISTANTS MARKET, BY PRICING MODEL, 2019–2032 (USD MILLION) 106

TABLE 64 JAPAN AI MEETING ASSISTANTS MARKET, BY APPLICATION, 2019–2032 (USD MILLION) 106

TABLE 65 JAPAN AI MEETING ASSISTANTS MARKET, BY INDUSTRY, 2019–2032 (USD MILLION) 106

TABLE 66 INDIA AI MEETING ASSISTANTS MARKET, BY SOLUTION, 2019–2032 (USD MILLION) 108

TABLE 67 INDIA AI MEETING ASSISTANTS MARKET, BY PRICING MODEL, 2019–2032 (USD MILLION) 109

TABLE 68 INDIA AI MEETING ASSISTANTS MARKET, BY APPLICATION, 2019–2032 (USD MILLION) 109

TABLE 69 INDIA AI MEETING ASSISTANTS MARKET, BY INDUSTRY, 2019–2032 (USD MILLION) 109

TABLE 70 SOUTH KOREA AI MEETING ASSISTANTS MARKET, BY SOLUTION, 2019–2032 (USD MILLION) 111

TABLE 71 SOUTH KOREA AI MEETING ASSISTANTS MARKET, BY PRICING MODEL, 2019–2032 (USD MILLION) 111

TABLE 72 SOUTH KOREA AI MEETING ASSISTANTS MARKET, BY APPLICATION, 2019–2032 (USD MILLION) 112

TABLE 73 SOUTH KOREA AI MEETING ASSISTANTS MARKET, BY INDUSTRY, 2019–2032 (USD MILLION) 112

TABLE 74 REST OF ASIA-PACIFIC AI MEETING ASSISTANTS MARKET, BY SOLUTION, 2019–2032 (USD MILLION) 113

TABLE 75 REST OF ASIA-PACIFIC AI MEETING ASSISTANTS MARKET, BY PRICING MODEL, 2019–2032 (USD MILLION) 114

TABLE 76 REST OF ASIA-PACIFIC AI MEETING ASSISTANTS MARKET, BY APPLICATION, 2019–2032 (USD MILLION) 115

TABLE 77 REST OF ASIA-PACIFIC AI MEETING ASSISTANTS MARKET, BY INDUSTRY, 2019–2032 (USD MILLION) 115

TABLE 78 SOUTH AMERICA AI MEETING ASSISTANTS MARKET, BY SOLUTION, 2019–2032 (USD MILLION) 117

TABLE 79 SOUTH AMERICA AI MEETING ASSISTANTS MARKET, BY PRICING MODEL, 2019–2032 (USD MILLION) 119

TABLE 80 SOUTH AMERICA AI MEETING ASSISTANTS MARKET, BY APPLICATION, 2019–2032 (USD MILLION) 120

TABLE 81 SOUTH AMERICA AI MEETING ASSISTANTS MARKET, BY INDUSTRY, 2019–2032 (USD MILLION) 120

TABLE 82 MIDDLE EAST & AFRICA AI MEETING ASSISTANTS MARKET, BY SOLUTION, 2019–2032 (USD MILLION) 122

TABLE 83 MIDDLE EAST & AFRICA AI MEETING ASSISTANTS MARKET, BY PRICING MODEL, 2019–2032 (USD MILLION) 123

TABLE 84 MIDDLE EAST & AFRICA AI MEETING ASSISTANTS MARKET, BY APPLICATION, 2019–2032 (USD MILLION) 124

TABLE 85 MIDDLE EAST & AFRICA AI MEETING ASSISTANTS MARKET, BY INDUSTRY, 2019–2032 (USD MILLION) 124

TABLE 86 BUSINESS EXPANSIONS/PRODUCT LAUNCHES 128

TABLE 87 PARTNERSHIPS/AGREEMENTS/CONTRACTS/COLLABORATIONS 130

TABLE 88 ACQUISITIONS/MERGERS 135

TABLE 89 LAXIS, INC. : PRODUCTS OFFERED 138

TABLE 90 LAXIS, INC. : KEY DEVELOPMENT 139

TABLE 91 FIREFLIES : PRODUCTS OFFERED 142

TABLE 92 FIREFLIES : KEY DEVELOPMENT 143

TABLE 93 AIRGRAM : PRODUCTS OFFERED 146

TABLE 94 AIRGRAM : KEY DEVELOPMENT 147

TABLE 95 KRISP : PRODUCTS OFFERED 150

TABLE 96 KRISP : KEY DEVELOPMENT 151

TABLE 97 AVOMA : PRODUCTS OFFERED 154

TABLE 98 AVOMA : KEY DEVELOPMENT 154

TABLE 99 TL;DV : PRODUCTS OFFERED 158

TABLE 100 TL;DV : KEY DEVELOPMENT 158

TABLE 101 EQUAL TIME : PRODUCTS OFFERED 161

TABLE 102 EQUAL TIME : KEY DEVELOPMENT 161

TABLE 103 REWATCH : PRODUCTS OFFERED 165

TABLE 104 REWATCH : KEY DEVELOPMENT 166

TABLE 105 NYOTA : PRODUCTS OFFERED 169

TABLE 106 NYOTA : KEY DEVELOPMENT 170

TABLE 107 FELLOW : PRODUCTS OFFERED 172

TABLE 108 FELLOW : KEY DEVELOPMENT 174

TABLE 109 FATHOM : PRODUCTS OFFERED 176

TABLE 110 FATHOM : KEY DEVELOPMENT 178

LIST OF FIGURES

FIGURE 1 MARKET ATTRACTIVENESS ANALYSIS: GLOBAL AI MEETING ASSISTANTS MARKET 20

FIGURE 2 GLOBAL AI MEETING ASSISTANTS MARKET: MARKET STRUCTURE 22

FIGURE 3 BOTTOM-UP AND TOP-DOWN APPROACHES 27

FIGURE 4 NORTH AMERICA: AI MEETING ASSISTANTS MARKET SIZE (USD MILLION) & MARKET SHARE (%), BY COUNTRY (2022 VS 2032) 30

FIGURE 5 EUROPE: AI MEETING ASSISTANTS MARKET SIZE (USD MILLION) & MARKET SHARE (%), BY COUNTRY (2022 VS 2032) 30

FIGURE 6 ASIA–PACIFIC: AI MEETING ASSISTANTS MARKET SIZE (USD MILLION) & MARKET SHARE (%), BY COUNTRY (2022 VS 2032) 31

FIGURE 7 GLOBAL AI MEETING ASSISTANTS MARKET SIZE (USD MILLION) & MARKET SHARE (%), BY SOLUTION (2022 VS 2032) 32

FIGURE 8 GLOBAL AI MEETING ASSISTANTS MARKET SIZE (USD MILLION) & MARKET SHARE (%), BY PRICING MODEL (2022 VS 2032) 32

FIGURE 9 GLOBAL AI MEETING ASSISTANTS MARKET SIZE (USD MILLION) & MARKET SHARE (%), BY APPLICATION (2022 VS 2032) 33

FIGURE 10 GLOBAL AI MEETING ASSISTANTS MARKET SIZE (USD MILLION) & MARKET SHARE (%), BY INDUSTRY (2022 VS 2032) 34

FIGURE 11 MARKET DYNAMIC ANALYSIS OF THE GLOBAL AI MEETING ASSISTANTS MARKET 34

FIGURE 12 DRIVER IMPACT ANALYSIS 35

FIGURE 13 RESTRAINT IMPACT ANALYSIS 37

FIGURE 14 VALUE CHAIN: GLOBAL AI MEETING ASSISTANTS MARKET 37

FIGURE 15 PORTER'S FIVE FORCES ANALYSIS OF THE GLOBAL AI MEETING ASSISTANTS MARKET 43

FIGURE 16 GLOBAL AI MEETING ASSISTANTS MARKET, BY SOLUTION, 2022 (% SHARE) 45

FIGURE 17 GLOBAL AI MEETING ASSISTANTS MARKET, BY SOLUTION, 2022 VS 2032 (USD MILLION) 48

FIGURE 18 GLOBAL AI MEETING ASSISTANTS MARKET, BY PRICING MODEL, 2022 (% SHARE) 48

FIGURE 19 GLOBAL AI MEETING ASSISTANTS MARKET, BY PRICING MODEL, 2022 VS 2032 (USD MILLION) 51

FIGURE 20 GLOBAL AI MEETING ASSISTANTS MARKET, BY APPLICATION, 2022 (% SHARE) 51

FIGURE 21 GLOBAL AI MEETING ASSISTANTS MARKET, BY APPLICATION, 2022 VS 2032 (USD MILLION) 54

FIGURE 22 GLOBAL AI MEETING ASSISTANTS MARKET, BY INDUSTRY, 2022 (% SHARE) 54

FIGURE 23 GLOBAL AI MEETING ASSISTANTS MARKET, BY INDUSTRY, 2022 VS 2032 (USD MILLION) 56

FIGURE 24 GLOBAL AI MEETING ASSISTANTS MARKET, BY REGION, 2022 (% SHARE) 56

FIGURE 25 GLOBAL AI MEETING ASSISTANTS MARKET, BY REGION, 2022 VS 2032 (USD MILLION) 56

FIGURE 26 NORTH AMERICA AI MEETING ASSISTANTS MARKET, BY COUNTRY, 2022 (% SHARE) 56

FIGURE 27 NORTH AMERICA AI MEETING ASSISTANTS MARKET, BY COUNTRY, 2022 VS 2032 (USD MILLION) 56

FIGURE 28 NORTH AMERICA AI MEETING ASSISTANTS MARKET, BY SOLUTION, 2022-2032 (USD MILLION) 60

FIGURE 29 NORTH AMERICA AI MEETING ASSISTANTS MARKET, BY PRICING MODEL, 2022-2032 (USD MILLION) 62

FIGURE 30 NORTH AMERICA AI MEETING ASSISTANTS MARKET, BY APPLICATION, 2022-2032 (USD MILLION) 62

FIGURE 31 NORTH AMERICA AI MEETING ASSISTANTS MARKET, BY INDUSTRY, 2022-2032 (USD MILLION) 63

FIGURE 32 EUROPE AI MEETING ASSISTANTS MARKET, BY COUNTRY, 2022 (% SHARE) 64

FIGURE 33 EUROPE AI MEETING ASSISTANTS MARKET, BY COUNTRY, 2022 VS 2032 (USD MILLION) 65

FIGURE 34 EUROPE AI MEETING ASSISTANTS MARKET, BY SOLUTION, 2022-2032 (USD MILLION) 65

FIGURE 35 EUROPE AI MEETING ASSISTANTS MARKET, BY PRICING MODEL, 2022-2032 (USD MILLION) 65

FIGURE 36 EUROPE AI MEETING ASSISTANTS MARKET, BY APPLICATION, 2022-2032 (USD MILLION) 65

FIGURE 37 EUROPE AI MEETING ASSISTANTS MARKET, BY INDUSTRY, 2022-2032 (USD MILLION) 76

FIGURE 38 ASIA-PACIFIC AI MEETING ASSISTANTS MARKET, BY COUNTRY, 2022 (% SHARE) 77

FIGURE 39 ASIA-PACIFIC AI MEETING ASSISTANTS MARKET, BY COUNTRY, 2022 VS 2032 (USD MILLION) 78

FIGURE 40 ASIA-PACIFIC AI MEETING ASSISTANTS MARKET, BY SOLUTION, 2022-2032 (USD MILLION) 79

FIGURE 41 ASIA-PACIFIC AI MEETING ASSISTANTS MARKET, BY PRICING MODEL, 2022-2032 (USD MILLION) 80

FIGURE 42 ASIA-PACIFIC AI MEETING ASSISTANTS MARKET, BY APPLICATION, 2022-2032 (USD MILLION) 80

FIGURE 43 ASIA-PACIFIC AI MEETING ASSISTANTS MARKET, BY INDUSTRY, 2022-2032 (USD MILLION) 80

FIGURE 44 MIDDLE EAST AI MEETING ASSISTANTS MARKET, BY COUNTRY, 2022 VS 2032 (USD MILLION) 98

FIGURE 45 MIDDLE EAST AI MEETING ASSISTANTS MARKET, BY SOLUTION, 2022-2032 (USD MILLION) 99

FIGURE 46 MIDDLE EAST AI MEETING ASSISTANTS MARKET, BY PRICING MODEL, 2022-2032 (USD MILLION) 100

FIGURE 47 MIDDLE EAST AI MEETING ASSISTANTS MARKET, BY APPLICATION, 2022-2032 (USD MILLION) 101

FIGURE 48 MIDDLE EAST AI MEETING ASSISTANTS MARKET, BY INDUSTRY, 2022-2032 (USD MILLION) 101

FIGURE 49 AFRICA AI MEETING ASSISTANTS MARKET, BY SOLUTION, 2022-2032 (USD MILLION) 101

FIGURE 50 AFRICA AI MEETING ASSISTANTS MARKET, BY PRICING MODEL, 2022-2032 (USD MILLION) 101

FIGURE 51 AFRICA AI MEETING ASSISTANTS MARKET, BY APPLICATION, 2022-2032 (USD MILLION) 117

FIGURE 52 AFRICA AI MEETING ASSISTANTS MARKET, BY INDUSTRY, 2022-2032 (USD MILLION) 118

FIGURE 53 MIDDLE EAST & AFRICA AI MEETING ASSISTANTS MARKET, BY SOLUTION, 2022-2032 (USD MILLION) 119

FIGURE 54 MIDDLE EAST & AFRICA AI MEETING ASSISTANTS MARKET, BY PRICING MODEL, 2022-2032 (USD MILLION) 119

FIGURE 55 MIDDLE EAST & AFRICA AI MEETING ASSISTANTS MARKET, BY APPLICATION, 2022-2032 (USD MILLION) 119

FIGURE 56 MIDDLE EAST & AFRICA AI MEETING ASSISTANTS MARKET, BY INDUSTRY, 2022-2032 (USD MILLION) 122

FIGURE 57 GLOBAL AI MEETING ASSISTANTS MARKET: COMPETITIVE BENCHMARKING 123

FIGURE 58 VENDOR SHARE ANALYSIS (2022) (%) 124

FIGURE 59 LAXIS, INC. : FINANCIAL OVERVIEW SNAPSHOT 125

FIGURE 60 LAXIS, INC. : SWOT ANALYSIS 126

FIGURE 61 FIREFLIES : FINANCIAL OVERVIEW SNAPSHOT 127

FIGURE 62 FIREFLIES : SWOT ANALYSIS 128

FIGURE 63 AIRGRAM : FINANCIAL OVERVIEW SNAPSHOT 129

FIGURE 64 AIRGRAM : SWOT ANALYSIS 130

FIGURE 65 KRISP : FINANCIAL OVERVIEW SNAPSHOT 131

FIGURE 66 KRISP : SWOT ANALYSIS 132

FIGURE 67 AVOMA : FINANCIAL OVERVIEW SNAPSHOT 133

FIGURE 68 AVOMA : SWOT ANALYSIS 134

FIGURE 69 TL;DV : FINANCIAL OVERVIEW SNAPSHOT 135

FIGURE 70 TL;DV : SWOT ANALYSIS 136

FIGURE 71 EQUAL TIME : FINANCIAL OVERVIEW SNAPSHOT 137

FIGURE 72 EQUAL TIME : SWOT ANALYSIS 138

FIGURE 73 REWATCH : FINANCIAL OVERVIEW SNAPSHOT 139

FIGURE 74 REWATCH : SWOT ANALYSIS 140

FIGURE 75 NYOTA : FINANCIAL OVERVIEW SNAPSHOT 141

FIGURE 76 NYOTA : SWOT ANALYSIS 142

FIGURE 77 FELLOW : FINANCIAL OVERVIEW SNAPSHOT 143

FIGURE 78 FELLOW : SWOT ANALYSIS 144

FIGURE 79 FATHOM : FINANCIAL OVERVIEW SNAPSHOT 145

FIGURE 80 FATHOM : SWOT ANALYSIS 146

ï‚¡

Purchase Option
Single User $ 4,950
Multiuser License $ 5,950
Enterprise User $ 7,250
Compare Licenses
Tailored for You
  • Dedicated Research on any specifics segment or region.
  • Focused Research on specific players in the market.
  • Custom Report based only on your requirements.
  • Flexibility to add or subtract any chapter in the study.
  • Historic data from 2014 and forecasts outlook till 2040.
  • Flexibility of providing data/insights in formats (PDF, PPT, Excel).
  • Provide cross segmentation in applicable scenario/markets.
report-img