ID: MRFR/AGR/6367-HCR | February 2021 | Region: Global | 90 pages
Market Scenario
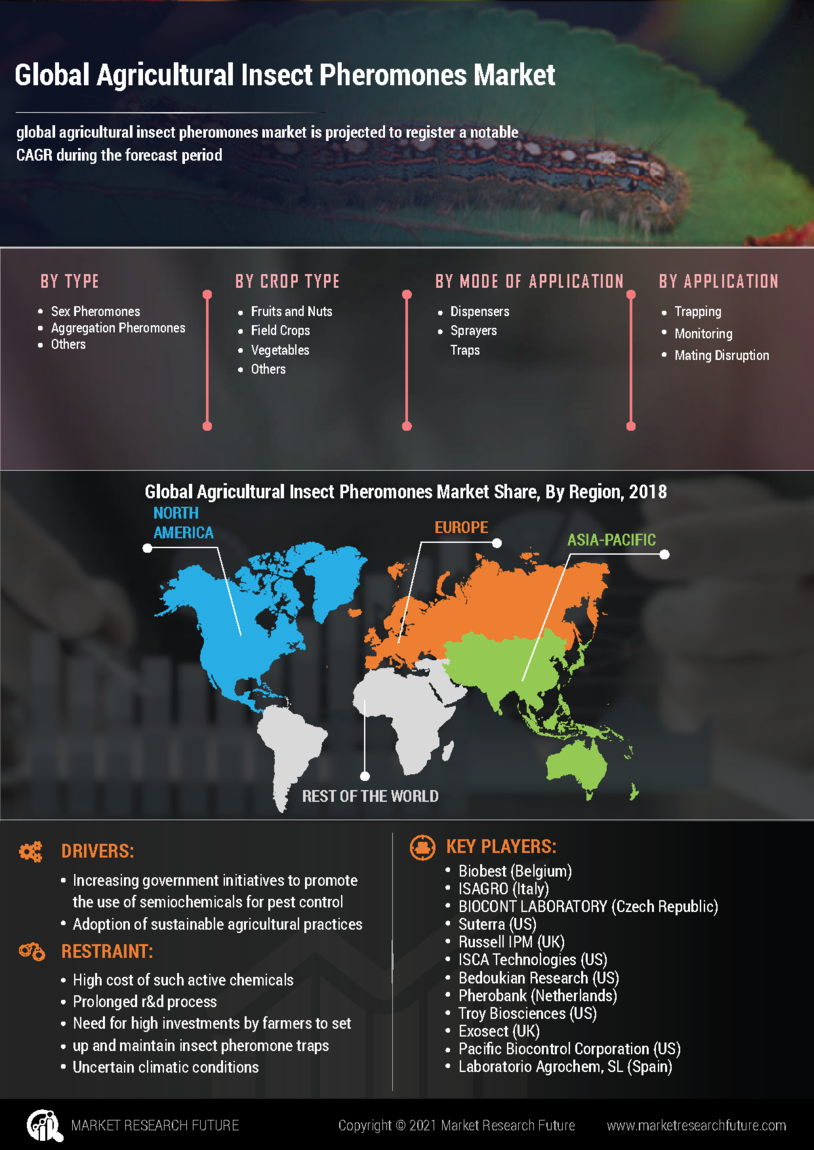
Agricultural insect pheromones are chemical signals that are used to trap, monitor, or disrupt insects that cause harm to fields. Pheromones are hormones secreted by insects to communicate with each other. Advances in technology and agricultural techniques have enabled farmers and market players to use insect pheromones as an integrated pest management method. The global agricultural insect pheromones market is projected to register a notable CAGR during the forecast period due to the surging adoption of sustainable agricultural practices. Farmers are opting for integrated pest management techniques including insect pheromone traps to maintain the economic threshold level (ETL) of insects in the field. Moreover, increasing government initiatives to promote the use of semiochemicals for pest control are also driving market growth.
The major factors hampering the growth of the global agricultural insect pheromones market are the high cost of such active chemicals, prolonged R&D process, and need for high investments by farmers to set up and maintain insect pheromone traps. Moreover, uncertain climatic conditions are also hampering the growth of the global agricultural insect pheromones market.
Segmentation
The global agricultural insect pheromones market has been segmented based on type, crop type, mode of application, application, and region.
By type, the global agricultural insect pheromones market has been classified as sex pheromones, aggregation pheromones, and others.
Based on crop type, the global agricultural insect pheromones market has been classified as fruits and nuts, field crops, vegetables, and others.
The global agricultural insect pheromones market has also been segregated, on the basis of mode of application, into dispensers, sprayers, and traps.
By application, the global agricultural insect pheromones market has also been classified as trapping, monitoring, and mating disruption.
The global agricultural insect pheromones market has been studied with regard to four key regions—North America, Europe, Asia-Pacific, and the rest of the world.
The North American agricultural insect pheromones market has further been segmented into the US, Canada, and Mexico. The European agricultural insect pheromones market has been classified as the UK, Germany, France, Italy, Spain, and the rest of Europe. The agricultural insect pheromones market in Asia-Pacific has been divided into China, India, Japan, Australia and New Zealand, and the rest of Asia-Pacific. The agricultural insect pheromones market in the rest of the world has been segmented into South America, the Middle East, and Africa.
Key Players
Biobest (Belgium), ISAGRO (Italy), BIOCONT LABORATORY (Czech Republic), Suterra (US), Russell IPM (UK), ISCA Technologies (US), Bedoukian Research (US), Pherobank (Netherlands), Troy Biosciences (US), Exosect (UK), Pacific Biocontrol Corporation (US), and Laboratorio Agrochem, SL (Spain) are some of the key players in the global agricultural insect pheromones market.
Regional Market Summary
Global Agricultural Insect Pheromones Market Share (%), by Region, 2018
Source: Secondary Sources and MRFR Analysis
North America is expected to dominate the global agricultural insect pheromones market during the review period owing to the high adoption of insect pheromone traps over conventional insecticides. However, the market in Asia-Pacific is expected to register the highest growth rate during the forecast period due to the increasing presence of market players in the region and rising adoption of insect pheromone traps by several fruit and field crop growers.
Global Agricultural Insect Pheromones Market, by Type
Global Agricultural Insect Pheromones Market, by Crop Type
Global Agricultural Insect Pheromones Market, by Mode of Application
Global Agricultural Insect Pheromones Market, by Application
Global Agricultural Insect Pheromones Market, by Region
North America
Asia-Pacific
Rest of the World (RoW)
Key Players in the Global Agricultural Insect Pheromones Market
Intended Audience
Frequently Asked Questions (FAQ) :
Agricultural insect pheromones market is driven the adoption of sustainable agricultural practices.
High cost of active chemicals and need for high investments by farmers are factors that can hamper the global insect pheromones market.
North America can dominate the global agricultural insect pheromones market due to adoption of insect pheromone traps.
APAC can register the highest growth rate in the global agricultural insect pheromones market.
Exosect, Suterra, Laboratorio Agrochem, SL, ISAGRO, Bedoukian Research, ISCA Technologies, Pacific Biocontrol Corporation, Troy Biosciences, Russell IPM, BIOCONT LABORATORY, Biobest, and Pherobank are notable players of the global agricultural insect pheromones market.
TABLE OF CONTENTS
1 Executive Summary
2 Scope of the Report
2.1 Market Definition
2.2 Scope of the Study
2.2.1 Research Objectives
2.2.2 Assumptions & Limitations
2.3 Market Structure
3 Market Research Methodology
3.1 Research Process
3.2 Secondary Research
3.3 Primary Research
3.4 Forecast Model
4 Market Landscape
4.1 Supply Chain Analysis
4.1.1 Raw Material Suppliers
4.1.2 Manufacturers/Producers
4.1.3 Distributors/Retailers/Wholesalers/E-Commerce
4.1.4 End Users
4.2 Porter’s Five Forces Analysis
4.2.1 Threat of New Entrants
4.2.2 Bargaining Power of Buyers
4.2.3 Bargaining Power of Suppliers
4.2.4 Threat of Substitutes
4.2.5 Internal Rivalry
5 Market Dynamics of the Global Agricultural Insect Pheromones Market
5.1 Introduction
5.2 Drivers
5.3 Restraints
5.4 Opportunities
5.5 Challenges
6. Global Agricultural Insect Pheromones 6 Market, by Type
6.1 Introduction
6.2 Sex Pheromones
6.2.1 Market Estimates & Forecast, 2019–2024
6.2.2 Market Estimates & Forecast, by Region, 2019–2024
6.3 Aggregation Pheromones
6.3.1 Market Estimates & Forecast, 2019–2024
6.3.2 Market Estimates & Forecast, by Region, 2019–2024
6.4 Others
6.4.1 Market Estimates & Forecast, 2019–2024
6.4.2 Market Estimates & Forecast, by Region, 2019–2024
7. Global Agricultural Insect Pheromones 7 Market, by Crop Type
7.1 Introduction
7.2 Fruits & Nuts
7.2.1 Market Estimates & Forecast, 2019–2024
7.2.2 Market Estimates & Forecast, by Region, 2019–2024
7.3 Field Crops
7.3.1 Market Estimates & Forecast, 2019–2024
7.3.2 Market Estimates & Forecast, by Region, 2019–2024
7.4 Vegetables
7.4.1 Market Estimates & Forecast, 2019–2024
7.4.2 Market Estimates & Forecast, by Region, 2019–2024
7.5 Others
7.5.1 Market Estimates & Forecast, 2019–2024
7.5.2 Market Estimates & Forecast, by Region, 2019–2024
8. Global Agricultural Insect Pheromones 8 Market, by Mode of Application
8.1 Introduction
8.2 Dispensers
8.2.1 Market Estimates & Forecast, 2019–2024
8.2.2 Market Estimates & Forecast, by Region, 2019–2024
8.3 Sprayers
8.3.1 Market Estimates & Forecast, 2019–2024
8.3.2 Market Estimates & Forecast, by Region, 2019–2024
8.4 Traps
8.4.1 Market Estimates & Forecast, 2019–2024
8.4.2 Market Estimates & Forecast, by Region, 2019–2024
9. Global Agricultural Insect Pheromones 9 Market, by Application
9.1 Introduction
9.2 Trapping
9.2.1 Market Estimates & Forecast, 2019–2024
9.2.2 Market Estimates & Forecast, by Region, 2019–2024
9.3 Monitoring
9.3.1 Market Estimates & Forecast, 2019–2024
9.3.2 Market Estimates & Forecast, by Region, 2019–2024
9.4 Mating Disruption
9.4.1 Market Estimates & Forecast, 2019–2024
9.4.2 Market Estimates & Forecast, by Region, 2019–2024
10. Global Agricultural Insect Pheromones Market, by Region
10.1 Introduction
10.2 North America
10.2.1 Market Estimates & Forecast, 2019–2024
10.2.2 Market Estimates & Forecast, by Type, 2019–2024
10.2.3 Market Estimates & Forecast, by Mode of Application, 2019–2024
10.2.4 Market Estimates & Forecast, by Crop Type, 2019–2024
10.2.5 Market Estimates & Forecast, by Application, 2019–2024
10.2.6 US
10.2.6.1 Market Estimates & Forecast, 2019–2024
10.2.6.2 Market Estimates & Forecast, by Type, 2019–2024
10.2.6.3 Market Estimates & Forecast, by Mode of Application, 2019–2024
10.2.6.4 Market Estimates & Forecast, by Crop Type, 2019–2024
10.2.6.5 Market Estimates & Forecast, by Application, 2019–2024
10.2.7 Canada
10.2.7.1 Market Estimates & Forecast, 2019–2024
10.2.7.2 Market Estimates & Forecast, by Type, 2019–2024
10.2.7.3 Market Estimates & Forecast, by Mode of Application, 2019–2024
10.2.7.4 Market Estimates & Forecast, by Crop Type, 2019–2024
10.2.7.5 Market Estimates & Forecast, by Application, 2019–2024
10.2.8 Mexico
10.2.8.1 Market Estimates & Forecast, 2019–2024
10.2.8.2 Market Estimates & Forecast, by Type, 2019–2024
10.2.8.3 Market Estimates & Forecast, by Mode of Application, 2019–2024
10.2.8.4 Market Estimates & Forecast, by Crop Type, 2019–2024
10.2.8.5 Market Estimates & Forecast, by Application, 2019–2024
10.3 Europe
10.3.1 Market Estimates & Forecast, 2019–2024
10.3.2 Market Estimates & Forecast, by Type, 2019–2024
10.3.3 Market Estimates & Forecast, by Mode of Application, 2019–2024
10.3.4 Market Estimates & Forecast, by Crop Type, 2019–2024
10.3.5 Market Estimates & Forecast, by Application, 2019–2024
10.3.6 Germany
10.3.6.1 Market Estimates & Forecast, 2019–2024
10.3.6.2 Market Estimates & Forecast, by Type, 2019–2024
10.3.6.3 Market Estimates & Forecast, by Mode of Application, 2019–2024
10.2.6.4 Market Estimates & Forecast, by Crop Type, 2019–2024
10.2.6.5 Market Estimates & Forecast, by Application, 2019–2024
10.3.7 France
10.3.7.1 Market Estimates & Forecast, 2019–2024
10.3.7.2 Market Estimates & Forecast, by Type, 2019–2024
10.3.7.3 Market Estimates & Forecast, by Mode of Application, 2019–2024
10.3.7.4 Market Estimates & Forecast, by Crop Type, 2019–2024
10.3.7.5 Market Estimates & Forecast, by Application, 2019–2024
10.3.8 Italy
10.3.8.1 Market Estimates & Forecast, 2019–2024
10.3.8.2 Market Estimates & Forecast, by Type, 2019–2024
10.3.8.3 Market Estimates & Forecast, by Mode of Application, 2019–2024
10.3.8.4 Market Estimates & Forecast, by Crop Type, 2019–2024
10.3.8.5 Market Estimates & Forecast, by Application, 2019–2024
10.3.9 Spain
10.3.9.1 Market Estimates & Forecast, 2019–2024
10.3.9.2 Market Estimates & Forecast, by Type, 2019–2024
10.3.9.3 Market Estimates & Forecast, by Mode of Application, 2019–2024
10.3.9.4 Market Estimates & Forecast, by Crop Type, 2019–2024
10.3.9.5 Market Estimates & Forecast, by Application, 2019–2024
10.3.10 UK
10.3.10.1 Market Estimates & Forecast, 2019–2024
10.3.10.2 Market Estimates & Forecast, by Type, 2019–2024
10.3.10.3 Market Estimates & Forecast, by Mode of Application, 2019–2024
10.3.10.4 Market Estimates & Forecast, by Crop Type, 2019–2024
10.3.10.4 Market Estimates & Forecast, by Application, 2019–2024
10.3.11 Rest of Europe
10.3.11.1 Market Estimates & Forecast, 2019–2024
10.3.11.2 Market Estimates & Forecast, by Type, 2019–2024
10.3.11.3 Market Estimates & Forecast, by Mode of Application, 2019–2024
10.3.11.4 Market Estimates & Forecast, by Crop Type, 2019–2024
10.3.11.5 Market Estimates & Forecast, by Application, 2019–2024
10.4 Asia-Pacific
10.4.1 Market Estimates & Forecast, 2019–2024
10.4.2 Market Estimates & Forecast, by Type, 2019–2024
10.4.3 Market Estimates & Forecast, by Mode of Application, 2019–2024
10.4.4 Market Estimates & Forecast, by Crop Type, 2019–2024
10.4.5 Market Estimates & Forecast, by Application, 2019–2024
10.4.6 China
10.4.6.1 Market Estimates & Forecast, 2019–2024
10.4.6.2 Market Estimates & Forecast, by Type, 2019–2024
10.4.6.3 Market Estimates & Forecast, by Mode of Application, 2019–2024
10.4.6.4 Market Estimates & Forecast, by Crop Type, 2019–2024
10.4.6.5 Market Estimates & Forecast, by Application, 2019–2024
10.4.7 India
10.4.7.1 Market Estimates & Forecast, 2019–2024
10.4.7.2 Market Estimates & Forecast, by Type, 2019–2024
10.4.7.3 Market Estimates & Forecast, by Mode of Application, 2019–2024
10.4.7.4 Market Estimates & Forecast, by Crop Type, 2019–2024
10.4.7.5 Market Estimates & Forecast, by Application, 2019–2024
10.4.8 Japan
10.4.8.1 Market Estimates & Forecast, 2019–2024
10.4.8.2 Market Estimates & Forecast, by Type, 2019–2024
10.4.8.3 Market Estimates & Forecast, by Mode of Application, 2019–2024
10.4.8.4 Market Estimates & Forecast, by Crop Type, 2019–2024
10.4.8.5 Market Estimates & Forecast, by Application, 2019–2024
10.4.9 Australia & New Zealand
10.4.9.1 Market Estimates & Forecast, 2019–2024
10.4.9.2 Market Estimates & Forecast, by Type, 2019–2024
10.4.9.3 Market Estimates & Forecast, by Mode of Application, 2019–2024
10.4.9.4 Market Estimates & Forecast, by Crop Type, 2019–2024
10.4.9.5 Market Estimates & Forecast, by Application, 2019–2024
10.4.10 Rest of Asia-Pacific
10.4.10.1 Market Estimates & Forecast, 2019–2024
10.4.10.2 Market Estimates & Forecast, by Type, 2019–2024
10.4.10.3 Market Estimates & Forecast, by Mode of Application, 2019–2024
10.4.10.4 Market Estimates & Forecast, by Crop Type, 2019–2024
10.4.10.5 Market Estimates & Forecast, by Application, 2019–2024
10.5 Rest of the World (RoW)
10.5.1 Market Estimates & Forecast, 2019–2024
10.5.2 Market Estimates & Forecast, by Type, 2019–2024
10.5.3 Market Estimates & Forecast, by Mode of Application, 2019–2024
10.5.4 Market Estimates & Forecast, by Crop Type, 2019–2024
10.5.5 Market Estimates & Forecast, by Application, 2019–2024
10.5.6 South America
10.5.6.1 Market Estimates & Forecast, 2019–2024
10.5.6.2 Market Estimates & Forecast, by Type, 2019–2024
10.5.6.3 Market Estimates & Forecast, by Mode of Application, 2019–2024
10.5.6.4 Market Estimates & Forecast, by Crop Type, 2019–2024
10.5.6.4 Market Estimates & Forecast, by Application, 2019–2024
10.5.7 Middle East
10.5.7.1 Market Estimates & Forecast, 2019–2024
10.5.7.2 Market Estimates & Forecast, by Type, 2019–2024
10.5.7.3 Market Estimates & Forecast, by Mode of Application, 2019–2024
10.5.7.4 Market Estimates & Forecast, by Crop Type, 2019–2024
10.5.7.5 Market Estimates & Forecast, by Application, 2019–2024
10.5.8 Africa
10.5.8.1 Market Estimates & Forecast, 2019–2024
10.5.8.2 Market Estimates & Forecast, by Type, 2019–2024
10.5.8.3 Market Estimates & Forecast, by Mode of Application, 2019–2024
10.5.8.4 Market Estimates & Forecast, by Crop Type, 2019–2024
10.5.8.5 Market Estimates & Forecast, by Application, 2019–2024
11. Company Landscape
11.1 Introduction
11.2 Market Strategy
11.3 Key Development Analysis
(Expansions/Mergers & Acquisitions/Joint Ventures/New Product Developments/Agreements/Investments)
12. Company Profiles
12.1 Biobest
12.1.1 Company Overview
12.1.2 Financial Updates
12.1.3 Product/Business Segment Overview
12.1.4 Strategy
12.1.5 Key Developments
12.1.6 SWOT Analysis
12.2 ISAGRO
12.2.1 Company Overview
12.2.2 Financial Updates
12.2.3 Product/Business Segment Overview
12.2.4 Strategy
12.2.5 Key Developments
12.2.6 SWOT Analysis
12.3 BIOCONT LABORATORY
12.3.1 Company Overview
12.3.2 Financial Updates
12.3.3 Product/Business Segment Overview
12.3.4 Strategy
12.3.5 Key Developments
12.3.6 SWOT Analysis
12.4 Suterra
12.4.1 Company Overview
12.4.2 Financial Updates
12.4.3 Product/Business Segment Overview
12.4.4 Strategy
12.4.5 Key Developments
12.4.6 SWOT Analysis
12.5 Russell IPM
12.5.1 Company Overview
12.5.2 Financial Updates
12.5.3 Product/Business Segment Overview
12.5.4 Strategy
12.5.5 Key Developments
12.5.6 SWOT Analysis
12.6 ISCA Technologies
12.6.1 Company Overview
12.6.2 Financial Updates
12.6.3 Product/Business Segment Overview
12.6.4 Strategy
12.6.5 Key Developments
12.6.6 SWOT Analysis
12.7 Bedoukian Research
12.7.1 Company Overview
12.7.2 Financial Updates
12.7.3 Product/Business Segment Overview
12.7.4 Strategy
12.7.5 Key Developments
12.7.6 SWOT Analysis
12.8 Pherobank
12.8.1 Company Overview
12.8.2 Financial Updates
12.8.3 Product/Business Segment Overview
12.8.4 Strategy
12.8.5 Key Developments
12.8.6 SWOT Analysis
12.9 Troy Biosciences
12.9.1 Company Overview
12.9.2 Financial Updates
12.9.3 Product/Business Segment Overview
12.9.4 Strategy
12.9.5 Key Developments
12.9.6 SWOT Analysis
12.10 Exosect
12.10.1 Company Overview
12.10.2 Financial Updates
12.10.3 Product/Business Segment Overview
12.10.4 Strategy
12.10.5 Key Developments
12.10.6 SWOT Analysis
12.11 Pacific Biocontrol Corporation
12.11.1 Company Overview
12.11.2 Financial Updates
12.11.3 Product/Business Segment Overview
12.11.4 Strategy
12.11.5 Key Developments
12.11.6 SWOT Analysis
12.12 Laboratorio Agrochem, SL
12.12.1 Company Overview
12.12.2 Financial Updates
12.12.3 Product/Business Segment Overview
12.12.4 Strategy
12.12.5 Key Developments
12.12.6 SWOT Analysis
13. Conclusion
List of Tables
Table 1 Global Agricultural Insect Pheromones Market, by Region, 2019–2024 (USD Million)
Table 2 Global Agricultural Insect Pheromones Market, by Type, 2019–2024 (USD Million)
Table 3 Global Agricultural Insect Pheromones Market, by Crop Type,2019–2024 (USD Million)
Table 4 Global Agricultural Insect Pheromones Market, by Mode of Application, 2019–2024 (USD Million)
Table 5 Global Agricultural Insect Pheromones Market, by Application, 2019–2024 (USD Million)
Table 6 North America: Agricultural Insect Pheromones Market, by Country, 2019–2024 (USD Million)
Table 7 North America: Agricultural Insect Pheromones Market, by Type, 2019–2024 (USD Million)
Table 8 North America: Agricultural Insect Pheromones Market, by Crop Type,2019–2024 (USD Million)
Table 9 North America: Agricultural Insect Pheromones Market, by Mode of Application, 2019–2024 (USD Million)
Table 10 North America: Agricultural Insect Pheromones Market, by Application, 2019–2024 (USD Million)
Table 11 US: Agricultural Insect Pheromones Market, by Type, 2019–2024 (USD Million)
Table 12 US: Agricultural Insect Pheromones Market, by Crop Type,2019–2024 (USD Million)
Table 13 US: Agricultural Insect Pheromones Market, by Mode of Application, 2019–2024 (USD Million)
Table 14 US: Agricultural Insect Pheromones Market, by Application, 2019–2024 (USD Million)
Table 15 Canada: Agricultural Insect Pheromones Market, by Type, 2019–2024 (USD Million)
Table 16 Canada: Agricultural Insect Pheromones Market, by Crop Type,2019–2024 (USD Million)
Table 17 Canada: Agricultural Insect Pheromones Market, by Mode of Application, 2019–2024 (USD Million)
Table 18 Canada: Agricultural Insect Pheromones Market, by Application, 2019–2024 (USD Million)
Table 19 Mexico: Agricultural Insect Pheromones Market, by Type, 2019–2024 (USD Million)
Table 20 Mexico: Agricultural Insect Pheromones Market, by Crop Type,2019–2024 (USD Million)
Table 21 Mexico: Agricultural Insect Pheromones Market, by Mode of Application, 2019–2024 (USD Million)
Table 22 Mexico: Agricultural Insect Pheromones Market, by Application, 2019–2024 (USD Million)
Table 23 Europe: Agricultural Insect Pheromones Market, by Country, 2019–2024 (USD Million)
Table 24 Europe: Agricultural Insect Pheromones Market, by Type, 2019–2024 (USD Million)
Table 25 Europe: Agricultural Insect Pheromones Market, by Crop Type,2019–2024 (USD Million)
Table 26 Europe: Agricultural Insect Pheromones Market, by Mode of Application, 2019–2024 (USD Million)
Table 27 Europe: Agricultural Insect Pheromones Market, by Application, 2019–2024 (USD Million)
Table 28 Germany: Agricultural Insect Pheromones Market, by Type, 2019–2024 (USD Million)
Table 29 Germany: Agricultural Insect Pheromones Market, by Crop Type,2019–2024 (USD Million)
Table 30 Germany: Agricultural Insect Pheromones Market, by Mode of Application, 2019–2024 (USD Million)
Table 31 Germany: Agricultural Insect Pheromones Market, by Application, 2019–2024 (USD Million)
Table 32 France: Agricultural Insect Pheromones Market, by Type, 2019–2024 (USD Million)
Table 33 France: Agricultural Insect Pheromones Market, by Crop Type,2019–2024 (USD Million)
Table 34 France: Agricultural Insect Pheromones Market, by Mode of Application, 2019–2024 (USD Million)
Table 35 France: Agricultural Insect Pheromones Market, by Application, 2019–2024 (USD Million)
Table 36 Italy: Agricultural Insect Pheromones Market, by Type, 2019–2024 (USD Million)
Table 37 Italy: Agricultural Insect Pheromones Market, by Crop Type,2019–2024 (USD Million)
Table 38 Italy: Agricultural Insect Pheromones Market, by Mode of Application, 2019–2024 (USD Million)
Table 39 Italy: Agricultural Insect Pheromones Market, by Application, 2019–2024 (USD Million)
Table 40 Spain: Agricultural Insect Pheromones Market, by Type, 2019–2024 (USD Million)
Table 41 Spain: Agricultural Insect Pheromones Market, by Crop Type,2019–2024 (USD Million)
Table 42 Spain: Agricultural Insect Pheromones Market, by Mode of Application, 2019–2024 (USD Million)
Table 43 Spain: Agricultural Insect Pheromones Market, by Application, 2019–2024 (USD Million)
Table 44 UK: Agricultural Insect Pheromones Market, by Type, 2019–2024 (USD Million)
Table 45 UK: Agricultural Insect Pheromones Market, by Crop Type,2019–2024 (USD Million)
Table 46 UK: Agricultural Insect Pheromones Market, by Mode of Application, 2019–2024 (USD Million)
Table 47 UK: Agricultural Insect Pheromones Market, by Application, 2019–2024 (USD Million)
Table 48 Rest of Europe: Agricultural Insect Pheromones Market, by Type, 2019–2024 (USD Million)
Table 49 Rest of Europe: Agricultural Insect Pheromones Market, by Crop Type,2019–2024 (USD Million)
Table 50 Rest of Europe: Agricultural Insect Pheromones Market, by Mode of Application, 2019–2024 (USD Million)
Table 51 Rest of Europe: Agricultural Insect Pheromones Market, by Application, 2019–2024 (USD Million)
Table 52 Asia-Pacific: Agricultural Insect Pheromones Market, by Country, 2019–2024 (USD Million)
Table 53 Asia-Pacific: Agricultural Insect Pheromones Market, by Type, 2019–2024 (USD Million)
Table 54 Asia-Pacific: Agricultural Insect Pheromones Market, by Crop Type,2019–2024 (USD Million)
Table 55 Asia-Pacific: Agricultural Insect Pheromones Market, by Mode of Application, 2019–2024 (USD Million)
Table 56 Asia-Pacific: Agricultural Insect Pheromones Market, by Application, 2019–2024 (USD Million)
Table 57 China: Agricultural Insect Pheromones Market, by Type, 2019–2024 (USD Million)
Table 58 China: Agricultural Insect Pheromones Market, by Crop Type,2019–2024 (USD Million)
Table 59 China: Agricultural Insect Pheromones Market, by Mode of Application, 2019–2024 (USD Million)
Table 60 China: Agricultural Insect Pheromones Market, by Application, 2019–2024 (USD Million)
Table 61 India: Agricultural Insect Pheromones Market, by Type, 2019–2024 (USD Million)
Table 62 India: Agricultural Insect Pheromones Market, by Crop Type,2019–2024 (USD Million)
Table 63 India: Agricultural Insect Pheromones Market, by Mode of Application, 2019–2024 (USD Million)
Table 64 India: Agricultural Insect Pheromones Market, by Application, 2019–2024 (USD Million)
Table 65 Japan: Agricultural Insect Pheromones Market, by Type, 2019–2024 (USD Million)
Table 66 Japan: Agricultural Insect Pheromones Market, by Crop Type,2019–2024 (USD Million)
Table 67 Japan: Agricultural Insect Pheromones Market, by Mode of Application, 2019–2024 (USD Million)
Table 68 Japan: Agricultural Insect Pheromones Market, by Application, 2019–2024 (USD Million)
Table 69 Australia & New Zealand: Agricultural Insect Pheromones Market, by Type, 2019–2024 (USD Million)
Table 70 Australia & New Zealand: Agricultural Insect Pheromones Market, by Crop Type,2019–2024 (USD Million)
Table 71 Australia & New Zealand: Agricultural Insect Pheromones Market, by Mode of Application, 2019–2024 (USD Million)
Table 72 Australia & New Zealand: Agricultural Insect Pheromones Market, by Application, 2019–2024 (USD Million)
Table 73 Rest of Asia-Pacific: Agricultural Insect Pheromones Market, by Type, 2019–2024 (USD Million)
Table 74 Rest of Asia-Pacific: Agricultural Insect Pheromones Market, by Crop Type,2019–2024 (USD Million)
Table 75 Rest of Asia-Pacific: Agricultural Insect Pheromones Market, by Mode of Application, 2019–2024 (USD Million)
Table 76 Rest of Asia-Pacific: Agricultural Insect Pheromones Market, by Application, 2019–2024 (USD Million)
Table 77 Rest of the World (RoW): Agricultural Insect Pheromones Market, by Country, 2019–2024 (USD Million)
Table 78 Rest of the World (RoW): Agricultural Insect Pheromones Market, by Type, 2019–2024 (USD Million)
Table 79 Rest of the World (RoW): Agricultural Insect Pheromones Market, by Crop Type,2019–2024 (USD Million)
Table 80 Rest of the World (RoW): Agricultural Insect Pheromones Market, by Mode of Application, 2019–2024 (USD Million)
Table 81 Rest of the World (RoW): Agricultural Insect Pheromones Market, by Application, 2019–2024 (USD Million)
Table 82 South America: Agricultural Insect Pheromones Market, by Type, 2019–2024 (USD Million)
Table 83 South America: Agricultural Insect Pheromones Market, by Crop Type,2019–2024 (USD Million)
Table 84 South America: Agricultural Insect Pheromones Market, by Mode of Application, 2019–2024 (USD Million)
Table 85 South America: Agricultural Insect Pheromones Market, by Application, 2019–2024 (USD Million)
Table 86 Middle East: Agricultural Insect Pheromones Market, by Type, 2019–2024 (USD Million)
Table 87 Middle East: Agricultural Insect Pheromones Market, by Crop Type,2019–2024 (USD Million)
Table 88 Middle East: Agricultural Insect Pheromones Market, by Mode of Application, 2019–2024 (USD Million)
Table 89 Middle East: Agricultural Insect Pheromones Market, by Application, 2019–2024 (USD Million)
Table 90 Africa: Agricultural Insect Pheromones Market, by Type, 2019–2024 (USD Million)
Table 91 Africa: Agricultural Insect Pheromones Market, by Crop Type,2019–2024 (USD Million)
Table 92 Africa: Agricultural Insect Pheromones Market, by Mode of Application, 2019–2024 (USD Million)
Table 93 Africa: Agricultural Insect Pheromones Market, by Application, 2019–2024 (USD Million)
LIST OF FIGURES
FIGURE 1 Global Agricultural Insect Pheromones Market Segmentation
FIGURE 2 Forecast Research Methodology
FIGURE 3 Five Forces Analysis of the Global Agricultural Insect Pheromones Market
FIGURE 4 Value Chain of the Global Agricultural Insect Pheromones Market
FIGURE 5 Share of the Global Agricultural Insect Pheromones Market in 2018, by Country (%)
FIGURE 6 Global Agricultural Insect Pheromones Market, by Region, 2019–2024,
FIGURE 7 Global Agricultural Insect Pheromones Market Size, by Type, 2018
FIGURE 8 Share of the Global Agricultural Insect Pheromones Market, by Type, 2019–2024 (%)
FIGURE 9 Global Agricultural Insect Pheromones Market Size, by Crop Type, 2018
FIGURE 10 Share of the Global Agricultural Insect Pheromones Market, by Crop Type, 2019–2024 (%)
FIGURE 11 Global Agricultural Insect Pheromones Market Size, by Mode of Application, 2018
FIGURE 12 Share of the Global Agricultural Insect Pheromones Market, by Mode of Application, 2019–2024 (%)
FIGURE 13 Global Agricultural Insect Pheromones Market Size, by Application, 2018
FIGURE 14 Share of the Global Agricultural Insect Pheromones Market, by Application, 2019–2024 (%)