×
Hero Background
English
Chinese
French
Japanese
Korean
German
Spanish

Aerial Refueling Systems Market Share

ID: MRFR/AD/5658-HCR
128 Pages
Swapnil Palwe
October 2025

Aerial Refueling Systems Market Research Report Information by Type (Tanker Aircraft Systems Receiver Aircraft Systems), by Technology (Probe Drogue Systems, & Flying Boom Systems) by End-User (OEM Aftermarket), By Platform, by Region - Global Forecast till 2035

Share:
Download PDF ×

We do not share your information with anyone. However, we may send you emails based on your report interest from time to time. You may contact us at any time to opt-out.

Aerial Refueling Systems Market Infographic
Purchase Options

Market Share

Aerial Refueling Systems Market Share Analysis

The Aerial Refueling Systems Market, a vital segment within the aerospace and defense industry, employs various market share positioning strategies to establish prominence and meet the evolving needs of military and commercial aviation. Technological innovation is a central strategy, with manufacturers consistently investing in research and development to enhance the efficiency, safety, and versatility of aerial refueling systems. Advanced technologies such as automated boom control, hose and drogue systems, and real-time monitoring capabilities are integrated to improve the precision and speed of inflight refueling operations. By staying at the forefront of technological advancements, companies position themselves as leaders in providing cutting-edge aerial refueling solutions that address the increasing demands of air forces and commercial aviation operators.

Segmentation is another crucial strategy within the Aerial Refueling Systems Market, where manufacturers tailor their products to cater to specific aircraft types, sizes, and mission profiles. Different platforms, such as tanker aircraft or receiver aircraft, may require specialized refueling systems to meet their unique operational requirements. By customizing their aerial refueling solutions for specific aviation applications, manufacturers optimize their offerings for a range of scenarios, ensuring compatibility with diverse fleets and contributing to the overall flexibility of aerial refueling capabilities.

Collaboration and strategic partnerships play a significant role in market share positioning in the Aerial Refueling Systems Market. Given the complexity and interdependence of air operations, companies often collaborate with aerospace manufacturers, defense contractors, and air forces. These collaborations can lead to the development of integrated systems that seamlessly integrate aerial refueling capabilities with other airborne technologies or mission systems. By working closely with key stakeholders, manufacturers can enhance the interoperability and effectiveness of their aerial refueling solutions, contributing to comprehensive mission capabilities for military and commercial aviation.

Cost leadership is a prevalent strategy in the Aerial Refueling Systems Market, as defense and commercial aviation budgets often demand cost-effective solutions. Manufacturers focus on optimizing production processes, sourcing cost-effective materials, and achieving economies of scale to offer high-quality aerial refueling systems at competitive prices. This emphasis on cost-effectiveness not only makes their products attractive to aviation operators but also positions companies favorably in competitive bidding processes, enabling them to secure contracts for the deployment and upgrading of aerial refueling capabilities.

Geographical diversification is a strategic move employed by aerial refueling system manufacturers to expand their market presence. Establishing a global footprint allows companies to cater to the diverse needs of air forces and commercial aviation operators worldwide. Different regions may have unique geopolitical considerations, airspace regulations, and mission requirements, and by adapting their aerial refueling systems to these variations, manufacturers can better serve a broad customer base. Setting up regional offices, forming partnerships, and customizing solutions based on regional needs ensure that aerial refueling systems are well-suited for the complexities of air operations across different parts of the world.

Author
Swapnil Palwe
Team Lead - Research

With a technical background as Bachelor's in Mechanical Engineering, with MBA in Operations Management , Swapnil has 6+ years of experience in market research, consulting and analytics with the tasks of data mining, analysis, and project execution. He is the POC for our clients, for their consulting projects running under the Automotive/A&D domain. Swapnil has worked on major projects in verticals such as Aerospace & Defense, Automotive and many other domain projects. He has worked on projects for fortune 500 companies' syndicate and consulting projects along with several government projects.

Leave a Comment

FAQs

What is the projected market valuation of the Aerial Refueling Systems Market by 2035?

The projected market valuation for the Aerial Refueling Systems Market by 2035 is 2236.31 USD Million.

Market Summary

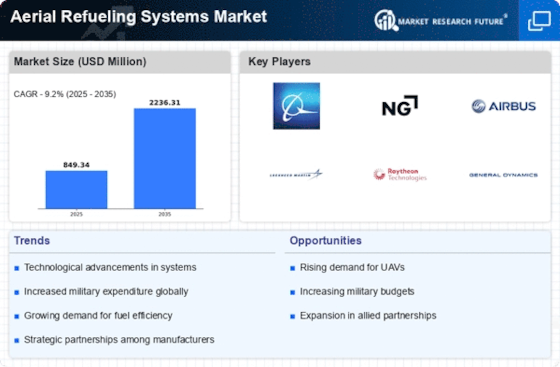
As per MRFR analysis, the Aerial Refueling Systems Market Size was estimated at 849.34 USD Million in 2024. The Aerial Refueling Systems industry is projected to grow from 927.48 USD Million in 2025 to 2236.31 USD Million by 2035, exhibiting a compound annual growth rate (CAGR) of 9.2 during the forecast period 2025 - 2035.

Key Market Trends & Highlights

The Aerial Refueling Systems Market is poised for growth driven by technological advancements and increasing defense budgets.

  • Technological advancements are enhancing the efficiency and capabilities of aerial refueling systems.
  • North America remains the largest market, while Asia-Pacific is emerging as the fastest-growing region in this sector.
  • Flying Boom Systems dominate the market, whereas Probe and Drogue Systems are witnessing rapid growth.
  • Increased defense budgets and rising military operations are key drivers propelling market expansion.

Market Size & Forecast

2024 Market Size 849.34 (USD Million)
2035 Market Size 2236.31 (USD Million)
CAGR (2025 - 2035) 9.2%
Largest Regional Market Share in 2024 North America

Major Players

<p>Boeing (US), Northrop Grumman (US), Airbus (FR), Lockheed Martin (US), Raytheon Technologies (US), General Dynamics (US), Hindustan Aeronautics Limited (IN), Thales Group (FR), Leonardo (IT)</p>

Market Trends

The Aerial Refueling Systems Market is currently experiencing a transformative phase, driven by advancements in technology and increasing demand for enhanced operational capabilities among military and commercial aviation sectors. The integration of unmanned aerial vehicles and advanced refueling techniques appears to be reshaping traditional paradigms, allowing for more efficient and flexible operations. Furthermore, geopolitical tensions and the necessity for sustained air power are likely propelling investments in aerial refueling capabilities, as nations seek to bolster their defense strategies. This evolving landscape suggests a growing recognition of the strategic importance of aerial refueling in modern warfare and humanitarian missions alike. In addition, the market seems to be influenced by the rising emphasis on interoperability among allied forces. Collaborative efforts among nations to standardize refueling systems may enhance operational effectiveness and reduce logistical challenges. As the Aerial Refueling Systems Market continues to evolve, stakeholders must remain vigilant to emerging technologies and shifting defense priorities that could redefine the competitive landscape. The future appears promising, with potential for innovation and growth as the demand for advanced aerial refueling solutions expands across various sectors.

Technological Advancements

Recent innovations in aerial refueling technology are likely enhancing the efficiency and effectiveness of operations. Developments in automation and drone integration may streamline processes, reducing the need for human intervention and increasing safety during refueling missions.

Geopolitical Influences

Ongoing geopolitical tensions seem to be driving nations to invest more heavily in aerial refueling capabilities. The need for sustained air operations in various regions may lead to increased procurement and development of advanced refueling systems.

Interoperability Initiatives

Collaborative efforts among allied nations to standardize aerial refueling systems appear to be gaining traction. Such initiatives may facilitate joint operations, improve logistical coordination, and enhance overall mission success in multinational engagements.

Aerial Refueling Systems Market Market Drivers

Increased Defense Budgets

The Aerial Refueling Systems Market is experiencing a notable surge in demand, primarily driven by increased defense budgets across various nations. Governments are allocating more resources to enhance their military capabilities, which includes the procurement of advanced aerial refueling systems. For instance, recent reports indicate that defense spending in several countries has risen by approximately 5 to 10% annually. This trend suggests a growing recognition of the strategic importance of aerial refueling in extending the operational range of military aircraft. As nations seek to modernize their fleets, the Aerial Refueling Systems Market is likely to benefit from this influx of funding, leading to innovations and upgrades in existing systems.

Technological Innovations

Technological innovations are a key driver in the Aerial Refueling Systems Market, as advancements in engineering and materials science lead to the development of more efficient and reliable systems. Innovations such as automated refueling processes and enhanced fuel transfer rates are becoming increasingly prevalent. The integration of advanced avionics and communication systems is also enhancing the operational capabilities of aerial refueling platforms. Market data suggests that the adoption of these technologies could increase the efficiency of aerial refueling operations by up to 30%. As military forces seek to leverage these advancements, the Aerial Refueling Systems Market is poised for growth, with manufacturers focusing on research and development to meet evolving demands.

Rising Military Operations

The Aerial Refueling Systems Market is significantly influenced by the rising frequency of military operations worldwide. As geopolitical tensions escalate, armed forces are increasingly engaged in various missions, necessitating the need for efficient aerial refueling capabilities. The demand for aerial refueling systems is projected to grow as military operations become more complex and require extended flight durations. Reports suggest that the number of military operations has increased by over 15% in recent years, highlighting the critical role of aerial refueling in ensuring mission success. This trend indicates a robust market potential for the Aerial Refueling Systems Market, as military forces prioritize the acquisition of advanced refueling technologies.

Growing Demand for Multi-Role Aircraft

The growing demand for multi-role aircraft is significantly impacting the Aerial Refueling Systems Market. As military forces increasingly adopt versatile platforms capable of performing various missions, the need for compatible aerial refueling systems becomes paramount. Multi-role aircraft require efficient refueling solutions to maximize their operational capabilities. Market analysis indicates that the demand for multi-role aircraft is expected to grow by approximately 20% over the next five years. This trend suggests a corresponding increase in the need for advanced aerial refueling systems that can support these versatile platforms. Consequently, the Aerial Refueling Systems Market is likely to experience substantial growth as manufacturers respond to this evolving demand.

Strategic Partnerships and Collaborations

Strategic partnerships and collaborations are emerging as a significant driver in the Aerial Refueling Systems Market. Companies are increasingly forming alliances to leverage each other's strengths, share resources, and enhance product offerings. These collaborations often lead to the development of innovative solutions that meet the specific needs of military clients. For example, partnerships between aerospace manufacturers and defense contractors can result in the creation of advanced refueling systems that incorporate cutting-edge technology. This trend not only fosters innovation but also accelerates the time-to-market for new products. As the Aerial Refueling Systems Market continues to evolve, such strategic alliances are likely to play a crucial role in shaping its future.

Market Segment Insights

By Technology: Flying Boom Systems (Largest) vs. Probe & Drogue Systems (Fastest-Growing)

<p>The Aerial Refueling Systems Market exhibits diverse technology segments, primarily dominated by Flying Boom Systems. This technology holds a significant portion of the market share, largely due to its extensive use in military applications. In contrast, Probe & Drogue Systems cater primarily to naval aviation and are gaining momentum, particularly among allied forces seeking versatile refueling solutions. This distinct distribution showcases the strategic positioning of these systems in the market landscape. Growth trends in this segment are strongly influenced by advancements in aerospace technology and increasing defense budgets across various nations. The shift toward multi-role aircraft capable of utilizing both systems is propelling the adoption of Probe & Drogue Systems. Moreover, the rising demand for efficient and rapid refueling capabilities is driving innovations in Flying Boom Systems, enhancing their operational effectiveness and market relevance.</p>

<p>Technology: Flying Boom Systems (Dominant) vs. Probe & Drogue Systems (Emerging)</p>

<p>Flying Boom Systems represent the dominant technology in the Aerial Refueling Systems Market, renowned for their efficiency and reliability in transferring fuel at high speeds. This system is widely utilized by military aircraft, enabling seamless refueling of fighter jets and bombers during missions, thereby extending operational range and effectiveness. As militaries seek to enhance their aerial capabilities, the demand for this technology continues to grow. On the other hand, Probe & Drogue Systems are emerging as adaptable and versatile solutions, especially favored by naval forces. Their ability to refuel a variety of aircraft types makes them increasingly appealing, particularly for joint operations among allied nations. While still gaining traction, their growth is supported by ongoing technological advancements and a focus on flexible refueling solutions.</p>

By Type: Receiver Aircraft Systems (Largest) vs. Tanker Aircraft Systems (Fastest-Growing)

<p>In the Aerial Refueling Systems Market, the distribution of market share reveals that Receiver Aircraft Systems hold the largest segment, reflecting their critical role in military and commercial operations requiring aerial support. Meanwhile, Tanker Aircraft Systems, while initially smaller in share, have shown a rapid increase in adoption, bolstered by advancements in technology and increasing demand for efficient refueling capabilities.</p>

<p>Receiver Aircraft Systems (Dominant) vs. Tanker Aircraft Systems (Emerging)</p>

<p>Receiver Aircraft Systems are characterized by their established presence in air force operations, being integral to various military missions, thereby securing a dominant market position. Their technology is well-refined, offering reliable performance in various environments. Conversely, Tanker Aircraft Systems are emerging rapidly, driven by innovations that enhance refueling speed and compatibility with next-generation aircraft. This segment is gaining attention due to an increasing focus on operational readiness and international partnerships, leading to a promising trajectory in future investments.</p>

By Platform: Fixed-Wing (Largest) vs. Rotary-Wing (Fastest-Growing)

<p>In the Aerial Refueling Systems Market, the market share distribution is significantly skewed toward Fixed-Wing platforms, which dominate both military and commercial applications. These systems are widely utilized in long-range missions where fuel efficiency and payload capacity are critical. On the other hand, Rotary-Wing platforms, while currently smaller in share, are gaining traction due to their versatility in various military operations and the increasing demand for rapid response capabilities. Growth trends in the Aerial Refueling Systems Market indicate that Rotary-Wing systems are positioned for swift expansion. The driver of this growth is primarily the increasing emphasis on multi-role operations within the defense sector, where rotary-wing aircraft can be deployed for more diverse missions. Additionally, technological advancements and the push for improved logistical support in aerial refueling operations are fostering significant innovations within this segment, increasing their appeal to military stakeholders.</p>

<p>Fixed-Wing (Dominant) vs. Rotary-Wing (Emerging)</p>

<p>Fixed-Wing aerial refueling systems are characterized by their ability to cover long distances efficiently, making them the preferred choice for traditional air forces around the globe. They typically offer larger fuel capacities and are vital in strategic airlift operations. In contrast, Rotary-Wing systems are emerging as important components in dynamic warfare settings due to their agility and ability to operate in confined spaces. They cater to special operations forces and require a different refueling approach, which is rapidly evolving with technological advancements. This transformation is leading to innovations tailored for rotary-wing operations, making them increasingly competitive and integral to modern aerial refueling strategies.</p>

By End-user: Aftermarket (Largest) vs. OEM (Fastest-Growing)

<p>The Aerial Refueling Systems Market showcases distinct distribution within its end-user segments. The Aftermarket segment holds a dominant position in this market, accounting for a significant portion of the overall share due to the necessity of maintenance, repairs, and upgrades of existing systems. In contrast, the Original Equipment Manufacturer (OEM) segment is rapidly gaining traction, fueled by the increasing demand for new aircraft and advanced refueling technologies.</p>

<p>Aftermarket (Dominant) vs. OEM (Emerging)</p>

<p>The Aftermarket segment is characterized by its stable demand as military and commercial fleets require ongoing support and upgrades, ensuring that this segment remains a cornerstone of the aerial refueling landscape. However, the OEM segment represents an emerging opportunity, driven by innovations in technology and the need for next-generation aerial refueling solutions. As nations invest in modern fleet capabilities, the OEM segment experiences accelerated growth, attracting investments and partnerships to develop more efficient systems. While the Aftermarket segment ensures reliability and longevity of existing systems, the OEM sector focuses on fulfilling the needs of an evolving market, positioning itself as a key player in future developments.</p>

Get more detailed insights about Aerial Refueling Systems Market Research Report – Global Forecast till 2035

Regional Insights

North America : Defense Innovation Leader

North America is the largest market for aerial refueling systems, holding approximately 60% of the global market share. The region's growth is driven by increasing defense budgets, technological advancements, and a focus on enhancing military capabilities. Regulatory support from the U.S. Department of Defense and NATO initiatives further catalyze demand for advanced refueling systems, ensuring operational readiness and strategic advantage. The United States is the leading country in this sector, with major players like Boeing, Northrop Grumman, and Lockheed Martin dominating the landscape. These companies are at the forefront of innovation, developing next-generation refueling technologies. The competitive environment is characterized by significant investments in R&D and collaborations with government agencies, ensuring that North America remains a pivotal player in The Aerial Refueling Systems Market.

Europe : Emerging Defense Collaborations

Europe is witnessing a significant increase in demand for aerial refueling systems, accounting for approximately 25% of the global market share. This growth is fueled by collaborative defense initiatives among EU nations, rising geopolitical tensions, and a commitment to modernizing military fleets. Regulatory frameworks from the European Defence Agency promote joint procurement and interoperability, enhancing the region's capabilities in aerial refueling. Key players in Europe include Airbus, Thales Group, and Leonardo, which are actively involved in developing advanced refueling technologies. Countries like France and Germany are leading the charge, investing heavily in defense modernization programs. The competitive landscape is marked by partnerships and joint ventures aimed at enhancing operational efficiency and technological advancements in aerial refueling systems.

Asia-Pacific : Rapid Military Modernization

Asia-Pacific is rapidly emerging as a significant market for aerial refueling systems, holding about 10% of the global market share. The region's growth is driven by increasing military expenditures, modernization of air forces, and strategic partnerships among nations. Countries like India and Japan are enhancing their aerial capabilities, supported by government initiatives and defense reforms that prioritize advanced refueling technologies. India, with Hindustan Aeronautics Limited, is a key player in this market, focusing on indigenous development of refueling systems. Japan and South Korea are also investing in advanced technologies to bolster their defense capabilities. The competitive landscape is evolving, with a mix of domestic and international players vying for market share, driven by the need for enhanced operational readiness and strategic deterrence.

Middle East and Africa : Strategic Defense Investments

The Middle East and Africa region is increasingly recognizing the importance of aerial refueling systems, accounting for approximately 5% of the global market share. The growth is driven by rising defense budgets, regional conflicts, and a focus on enhancing military capabilities. Governments are investing in modernizing their air forces, with aerial refueling systems being a critical component of operational effectiveness and strategic reach. Countries like Saudi Arabia and the UAE are leading the charge, with significant investments in defense procurement. The competitive landscape features both local and international players, with partnerships being formed to enhance technological capabilities. The region's focus on defense modernization is expected to drive further growth in the aerial refueling market, ensuring that military forces are equipped for contemporary challenges.

Key Companies in the Aerial Refueling Systems Market market include

Industry Developments

Cobham Plc.:

January 2024: Announced the completion of a major upgrade to the RAF's Voyager tanker fleet, equipping them with Cobham's advanced refueling pods.

Eaton Corporation:

November 2023: Successfully demonstrated its next-generation FADEC (Full Authority Digital Engine Control) system on a KC-46 Pegasus tanker aircraft, enhancing fuel efficiency and performance.

Marshall Aerospace and Defense Group:

February 2024: Announced the signing of a contract with the Canadian Armed Forces to provide ongoing maintenance and support for its CC-150 Polaris multi-role tanker aircraft.

Future Outlook

Aerial Refueling Systems Market Future Outlook

<p>The Aerial Refueling Systems Market is projected to grow at a 9.2% CAGR from 2024 to 2035, driven by technological advancements, increasing defense budgets, and rising demand for military readiness.</p>

New opportunities lie in:

  • <p>Development of autonomous refueling drones for enhanced operational efficiency.</p>
  • <p>Integration of advanced materials for lightweight refueling systems.</p>
  • <p>Expansion into emerging markets with tailored refueling solutions.</p>

<p>By 2035, the Aerial Refueling Systems Market is expected to be robust, reflecting substantial growth and innovation.</p>

Market Segmentation

Aerial Refueling Systems Market Type Outlook

  • Receiver Aircraft Systems
  • Tanker Aircraft Systems

Aerial Refueling Systems Market End-user Outlook

  • Aftermarket
  • OEM

Aerial Refueling Systems Market Platform Outlook

  • Rotary-Wing
  • Fixed-Wing

Aerial Refueling Systems Market Technology Outlook

  • Flying Boom Systems
  • Probe & Drogue Systems

Report Scope

MARKET SIZE 2024849.34(USD Million)
MARKET SIZE 2025927.48(USD Million)
MARKET SIZE 20352236.31(USD Million)
COMPOUND ANNUAL GROWTH RATE (CAGR)9.2% (2024 - 2035)
REPORT COVERAGERevenue Forecast, Competitive Landscape, Growth Factors, and Trends
BASE YEAR2024
Market Forecast Period2025 - 2035
Historical Data2019 - 2024
Market Forecast UnitsUSD Million
Key Companies ProfiledMarket analysis in progress
Segments CoveredMarket segmentation analysis in progress
Key Market OpportunitiesIntegration of advanced automation technologies enhances efficiency in the Aerial Refueling Systems Market.
Key Market DynamicsTechnological advancements and regulatory changes drive innovation and competition in the aerial refueling systems market.
Countries CoveredNorth America, Europe, APAC, South America, MEA

FAQs

What is the projected market valuation of the Aerial Refueling Systems Market by 2035?

The projected market valuation for the Aerial Refueling Systems Market by 2035 is 2236.31 USD Million.

  1. SECTION I: EXECUTIVE SUMMARY AND KEY HIGHLIGHTS
    1. EXECUTIVE SUMMARY
      1. Market Overview
      2. Key Findings
      3. Market Segmentation
      4. Competitive Landscape
      5. Challenges and Opportunities
      6. Future Outlook
  2. SECTION II: SCOPING, METHODOLOGY AND MARKET STRUCTURE
    1. MARKET INTRODUCTION
      1. Definition
      2. Scope of the study
    2. RESEARCH METHODOLOGY
      1. Overview
      2. Data Mining
      3. Secondary Research
      4. Primary Research
      5. Forecasting Model
      6. Market Size Estimation
      7. Data Triangulation
      8. Validation
  3. SECTION III: QUALITATIVE ANALYSIS
    1. MARKET DYNAMICS
      1. Overview
      2. Drivers
      3. Restraints
      4. Opportunities
    2. MARKET FACTOR ANALYSIS
      1. Value chain Analysis
      2. Porter's Five Forces Analysis
      3. COVID-19 Impact Analysis
  4. SECTION IV: QUANTITATIVE ANALYSIS
    1. Aerospace & Defense, BY Technology (USD Million)
      1. Flying Boom Systems
      2. Probe & Drogue Systems
    2. Aerospace & Defense, BY Type (USD Million)
      1. Receiver Aircraft Systems
      2. Tanker Aircraft Systems
    3. Aerospace & Defense, BY Platform (USD Million)
      1. Rotary-Wing
      2. Fixed-Wing
    4. Aerospace & Defense, BY End-user (USD Million)
      1. Aftermarket
      2. OEM
    5. Aerospace & Defense, BY Region (USD Million)
      1. North America
      2. Europe
      3. APAC
      4. South America
      5. MEA
  5. SECTION V: COMPETITIVE ANALYSIS
    1. Competitive Landscape
      1. Overview
      2. Competitive Analysis
      3. Market share Analysis
      4. Major Growth Strategy in the Aerospace & Defense
      5. Competitive Benchmarking
      6. Leading Players in Terms of Number of Developments in the Aerospace & Defense
      7. Key developments and growth strategies
      8. Major Players Financial Matrix
    2. Company Profiles
      1. Boeing (US)
      2. Northrop Grumman (US)
      3. Airbus (FR)
      4. Lockheed Martin (US)
      5. Raytheon Technologies (US)
      6. General Dynamics (US)
      7. Hindustan Aeronautics Limited (IN)
      8. Thales Group (FR)
      9. Leonardo (IT)
    3. Appendix
      1. References
      2. Related Reports
  6. LIST OF FIGURES
    1. MARKET SYNOPSIS
    2. NORTH AMERICA MARKET ANALYSIS
    3. US MARKET ANALYSIS BY TECHNOLOGY
    4. US MARKET ANALYSIS BY TYPE
    5. US MARKET ANALYSIS BY PLATFORM
    6. US MARKET ANALYSIS BY END-USER
    7. CANADA MARKET ANALYSIS BY TECHNOLOGY
    8. CANADA MARKET ANALYSIS BY TYPE
    9. CANADA MARKET ANALYSIS BY PLATFORM
    10. CANADA MARKET ANALYSIS BY END-USER
    11. EUROPE MARKET ANALYSIS
    12. GERMANY MARKET ANALYSIS BY TECHNOLOGY
    13. GERMANY MARKET ANALYSIS BY TYPE
    14. GERMANY MARKET ANALYSIS BY PLATFORM
    15. GERMANY MARKET ANALYSIS BY END-USER
    16. UK MARKET ANALYSIS BY TECHNOLOGY
    17. UK MARKET ANALYSIS BY TYPE
    18. UK MARKET ANALYSIS BY PLATFORM
    19. UK MARKET ANALYSIS BY END-USER
    20. FRANCE MARKET ANALYSIS BY TECHNOLOGY
    21. FRANCE MARKET ANALYSIS BY TYPE
    22. FRANCE MARKET ANALYSIS BY PLATFORM
    23. FRANCE MARKET ANALYSIS BY END-USER
    24. RUSSIA MARKET ANALYSIS BY TECHNOLOGY
    25. RUSSIA MARKET ANALYSIS BY TYPE
    26. RUSSIA MARKET ANALYSIS BY PLATFORM
    27. RUSSIA MARKET ANALYSIS BY END-USER
    28. ITALY MARKET ANALYSIS BY TECHNOLOGY
    29. ITALY MARKET ANALYSIS BY TYPE
    30. ITALY MARKET ANALYSIS BY PLATFORM
    31. ITALY MARKET ANALYSIS BY END-USER
    32. SPAIN MARKET ANALYSIS BY TECHNOLOGY
    33. SPAIN MARKET ANALYSIS BY TYPE
    34. SPAIN MARKET ANALYSIS BY PLATFORM
    35. SPAIN MARKET ANALYSIS BY END-USER
    36. REST OF EUROPE MARKET ANALYSIS BY TECHNOLOGY
    37. REST OF EUROPE MARKET ANALYSIS BY TYPE
    38. REST OF EUROPE MARKET ANALYSIS BY PLATFORM
    39. REST OF EUROPE MARKET ANALYSIS BY END-USER
    40. APAC MARKET ANALYSIS
    41. CHINA MARKET ANALYSIS BY TECHNOLOGY
    42. CHINA MARKET ANALYSIS BY TYPE
    43. CHINA MARKET ANALYSIS BY PLATFORM
    44. CHINA MARKET ANALYSIS BY END-USER
    45. INDIA MARKET ANALYSIS BY TECHNOLOGY
    46. INDIA MARKET ANALYSIS BY TYPE
    47. INDIA MARKET ANALYSIS BY PLATFORM
    48. INDIA MARKET ANALYSIS BY END-USER
    49. JAPAN MARKET ANALYSIS BY TECHNOLOGY
    50. JAPAN MARKET ANALYSIS BY TYPE
    51. JAPAN MARKET ANALYSIS BY PLATFORM
    52. JAPAN MARKET ANALYSIS BY END-USER
    53. SOUTH KOREA MARKET ANALYSIS BY TECHNOLOGY
    54. SOUTH KOREA MARKET ANALYSIS BY TYPE
    55. SOUTH KOREA MARKET ANALYSIS BY PLATFORM
    56. SOUTH KOREA MARKET ANALYSIS BY END-USER
    57. MALAYSIA MARKET ANALYSIS BY TECHNOLOGY
    58. MALAYSIA MARKET ANALYSIS BY TYPE
    59. MALAYSIA MARKET ANALYSIS BY PLATFORM
    60. MALAYSIA MARKET ANALYSIS BY END-USER
    61. THAILAND MARKET ANALYSIS BY TECHNOLOGY
    62. THAILAND MARKET ANALYSIS BY TYPE
    63. THAILAND MARKET ANALYSIS BY PLATFORM
    64. THAILAND MARKET ANALYSIS BY END-USER
    65. INDONESIA MARKET ANALYSIS BY TECHNOLOGY
    66. INDONESIA MARKET ANALYSIS BY TYPE
    67. INDONESIA MARKET ANALYSIS BY PLATFORM
    68. INDONESIA MARKET ANALYSIS BY END-USER
    69. REST OF APAC MARKET ANALYSIS BY TECHNOLOGY
    70. REST OF APAC MARKET ANALYSIS BY TYPE
    71. REST OF APAC MARKET ANALYSIS BY PLATFORM
    72. REST OF APAC MARKET ANALYSIS BY END-USER
    73. SOUTH AMERICA MARKET ANALYSIS
    74. BRAZIL MARKET ANALYSIS BY TECHNOLOGY
    75. BRAZIL MARKET ANALYSIS BY TYPE
    76. BRAZIL MARKET ANALYSIS BY PLATFORM
    77. BRAZIL MARKET ANALYSIS BY END-USER
    78. MEXICO MARKET ANALYSIS BY TECHNOLOGY
    79. MEXICO MARKET ANALYSIS BY TYPE
    80. MEXICO MARKET ANALYSIS BY PLATFORM
    81. MEXICO MARKET ANALYSIS BY END-USER
    82. ARGENTINA MARKET ANALYSIS BY TECHNOLOGY
    83. ARGENTINA MARKET ANALYSIS BY TYPE
    84. ARGENTINA MARKET ANALYSIS BY PLATFORM
    85. ARGENTINA MARKET ANALYSIS BY END-USER
    86. REST OF SOUTH AMERICA MARKET ANALYSIS BY TECHNOLOGY
    87. REST OF SOUTH AMERICA MARKET ANALYSIS BY TYPE
    88. REST OF SOUTH AMERICA MARKET ANALYSIS BY PLATFORM
    89. REST OF SOUTH AMERICA MARKET ANALYSIS BY END-USER
    90. MEA MARKET ANALYSIS
    91. GCC COUNTRIES MARKET ANALYSIS BY TECHNOLOGY
    92. GCC COUNTRIES MARKET ANALYSIS BY TYPE
    93. GCC COUNTRIES MARKET ANALYSIS BY PLATFORM
    94. GCC COUNTRIES MARKET ANALYSIS BY END-USER
    95. SOUTH AFRICA MARKET ANALYSIS BY TECHNOLOGY
    96. SOUTH AFRICA MARKET ANALYSIS BY TYPE
    97. SOUTH AFRICA MARKET ANALYSIS BY PLATFORM
    98. SOUTH AFRICA MARKET ANALYSIS BY END-USER
    99. REST OF MEA MARKET ANALYSIS BY TECHNOLOGY
    100. REST OF MEA MARKET ANALYSIS BY TYPE
    101. REST OF MEA MARKET ANALYSIS BY PLATFORM
    102. REST OF MEA MARKET ANALYSIS BY END-USER
    103. KEY BUYING CRITERIA OF AEROSPACE & DEFENSE
    104. RESEARCH PROCESS OF MRFR
    105. DRO ANALYSIS OF AEROSPACE & DEFENSE
    106. DRIVERS IMPACT ANALYSIS: AEROSPACE & DEFENSE
    107. RESTRAINTS IMPACT ANALYSIS: AEROSPACE & DEFENSE
    108. SUPPLY / VALUE CHAIN: AEROSPACE & DEFENSE
    109. AEROSPACE & DEFENSE, BY TECHNOLOGY, 2024 (% SHARE)
    110. AEROSPACE & DEFENSE, BY TECHNOLOGY, 2024 TO 2035 (USD Million)
    111. AEROSPACE & DEFENSE, BY TYPE, 2024 (% SHARE)
    112. AEROSPACE & DEFENSE, BY TYPE, 2024 TO 2035 (USD Million)
    113. AEROSPACE & DEFENSE, BY PLATFORM, 2024 (% SHARE)
    114. AEROSPACE & DEFENSE, BY PLATFORM, 2024 TO 2035 (USD Million)
    115. AEROSPACE & DEFENSE, BY END-USER, 2024 (% SHARE)
    116. AEROSPACE & DEFENSE, BY END-USER, 2024 TO 2035 (USD Million)
    117. BENCHMARKING OF MAJOR COMPETITORS
  7. LIST OF TABLES
    1. LIST OF ASSUMPTIONS
    2. North America MARKET SIZE ESTIMATES; FORECAST
      1. BY TECHNOLOGY, 2025-2035 (USD Million)
      2. BY TYPE, 2025-2035 (USD Million)
      3. BY PLATFORM, 2025-2035 (USD Million)
      4. BY END-USER, 2025-2035 (USD Million)
    3. US MARKET SIZE ESTIMATES; FORECAST
      1. BY TECHNOLOGY, 2025-2035 (USD Million)
      2. BY TYPE, 2025-2035 (USD Million)
      3. BY PLATFORM, 2025-2035 (USD Million)
      4. BY END-USER, 2025-2035 (USD Million)
    4. Canada MARKET SIZE ESTIMATES; FORECAST
      1. BY TECHNOLOGY, 2025-2035 (USD Million)
      2. BY TYPE, 2025-2035 (USD Million)
      3. BY PLATFORM, 2025-2035 (USD Million)
      4. BY END-USER, 2025-2035 (USD Million)
    5. Europe MARKET SIZE ESTIMATES; FORECAST
      1. BY TECHNOLOGY, 2025-2035 (USD Million)
      2. BY TYPE, 2025-2035 (USD Million)
      3. BY PLATFORM, 2025-2035 (USD Million)
      4. BY END-USER, 2025-2035 (USD Million)
    6. Germany MARKET SIZE ESTIMATES; FORECAST
      1. BY TECHNOLOGY, 2025-2035 (USD Million)
      2. BY TYPE, 2025-2035 (USD Million)
      3. BY PLATFORM, 2025-2035 (USD Million)
      4. BY END-USER, 2025-2035 (USD Million)
    7. UK MARKET SIZE ESTIMATES; FORECAST
      1. BY TECHNOLOGY, 2025-2035 (USD Million)
      2. BY TYPE, 2025-2035 (USD Million)
      3. BY PLATFORM, 2025-2035 (USD Million)
      4. BY END-USER, 2025-2035 (USD Million)
    8. France MARKET SIZE ESTIMATES; FORECAST
      1. BY TECHNOLOGY, 2025-2035 (USD Million)
      2. BY TYPE, 2025-2035 (USD Million)
      3. BY PLATFORM, 2025-2035 (USD Million)
      4. BY END-USER, 2025-2035 (USD Million)
    9. Russia MARKET SIZE ESTIMATES; FORECAST
      1. BY TECHNOLOGY, 2025-2035 (USD Million)
      2. BY TYPE, 2025-2035 (USD Million)
      3. BY PLATFORM, 2025-2035 (USD Million)
      4. BY END-USER, 2025-2035 (USD Million)
    10. Italy MARKET SIZE ESTIMATES; FORECAST
      1. BY TECHNOLOGY, 2025-2035 (USD Million)
      2. BY TYPE, 2025-2035 (USD Million)
      3. BY PLATFORM, 2025-2035 (USD Million)
      4. BY END-USER, 2025-2035 (USD Million)
    11. Spain MARKET SIZE ESTIMATES; FORECAST
      1. BY TECHNOLOGY, 2025-2035 (USD Million)
      2. BY TYPE, 2025-2035 (USD Million)
      3. BY PLATFORM, 2025-2035 (USD Million)
      4. BY END-USER, 2025-2035 (USD Million)
    12. Rest of Europe MARKET SIZE ESTIMATES; FORECAST
      1. BY TECHNOLOGY, 2025-2035 (USD Million)
      2. BY TYPE, 2025-2035 (USD Million)
      3. BY PLATFORM, 2025-2035 (USD Million)
      4. BY END-USER, 2025-2035 (USD Million)
    13. APAC MARKET SIZE ESTIMATES; FORECAST
      1. BY TECHNOLOGY, 2025-2035 (USD Million)
      2. BY TYPE, 2025-2035 (USD Million)
      3. BY PLATFORM, 2025-2035 (USD Million)
      4. BY END-USER, 2025-2035 (USD Million)
    14. China MARKET SIZE ESTIMATES; FORECAST
      1. BY TECHNOLOGY, 2025-2035 (USD Million)
      2. BY TYPE, 2025-2035 (USD Million)
      3. BY PLATFORM, 2025-2035 (USD Million)
      4. BY END-USER, 2025-2035 (USD Million)
    15. India MARKET SIZE ESTIMATES; FORECAST
      1. BY TECHNOLOGY, 2025-2035 (USD Million)
      2. BY TYPE, 2025-2035 (USD Million)
      3. BY PLATFORM, 2025-2035 (USD Million)
      4. BY END-USER, 2025-2035 (USD Million)
    16. Japan MARKET SIZE ESTIMATES; FORECAST
      1. BY TECHNOLOGY, 2025-2035 (USD Million)
      2. BY TYPE, 2025-2035 (USD Million)
      3. BY PLATFORM, 2025-2035 (USD Million)
      4. BY END-USER, 2025-2035 (USD Million)
    17. South Korea MARKET SIZE ESTIMATES; FORECAST
      1. BY TECHNOLOGY, 2025-2035 (USD Million)
      2. BY TYPE, 2025-2035 (USD Million)
      3. BY PLATFORM, 2025-2035 (USD Million)
      4. BY END-USER, 2025-2035 (USD Million)
    18. Malaysia MARKET SIZE ESTIMATES; FORECAST
      1. BY TECHNOLOGY, 2025-2035 (USD Million)
      2. BY TYPE, 2025-2035 (USD Million)
      3. BY PLATFORM, 2025-2035 (USD Million)
      4. BY END-USER, 2025-2035 (USD Million)
    19. Thailand MARKET SIZE ESTIMATES; FORECAST
      1. BY TECHNOLOGY, 2025-2035 (USD Million)
      2. BY TYPE, 2025-2035 (USD Million)
      3. BY PLATFORM, 2025-2035 (USD Million)
      4. BY END-USER, 2025-2035 (USD Million)
    20. Indonesia MARKET SIZE ESTIMATES; FORECAST
      1. BY TECHNOLOGY, 2025-2035 (USD Million)
      2. BY TYPE, 2025-2035 (USD Million)
      3. BY PLATFORM, 2025-2035 (USD Million)
      4. BY END-USER, 2025-2035 (USD Million)
    21. Rest of APAC MARKET SIZE ESTIMATES; FORECAST
      1. BY TECHNOLOGY, 2025-2035 (USD Million)
      2. BY TYPE, 2025-2035 (USD Million)
      3. BY PLATFORM, 2025-2035 (USD Million)
      4. BY END-USER, 2025-2035 (USD Million)
    22. South America MARKET SIZE ESTIMATES; FORECAST
      1. BY TECHNOLOGY, 2025-2035 (USD Million)
      2. BY TYPE, 2025-2035 (USD Million)
      3. BY PLATFORM, 2025-2035 (USD Million)
      4. BY END-USER, 2025-2035 (USD Million)
    23. Brazil MARKET SIZE ESTIMATES; FORECAST
      1. BY TECHNOLOGY, 2025-2035 (USD Million)
      2. BY TYPE, 2025-2035 (USD Million)
      3. BY PLATFORM, 2025-2035 (USD Million)
      4. BY END-USER, 2025-2035 (USD Million)
    24. Mexico MARKET SIZE ESTIMATES; FORECAST
      1. BY TECHNOLOGY, 2025-2035 (USD Million)
      2. BY TYPE, 2025-2035 (USD Million)
      3. BY PLATFORM, 2025-2035 (USD Million)
      4. BY END-USER, 2025-2035 (USD Million)
    25. Argentina MARKET SIZE ESTIMATES; FORECAST
      1. BY TECHNOLOGY, 2025-2035 (USD Million)
      2. BY TYPE, 2025-2035 (USD Million)
      3. BY PLATFORM, 2025-2035 (USD Million)
      4. BY END-USER, 2025-2035 (USD Million)
    26. Rest of South America MARKET SIZE ESTIMATES; FORECAST
      1. BY TECHNOLOGY, 2025-2035 (USD Million)
      2. BY TYPE, 2025-2035 (USD Million)
      3. BY PLATFORM, 2025-2035 (USD Million)
      4. BY END-USER, 2025-2035 (USD Million)
    27. MEA MARKET SIZE ESTIMATES; FORECAST
      1. BY TECHNOLOGY, 2025-2035 (USD Million)
      2. BY TYPE, 2025-2035 (USD Million)
      3. BY PLATFORM, 2025-2035 (USD Million)
      4. BY END-USER, 2025-2035 (USD Million)
    28. GCC Countries MARKET SIZE ESTIMATES; FORECAST
      1. BY TECHNOLOGY, 2025-2035 (USD Million)
      2. BY TYPE, 2025-2035 (USD Million)
      3. BY PLATFORM, 2025-2035 (USD Million)
      4. BY END-USER, 2025-2035 (USD Million)
    29. South Africa MARKET SIZE ESTIMATES; FORECAST
      1. BY TECHNOLOGY, 2025-2035 (USD Million)
      2. BY TYPE, 2025-2035 (USD Million)
      3. BY PLATFORM, 2025-2035 (USD Million)
      4. BY END-USER, 2025-2035 (USD Million)
    30. Rest of MEA MARKET SIZE ESTIMATES; FORECAST
      1. BY TECHNOLOGY, 2025-2035 (USD Million)
      2. BY TYPE, 2025-2035 (USD Million)
      3. BY PLATFORM, 2025-2035 (USD Million)
      4. BY END-USER, 2025-2035 (USD Million)
    31. PRODUCT LAUNCH/PRODUCT DEVELOPMENT/APPROVAL
    32. ACQUISITION/PARTNERSHIP

Aerial Refueling Systems Market Segmentation

Market Segmentation Overview

  • Detailed segmentation data will be available in the full report
  • Comprehensive analysis by multiple parameters
  • Regional and country-level breakdowns
  • Market size forecasts by segment
Infographic

Free Sample Request

Kindly complete the form below to receive a free sample of this Report

Get Free Sample

Customer Strories

“I am very pleased with how market segments have been defined in a relevant way for my purposes (such as "Portable Freezers & refrigerators" and "last-mile"). In general the report is well structured. Thanks very much for your efforts.”

Victoria Milne

Founder

Compare Licence

×
Features License Type
Single User Multiuser License Enterprise User
Price $4,950 $5,950 $7,250
Maximum User Access Limit 1 User Upto 10 Users Unrestricted Access Throughout the Organization
Free Customization
Direct Access to Analyst
Deliverable Format
Platform Access
Discount on Next Purchase 10% 15% 15%
Printable Versions