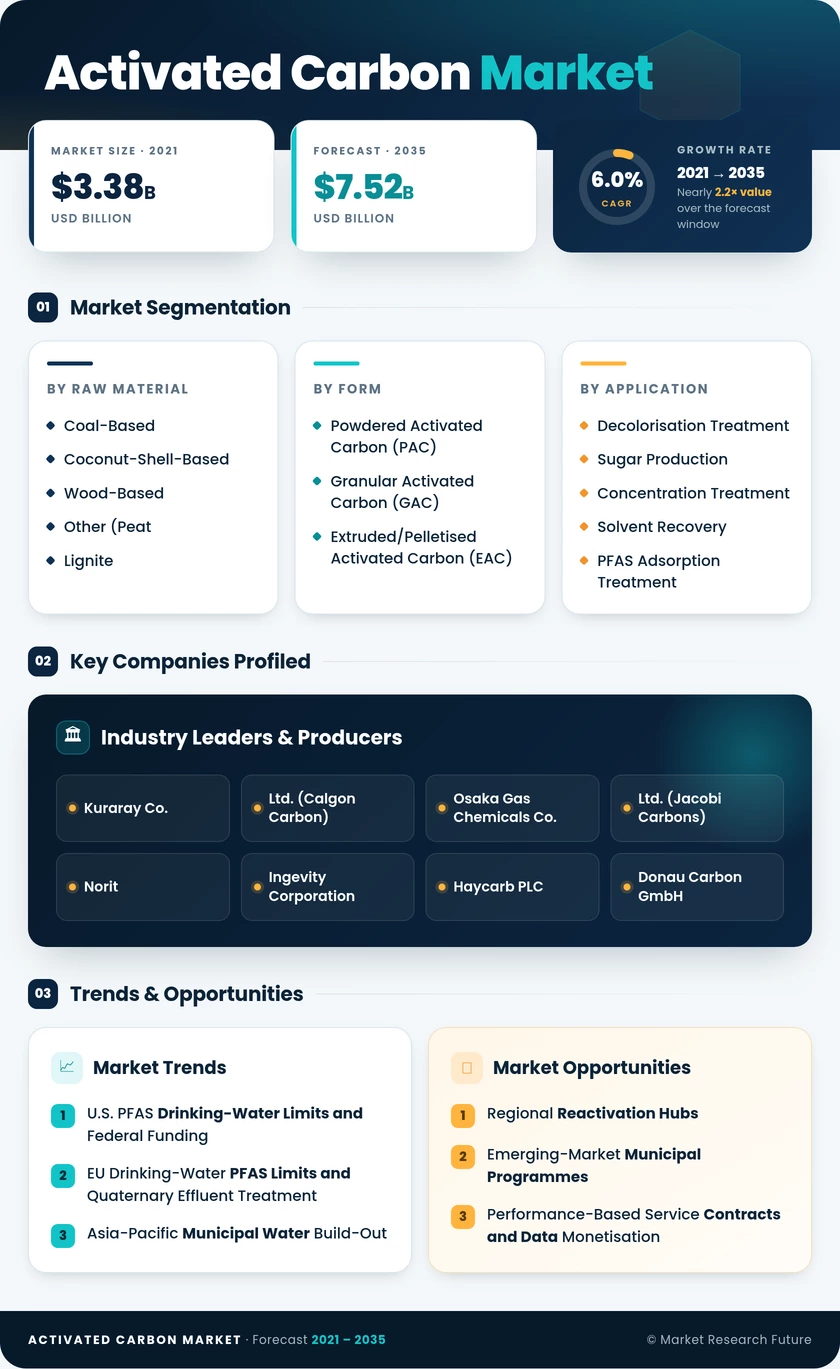
Activated Carbon Market (2026 - 2035)

ID: MRFR/CnM/1212-CR 200 Pages Chitranshi Jaiswal Last Updated: November 12, 2026
Activated Carbon Market Research Report Information By Raw Material (Coal-Based, Coconut-Shell-Based, Wood-Based, and Other Raw Materials (Peat, Lignite, etc.)), By Form (Powdered Activated Carbon (PAC), Granular Activated Carbon (GAC), and Extruded/Pelletised Activated Carbon (EAC)), By Application (Decolorisation Treatment, Sugar Production, Concentration Treatment, Solvent Recovery, PFAS Adsorption Treatment, Drinking Water Treatment, and Other Applications), By End-User Industry (Water Treatment, Industrial Processing, Healthcare, Food and Beverage, Automotive, and Other End-User Industries), And By Region (North America, Europe, Asia-Pacific, and Rest of the World) – Market Forecast Till 2035.
Activated Carbon Market
Market Size
Forecast Period2026-2035
CAGR (2026-2035)6.0%
2025 Market SizeUSD 4.21 Billion
2035 Market SizeUSD 7.52 Billion
Key Players
Kuraray Co.
Ltd.
Osaka Gas Chemicals Co.
Ltd.
Norit
Ingevity Corporation
Opportunities
  • Regional Reactivation Hubs
  • Emerging-Market Municipal Programmes
  • Performance-Based Service Contracts and Data Monetisation
  1. 1 Market Summary | |
  2. 2 Key Report Takeaways | |
    1. 2.1 By Raw Material | |
    2. 2.2 By Form | |
    3. 2.3 By Application | |
    4. 2.4 By End-user Industry | |
    5. 2.5 By Region | |
  3. 3 Market Size and Forecast (2021–2035) | |
  4. 4 Driver Impact Analysis | |
    1. 4.1 U.S. PFAS Drinking-Water Limits and Federal Funding | |
    2. 4.2 EU Drinking-Water PFAS Limits and Quaternary Effluent Treatment | |
    3. 4.3 Asia-Pacific Municipal Water Build-Out | |
    4. 4.4 Mercury and Flue-Gas Emission Controls | |
    5. 4.5 Gold Recovery at Record Bullion Prices | |
    6. 4.6 Tighter Vehicle Evaporative-Emission Standards | |
  5. 5 Restraints Impact Analysis | |
    1. 5.1 Coconut-Shell Feedstock Volatility | |
    2. 5.2 Energy and Coal Cost Exposure | |
    3. 5.3 Competing PFAS Treatment Technologies | |
    4. 5.4 Spent-Media Handling and PFAS Destruction Limits | |
    5. 5.5 U.S. Regulatory Timing Uncertainty | |
  6. 6 Opportunities | |
    1. 6.1 Regional Reactivation Hubs | |
    2. 6.2 Emerging-Market Municipal Programmes | |
    3. 6.3 Performance-Based Service Contracts and Data Monetisation | |
    4. 6.4 Quaternary Effluent Treatment in Europe | |
    5. 6.5 Specialty Grades for Energy Storage | |
  7. 7 Regional Market Share and Country-Level Analysis | |
    1. 7.1 Asia-Pacific | | |
      1. 7.1.1 China | | |
      2. 7.1.2 India | | |
      3. 7.1.3 Japan | | |
      4. 7.1.4 South Korea | | |
      5. 7.1.5 ASEAN Countries | | |
      6. 7.1.6 Rest of Asia-Pacific | |
    2. 7.2 North America | | |
      1. 7.2.1 United States | | |
      2. 7.2.2 Canada | | |
      3. 7.2.3 Mexico | |
    3. 7.3 Europe | | |
      1. 7.3.1 Germany | | |
      2. 7.3.2 United Kingdom | | |
      3. 7.3.3 France | | |
      4. 7.3.4 Italy | | |
      5. 7.3.5 Spain | | |
      6. 7.3.6 NORDIC Countries | | |
      7. 7.3.7 Rest of Europe | |
    4. 7.4 South America | | |
      1. 7.4.1 Brazil | | |
      2. 7.4.2 Argentina | | |
      3. 7.4.3 Rest of South America | |
    5. 7.5 Middle East and Africa | | |
      1. 7.5.1 Saudi Arabia | | |
      2. 7.5.2 South Africa | | |
      3. 7.5.3 Rest of Middle East and Africa | |
  8. 8 Future Outlook (2026–2035) | |
    1. 8.1 PFAS-Driven Reactivation Capacity Cycle | |
    2. 8.2 Digital Bed-Life Monitoring | |
    3. 8.3 Feedstock Decarbonisation and Lifecycle Reporting | |
    4. 8.4 Energy Storage and Carbon Capture | |
  9. 9 Segmentation Analysis | |
    1. 9.1 By Raw Material | | |
      1. 9.1.1 Coal-Based | | |
      2. 9.1.2 Coconut-Shell-Based | | |
      3. 9.1.3 Wood-Based | | |
      4. 9.1.4 Other (Peat, Lignite, etc.) | |
    2. 9.2 By Form | | |
      1. 9.2.1 Powdered Activated Carbon (PAC) | | |
      2. 9.2.2 Granular Activated Carbon (GAC) | | |
      3. 9.2.3 Extruded/Pelletised Activated Carbon (EAC) | |
    3. 9.3 By Application | | |
      1. 9.3.1 Decolorisation Treatment | | |
      2. 9.3.2 Sugar Production | | |
      3. 9.3.3 Concentration Treatment | | |
      4. 9.3.4 Solvent Recovery | | |
      5. 9.3.5 PFAS Adsorption Treatment | | |
      6. 9.3.6 Drinking Water Treatment | | |
      7. 9.3.7 Other Applications | |
    4. 9.4 By End-user Industry | | |
      1. 9.4.1 Water Treatment | | |
      2. 9.4.2 Industrial Processing | | |
      3. 9.4.3 Healthcare | | |
      4. 9.4.4 Food and Beverage | | |
      5. 9.4.5 Automotive | | |
      6. 9.4.6 Other End-user Industries | |
  10. 10 Competitive Landscape | |
    1. 10.1 Market Concentration Analysis | |
    2. 10.2 Competitive Benchmarking Table | |
  11. 11 Recent News & Developments | |
  12. 12 Report Scope and Methodology | |
  13. 13 Detailed Sources and Citations | |
  14. 14 Frequently Asked Questions (FAQs) | | LIST OF TABLES | |
  15. TABLE 1 Global Market Summary Snapshot, 2025–2035 | |
  16. TABLE 2 Global Market Size & Forecast, by Revenue (USD Billion), 2021–2035 | |
  17. TABLE 3 Driver Impact Analysis | |
  18. TABLE 4 Restraints Impact Analysis | |
  19. TABLE 5 Regional Summary, 2025 | |
  20. TABLE 6 Asia-Pacific Market, by Country, 2025 | |
  21. TABLE 7 North America Market, by Country, 2025 | |
  22. TABLE 8 Europe Market, by Country, 2025 | |
  23. TABLE 9 South America Market, by Country, 2025 | |
  24. TABLE 10 Middle East and Africa Market, by Country, 2025 | |
  25. TABLE 11 Global Market, by Raw Material, 2025 | |
  26. TABLE 12 Global Market, by Form, 2025 | |
  27. TABLE 13 Global Market, by Application, 2025 | |
  28. TABLE 14 Global Market, by End-user Industry, 2025 | |
  29. TABLE 15 Competitive Benchmarking Table | |
  30. TABLE 16 Report Scope and Methodology | |
  31. TABLE 17 Detailed Sources and Citations | |
  32. TABLE 18 Segmentation Quick Reference | | LIST OF FIGURES | |
  33. FIGURE 1 Market Dynamics Overview (Drivers, Restraints, Opportunities) | |
  34. FIGURE 2 Industry Value Chain Analysis | |
  35. FIGURE 3 Porter's Five Forces Analysis | |
  36. FIGURE 4 Global Market Size Trend (USD Billion), 2021–2035 | |
  37. FIGURE 5 Market Share by Raw Material, 2025 | |
  38. FIGURE 6 Market Share by Form, 2025 | |
  39. FIGURE 7 Market Share by Application, 2025 | |
  40. FIGURE 8 Market Share by End-user Industry, 2025 | |
  41. FIGURE 9 Regional Market Share, 2025 | |
  42. FIGURE 10 Country-Level Market Share within Regions, 2025 | |
  43. FIGURE 11 Competitive Landscape and Estimated Revenue Share Ranges

Segmentation Quick Reference

DimensionSub-SegmentsDominant SegmentFastest Growing Segment
By Raw MaterialCoal-Based; Coconut-Shell-Based; Wood-Based; Other (Peat, Lignite, etc.)Coal-Based (46.2% share)Coconut-Shell-Based (7.3% CAGR)
By FormPowdered Activated Carbon (PAC); Granular Activated Carbon (GAC); Extruded/Pelletised Activated Carbon (EAC)Powdered Activated Carbon (PAC) (51.2% share)Granular Activated Carbon (GAC) (6.8% CAGR)
By ApplicationDecolorisation Treatment; Sugar Production; Concentration Treatment; Solvent Recovery; PFAS Adsorption Treatment; Drinking Water Treatment; Other ApplicationsDrinking Water Treatment (45.6% share)Decolorisation Treatment (7.0% CAGR)
By End-user IndustryWater Treatment; Industrial Processing; Healthcare; Food and Beverage; Automotive; Other End-user IndustriesWater Treatment (45.1% share)Water Treatment (45.1% share, highest growth)
By RegionAsia-Pacific; North America; Europe; South America; Middle-East and AfricaAsia-Pacific (43.5% share)Asia-Pacific (43.5% share, highest growth)

Market Segmentation Overview

By Raw Material

Sub-SegmentKey Trend
Coal-BasedCost leadership in municipal and flue-gas tenders
Coconut-Shell-BasedMicropore performance for PFAS and gold recovery
Wood-BasedChemical activation for food and pharma grades
Other (Peat, Lignite, etc.)Feedstock hedging and pilot activation routes

Coal-Based grades lead because low-cost domestic coal in China, India and the United States keeps them competitive in price-driven municipal tenders. Coconut-Shell-Based carbon grows fastest since its fine micropores capture short-chain PFAS and its hardness withstands gold-circuit abrasion. Wood-Based and Other (Peat, Lignite, etc.) feedstocks matter increasingly as producers diversify away from volatile coconut supply.

By Form

Sub-SegmentKey Trend
Powdered Activated Carbon (PAC)Flexible dosing for seasonal and batch use
Granular Activated Carbon (GAC)Regenerable fixed beds for continuous PFAS treatment
Extruded/Pelletised Activated Carbon (EAC)High strength for canisters and gas-phase systems

Powdered Activated Carbon (PAC) holds the largest share because it doses directly into existing clarifiers without new vessels. Granular Activated Carbon (GAC) grows fastest as PFAS rules require continuous treatment and reactivation lowers lifetime cost. Extruded/Pelletised Activated Carbon (EAC) remains tied to automotive and flue-gas specifications that demand low pressure drop.

By Application

Sub-SegmentKey Trend
Decolorisation TreatmentShift to continuous fixed-bed columns in refining
Sugar ProductionSteady demand linked to refined sugar quality
Concentration TreatmentRecovery of metals and valuable products
Solvent RecoveryVOC capture in chemicals and coatings
PFAS Adsorption TreatmentGroundwater and drinking-water remediation
Drinking Water TreatmentMunicipal compliance and infrastructure upgrades
Other ApplicationsMicroelectronics and respiratory protection

Drinking Water Treatment leads through the scale of municipal infrastructure and binding PFAS limits in the United States and Europe. Decolorisation Treatment grows fastest as cane-sugar refiners and pharmaceutical producers adopt fixed-bed GAC columns that cut carbon loss. PFAS Adsorption Treatment and Solvent Recovery add smaller but higher-margin volume.

By End-user Industry

Sub-SegmentKey Trend
Water TreatmentMulti-year framework agreements tied to PFAS deadlines
Industrial ProcessingSolvent recovery and ultrapure water
HealthcareDialysis and pharmaceutical purification grades
Food and BeverageLow-ash grades for sugar, oils and beverages
AutomotiveCanister demand sustained by hybrid vehicles
Other End-user IndustriesMining and emerging energy storage uses

Water Treatment is both the dominant and fastest-growing end-user group because utilities must meet PFAS and disinfection by-product limits on fixed timelines. Industrial Processing ranks second, using carbon for solvent recovery and semiconductor-grade water. Healthcare and Food and Beverage buyers sustain demand for premium low-ash grades, while Automotive holds steady on hybrid canister requirements.


Download PDF ×

We do not share your information with anyone. However, we may send you emails based on your report interest from time to time. You may contact us at any time to opt-out.