Account Payable Market
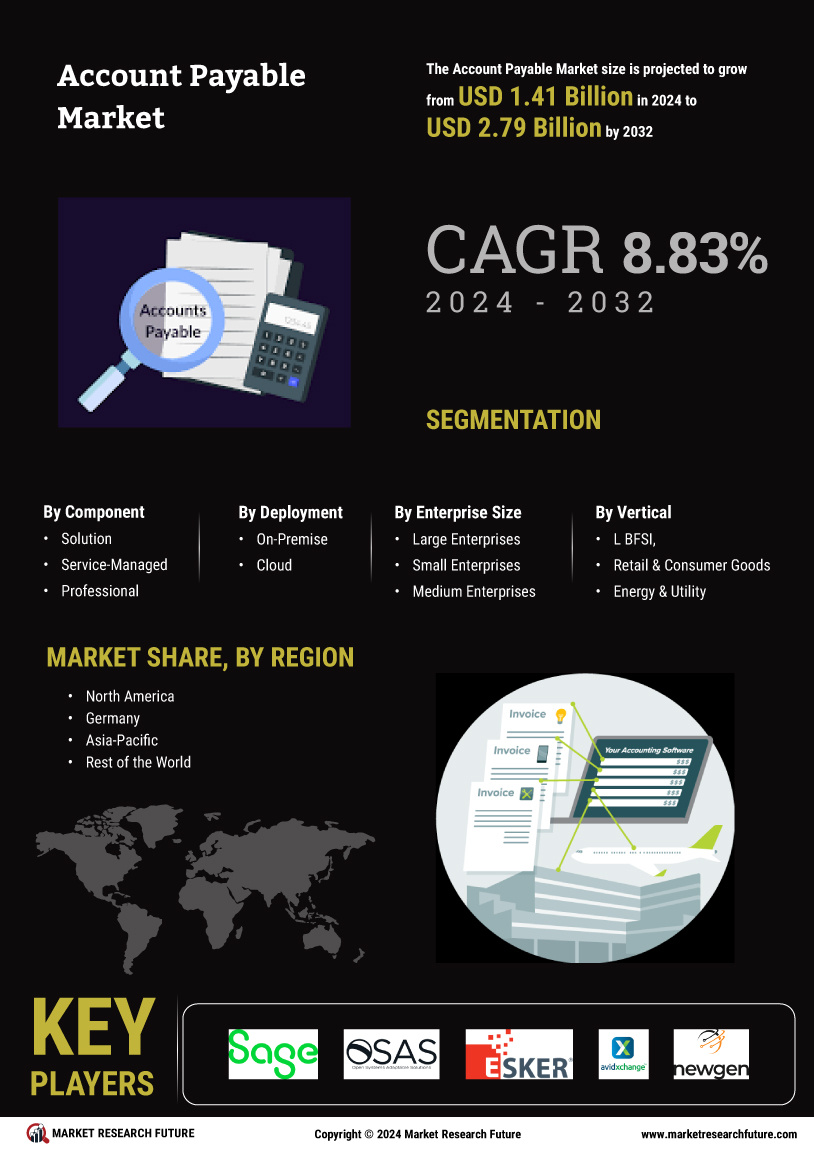
Account Payable Market Size, Share and Research Report By Component (Solution, Service-Managed and Professional), By Deployment (On-Premise, Cloud), By Enterprise Size (Large Enterprises, Small Enterprises and Medium Enterprises), By Vertical (BFSI, Retail & Consumer Goods, Energy & Utility, Healthcare, IT and Telecommunication, Manufacturing and Other) And By Region (North America, Europe, Asia-Pacific, And Rest Of The World) –Industry Forecast Till 2035
Forecast Period
2025 - 2035
2024 Market Size
$ 1.41 Billion
2035 Market Size
$ 3.58 Billion
BFSI
● Updated April 2026
Report ID: MRFR/BS/7211-HCR
|
Pages: 200
|
Author: Ankit Gupta