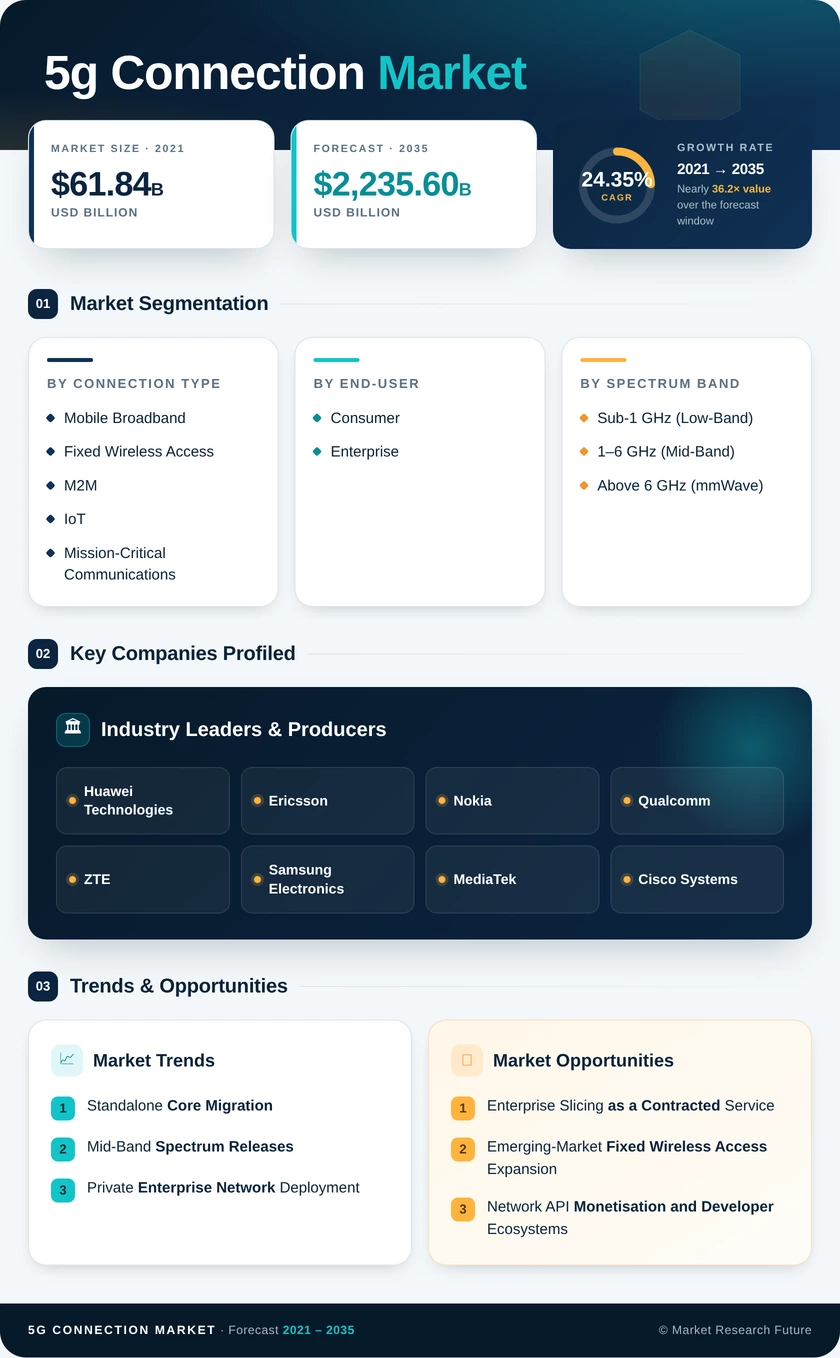
5G Connection Market (2026 – 2035)

ID: MRFR/ICT/32756-HCR 100 Pages Aarti Dhapte Last Updated: October 17, 2026
5G Connection Market Size, Share and Research Report By Connection Type (Mobile Broadband, Fixed Wireless Access, M2M and IoT, and Mission-Critical Communications), By End-user (Consumer and Enterprise), By Spectrum Band (Sub-1 GHz (Low-Band), 1–6 GHz (Mid-Band), and Above 6 GHz (mmWave)), By Network Architecture (Non-Standalone (NSA) and Standalone (SA)), By Device Category (Smartphones and Tablets, FWA CPE, Industrial Routers and Gateways, IoT Modules and RedCap Devices, and AR/VR and Wearables), By Service Type (Enhanced Mobile Broadband (eMBB), Massive Machine-Type Communications (mMTC), and Ultra-Reliable Low-Latency Communications (URLLC)) And By Region (North America, Europe, Asia-Pacific, And Rest Of The World) – Industry Forecast Till 2035
5G Connection Market
Market Size
Forecast Period2026-2035
CAGR (2026-2035)24.35%
2025 Market SizeUSD 213.47 Billion
2035 Market SizeUSD 2,235.60 Billion
Key Players
Huawei Technologies
Ericsson
Nokia
Qualcomm
ZTE
Samsung Electronics
Opportunities
  • Enterprise Slicing as a Contracted Service
  • Emerging-Market Fixed Wireless Access Expansion
  • Network API Monetisation and Developer Ecosystems
  1. 1 Market Summary | |
    1. 1.1 Study Assumptions & Market Definition | |
    2. 1.2 Scope of the Study | |
    3. 1.3 Research Methodology | |
  2. 2 Key Report Takeaways | |
    1. 2.1 By Connection Type | |
    2. 2.2 By End-user | |
    3. 2.3 By Spectrum Band | |
    4. 2.4 By Network Architecture | |
    5. 2.5 By Device Category | |
    6. 2.6 By Service Type | |
    7. 2.7 By Region | |
  3. 3 Market Size and Forecast (2021–2035) | |
    1. 3.1 Historical Market Size (2021–2024) | |
    2. 3.2 Base Year Assessment (2025) | |
    3. 3.3 Forecast Market Size (2026–2035) | |
    4. 3.4 Year-over-Year Growth Analysis | |
  4. 4 Driver Impact Analysis | |
    1. 4.1 Standalone Core Migration | |
    2. 4.2 Mid-Band Spectrum Releases | |
    3. 4.3 Private Enterprise Network Deployment | |
    4. 4.4 Fixed Wireless Access Substitution | |
    5. 4.5 RedCap and Cellular IoT Scaling | |
    6. 4.6 Handset Affordability and Subsidy Programmes | |
    7. 4.7 Network API and Edge Monetisation | |
  5. 5 Restraints Impact Analysis | |
    1. 5.1 High Mid-Band Spectrum Pricing | |
    2. 5.2 Rural Coverage Economics | |
    3. 5.3 Fibre Broadband Price Competition | |
    4. 5.4 Energy Cost of Network Densification | |
    5. 5.5 Enterprise Integration Skills Shortage | |
  6. 6 Opportunities | |
    1. 6.1 Enterprise Slicing as a Contracted Service | |
    2. 6.2 Emerging-Market Fixed Wireless Access Expansion | |
    3. 6.3 Network API Monetisation and Developer Ecosystems | |
    4. 6.4 RedCap-Enabled Industrial Sensor Deployments | |
    5. 6.5 Edge Compute Co-Location with Operator Infrastructure | |
  7. 7 Regional Market Share and Country-Level Analysis | |
    1. 7.1 Asia-Pacific | | |
      1. 7.1.1 China | | |
      2. 7.1.2 India | | |
      3. 7.1.3 Japan | | |
      4. 7.1.4 South Korea | | |
      5. 7.1.5 Rest of Asia-Pacific | |
    2. 7.2 North America | | |
      1. 7.2.1 United States | |
    3. 7.3 Europe | | |
      1. 7.3.1 Germany | | |
      2. 7.3.2 United Kingdom | | |
      3. 7.3.3 France | | |
      4. 7.3.4 Italy | | |
      5. 7.3.5 Rest of Europe | |
    4. 7.4 South America | | |
      1. 7.4.1 Brazil | | |
      2. 7.4.2 Argentina | | |
      3. 7.4.3 Chile | | |
      4. 7.4.4 Rest of South America | |
    5. 7.5 Middle East & Africa | | |
      1. 7.5.1 Saudi Arabia | | |
      2. 7.5.2 United Arab Emirates | | |
      3. 7.5.3 South Africa | | |
      4. 7.5.4 Rest of Middle East & Africa | |
  8. 8 Future Outlook (2026–2035) | |
    1. 8.1 Autonomous Network Operations | |
    2. 8.2 Platform Economics and API Aggregation | |
    3. 8.3 Spectrum Transition Toward 6G | |
    4. 8.4 Energy and Sustainability Reporting | |
  9. 9 Segmentation Analysis | |
    1. 9.1 By Connection Type | | |
      1. 9.1.1 Mobile Broadband | | |
      2. 9.1.2 Fixed Wireless Access | | |
      3. 9.1.3 M2M and IoT | | |
      4. 9.1.4 Mission-Critical Communications | |
    2. 9.2 By End-user | | |
      1. 9.2.1 Consumer | | |
      2. 9.2.2 Enterprise | |
    3. 9.3 By Spectrum Band | | |
      1. 9.3.1 Sub-1 GHz (Low-Band) | | |
      2. 9.3.2 1–6 GHz (Mid-Band) | | |
      3. 9.3.2 Above 6 GHz (mmWave) | |
    4. 9.4 By Network Architecture | | |
      1. 9.4.1 Non-Standalone (NSA) | | |
      2. 9.4.2 Standalone (SA) | |
    5. 9.5 By Device Category | | |
      1. 9.5.1 Smartphones and Tablets | | |
      2. 9.5.2 FWA CPE | | |
      3. 9.5.3 Industrial Routers and Gateways | | |
      4. 9.5.4 IoT Modules and RedCap Devices | | |
      5. 9.5.5 AR/VR and Wearables | |
    6. 9.6 By Service Type | | |
      1. 9.6.1 Enhanced Mobile Broadband (eMBB) | | |
      2. 9.6.2 Massive Machine-Type Communications (mMTC) | | |
      3. 9.6.3 Ultra-Reliable Low-Latency Communications (URLLC) | |
  10. 10 Competitive Landscape | |
    1. 10.1 Market Concentration Analysis | |
    2. 10.2 Competitive Benchmarking Matrix | |
    3. 10.3 Company Profiles | |
  11. 11 Recent News & Developments | |
  12. 12 Report Scope and Methodology | |
  13. 13 Detailed Sources and Citations | |
  14. 14 Frequently Asked Questions | | LIST OF TABLES | |
  15. TABLE 1 Global 5G Connection Market Size & Forecast, by Revenue (USD Billion), 2021–2035 | |
  16. TABLE 2 Global 5G Connection Market – Year-over-Year Growth Analysis, 2021–2035 | |
  17. TABLE 3 Driver Impact Analysis – 5G Connection Market, 2026–2035 | |
  18. TABLE 4 Restraint Impact Analysis – 5G Connection Market, 2026–2035 | |
  19. TABLE 5 Global 5G Connection Market Size, by Region, 2021–2035 (USD Billion) | |
  20. TABLE 6 Asia-Pacific 5G Connection Market Size, by Country, 2021–2035 (USD Billion) | |
  21. TABLE 7 North America 5G Connection Market Size, by Country, 2021–2035 (USD Billion) | |
  22. TABLE 8 Europe 5G Connection Market Size, by Country, 2021–2035 (USD Billion) | |
  23. TABLE 9 South America 5G Connection Market Size, by Country, 2021–2035 (USD Billion) | |
  24. TABLE 10 Middle East & Africa 5G Connection Market Size, by Country, 2021–2035 (USD Billion) | |
  25. TABLE 11 Global 5G Connection Market Size, by Connection Type, 2021–2035 (USD Billion) | |
  26. TABLE 12 Global 5G Connection Market Size, by End-user, 2021–2035 (USD Billion) | |
  27. TABLE 13 Global 5G Connection Market Size, by Spectrum Band, 2021–2035 (USD Billion) | |
  28. TABLE 14 Global 5G Connection Market Size, by Network Architecture, 2021–2035 (USD Billion) | |
  29. TABLE 15 Global 5G Connection Market Size, by Device Category, 2021–2035 (USD Billion) | |
  30. TABLE 16 Global 5G Connection Market Size, by Service Type, 2021–2035 (USD Billion) | |
  31. TABLE 17 Competitive Benchmarking Matrix – 5G Connection Market, 2026 | |
  32. TABLE 18 Company Profiles – Key Players, 5G Connection Market | |
  33. TABLE 19 Recent Developments & Strategic Announcements, 2023–2025 | |
  34. TABLE 20 Report Scope & Methodology Summary | |
  35. TABLE 21 Detailed Sources and Citations Index | | LIST OF FIGURES | |
  36. FIGURE 1 5G Connection Market Dynamics – Drivers, Restraints, and Opportunities | |
  37. FIGURE 2 Industry Value Chain Analysis – 5G Connection Market | |
  38. FIGURE 3 Porter's Five Forces Analysis – 5G Connection Market | |
  39. FIGURE 4 Global Market Size Trend, 2021–2035 (USD Billion) | |
  40. FIGURE 5 Year-over-Year Growth Curve, 2022–2035 (%) | |
  41. FIGURE 6 Market Share by Connection Type, 2025 vs 2035 (%) | |
  42. FIGURE 7 Market Share by End-user, 2025 vs 2035 (%) | |
  43. FIGURE 8 Market Share by Spectrum Band, 2025 (%) | |
  44. FIGURE 9 Market Share by Network Architecture, 2025 vs 2035 (%) | |
  45. FIGURE 10 Market Share by Device Category, 2025 (%) | |
  46. FIGURE 11 Market Share by Service Type, 2025 (%) | |
  47. FIGURE 12 Regional Market Share Distribution, 2025 (%) | |
  48. FIGURE 13 Regional CAGR Comparison, 2026–2035 (%) | |
  49. FIGURE 14 Country-Level Share within Asia-Pacific, 2025 (%) | |
  50. FIGURE 15 Competitive Landscape Positioning Matrix, 2026 | |
  51. FIGURE 16 Top-Five Vendor Share Concentration, 2025 (%)

Segmentation Quick Reference

DimensionSub-SegmentsDominant SegmentFastest Growing Segment
By Connection TypeMobile Broadband; Fixed Wireless Access; M2M and IoT; Mission-Critical CommunicationsMobile Broadband — 57.86% share (2025)M2M and IoT — 25.62% CAGR (2026–2035)
By End-userConsumer; EnterpriseConsumer — 71.05% share (2025)Enterprise — 27.18% CAGR (2026–2035)
By Spectrum BandSub-1 GHz (Low-Band); 1–6 GHz (Mid-Band); Above 6 GHz (mmWave)1–6 GHz (Mid-Band) — 53.14% share (2025)Above 6 GHz (mmWave) — 27.69% CAGR (2026–2035)
By Network ArchitectureNon-Standalone (NSA); Standalone (SA)Non-Standalone (NSA) — 64.87% share (2025)Standalone (SA) — 26.52% CAGR (2026–2035)
By Device CategorySmartphones and Tablets; FWA CPE; Industrial Routers and Gateways; IoT Modules and RedCap Devices; AR/VR and WearablesSmartphones and Tablets — 78.29% share (2025)FWA CPE — 28.64% CAGR (2026–2035)
By Service TypeEnhanced Mobile Broadband (eMBB); Massive Machine-Type Communications (mMTC); Ultra-Reliable Low-Latency Communications (URLLC)Enhanced Mobile Broadband (eMBB) — 74.51% share (2025)Ultra-Reliable Low-Latency Communications (URLLC) — 25.81% CAGR (2026–2035)
By RegionAsia-Pacific; North America; Europe; South America; Middle East & AfricaAsia-Pacific — 48.56% shareAsia-Pacific — 26.87% CAGR


Market Segmentation Overview

By Connection Type

Sub-SegmentKey Trend
Mobile BroadbandHandset upgrade cycles sustain volume while share erodes to enterprise categories.
Fixed Wireless AccessCPE cost reduction opens household segments fibre cannot reach economically
M2M and IoTRedCap module pricing unlocks high-density industrial sensor deployments.
Mission-Critical CommunicationsPublic-safety network modernisation drives premium-priced prioritised service tiers


Mobile Broadband remains the largest category because handset replacement cycles guarantee continuous connection additions, but M2M and IoT grows fastest as industrial buyers purchase connectivity as a production input rather than a consumer service. The decisive variable is module economics: until RedCap silicon reached volume pricing, deploying tens of thousands of endpoints per facility could not be justified against wired alternatives. Fixed Wireless Access sits between the two, monetising household demand with equipment that operators increasingly subsidise.

By End-user

Sub-SegmentKey Trend
ConsumerStreaming and gaming traffic sustains volume leadership across all regions
EnterpriseDigital-transformation mandates in manufacturing, healthcare, and utilities drive premium contracts.


Consumer connections lead on absolute count and will continue to, since handset penetration dwarfs every industrial application. Enterprise grows considerably faster because average revenue per connection runs several multiples higher and because procurement decisions are now backed by measured operational returns rather than pilot enthusiasm. Manufacturing line-efficiency gains and documented clinical outcomes in hospital deployments have converted enterprise buying from experimental budgets into capital programmes, which is what changes the growth trajectory.

By Spectrum Band

Sub-SegmentKey Trend
Sub-1 GHz (Low-Band)Rural coverage and in-building penetration at minimal site density
1–6 GHz (Mid-Band)Primary national capacity layer across every major market
Above 6 GHz (mmWave)Urban densification and multi-gigabit fixed wireless throughput


Mid-band leads because it resolves the capacity-coverage trade-off that neither Sub-1 GHz nor mmWave can address alone, and regulators have concentrated award programmes there accordingly. mmWave grows fastest from a small base as phased-array customer equipment and improved antenna designs overcome the line-of-sight constraints that stalled early deployments. Sub-1 GHz retains strategic weight disproportionate to its share, covering rural populations at site counts mid-band could never make economic.

By Network Architecture

Sub-SegmentKey Trend
Non-Standalone (NSA)Legacy overlay approach reaching its monetisation ceiling
Standalone (SA)Cloud-native cores enabling slicing, URLLC, and enforceable enterprise agreements.


Non-Standalone holds the larger installed base because operators bolted 5G radios onto existing packet cores to reach market quickly, and that decision now caps what they can sell. Standalone grows fastest because slicing and deterministic latency are technically impossible without it, and enterprise contracts depend on both. Regional divergence is stark — the United States and India completed nationwide standalone footprints while European availability remains near 2%, a direct consequence of licence-fee burdens deferring core investment.

By Device Category

Sub-SegmentKey Trend
Smartphones and TabletsSubsidised replacement cycles maintain overwhelming device-count majority
FWA CPEHousehold broadband substitution where fibre build economics fail.
Industrial Routers and GatewaysAutomated warehousing and smart-grid substation connectivity
IoT Modules and RedCap DevicesLow-power endpoints for asset tracking and factory sensing
AR/VR and WearablesLatency reduction under 5G Advanced enabling untethered immersive use


Smartphones and Tablets dominate device counts and will throughout the forecast, driven by carrier subsidy structures that make replacement near-automatic. FWA CPE grows fastest because each unit converts a mobile network into a fixed broadband business, and shipment volumes track household penetration in markets where trenching costs cannot be recovered. IoT Modules and RedCap Devices matter for a different reason — they occupy a cost and power band where no cellular option previously existed, which expands the addressable endpoint base rather than replacing existing connections.

By Service Type

Sub-SegmentKey Trend
Enhanced Mobile Broadband (eMBB)Consumer video and data consumption carrying the bulk of network traffic
Massive Machine-Type Communications (mMTC)High-density meter and sensor connectivity at low per-endpoint cost
Ultra-Reliable Low-Latency Communications (URLLC)Industrial control and remote operation requiring deterministic performance.


Enhanced Mobile Broadband leads decisively on traffic share and underwrote the original commercial case for 5G deployment. URLLC grows fastest because standalone cores have only recently made it deliverable, and its economics differ fundamentally — a single industrial automation contract can exceed the value of thousands of consumer lines, so growth is contract-driven rather than volume-driven. mMTC scales on endpoint count, with RedCap chipset availability acting as the practical gating factor on deployment pace.




Download PDF ×

We do not share your information with anyone. However, we may send you emails based on your report interest from time to time. You may contact us at any time to opt-out.