Certified Global Research Member
Isomar fd.webp Wcrc 57.webp
Key Questions Answered
  • Global Market Outlook
  • In-depth analysis of global and regional trends
  • Analyze and identify the major players in the market, their market share, key developments, etc.
  • To understand the capability of the major players based on products offered, financials, and strategies.
  • Identify disrupting products, companies, and trends.
  • To identify opportunities in the market.
  • Analyze the key challenges in the market.
  • Analyze the regional penetration of players, products, and services in the market.
  • Comparison of major players’ financial performance.
  • Evaluate strategies adopted by major players.
  • Recommendations
Why Choose Market Research Future?
  • Vigorous research methodologies for specific market.
  • Knowledge partners across the globe
  • Large network of partner consultants.
  • Ever-increasing/ Escalating data base with quarterly monitoring of various markets
  • Trusted by fortune 500 companies/startups/ universities/organizations
  • Large database of 5000+ markets reports.
  • Effective and prompt pre- and post-sales support.

3D Machine Vision Market Research Report Information By Component (Hardware and Software), By Product (Smart Camera-Based and PC Based), By Application (Measurement and Quality Assurance & Inspection), By Vertical (Automotive, Semiconductor, Consumer Electronics, Healthcare, and Food & Packaging & Others) And By Region (North America, Europe, Asia-Pacific, And Rest Of The World) –Market Forecast Till 2030.


ID: MRFR/ICT/1009-CR | 128 Pages | Author: Ankit Gupta| March 2023

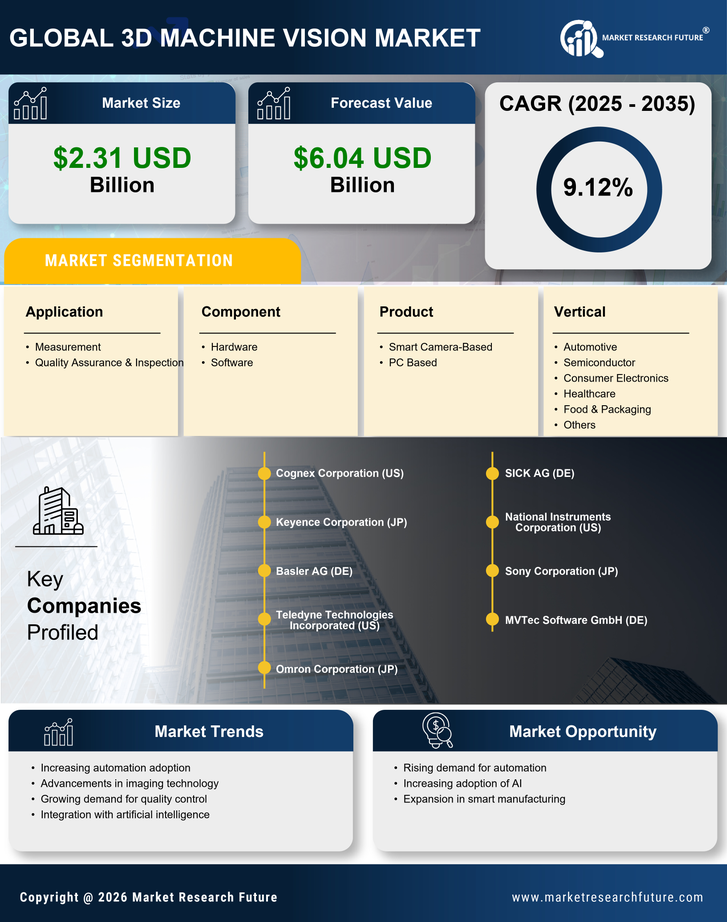
3D Machine Vision Market Segmentation


3D Machine Vision Component Outlook (USD Billion, 2019-2030)


  • Hardware


  • Software


3D Machine Vision Product Outlook (USD Billion, 2019-2030)


  • Smart Camera-Based


  • PC Based


3D Machine Vision Application Outlook (USD Billion, 2019-2030)


  • Measurement


  • Quality Assurance & Inspection


3D Machine Vision Vertical Outlook (USD Billion, 2019-2030)


  • Automotive


  • Semiconductor


  • Consumer Electronics


  • Healthcare


  • Food and Packaging and others


3D Machine Vision Regional Outlook (USD Billion, 2019-2030)


  • North America Outlook (USD Billion, 2019-2030)


    • North America 3D Machine Vision by Component


      • Hardware


      • Software


    • North America 3D Machine Vision by Product


      • Smart Camera-Based


      • PC Based


    • North America 3D Machine Vision by Application


      • Measurement


      • Quality Assurance & Inspection


    • North America 3D Machine Vision by Vertical


      • Automotive


      • Semiconductor


      • Consumer Electronics


      • Healthcare


      • Food and Packaging and others


    • US Outlook (USD Billion, 2019-2030)


    • US 3D Machine Vision by Component


      • Hardware


      • Software


    • US 3D Machine Vision by Product


      • Smart Camera-Based


      • PC Based


    • US 3D Machine Vision by Application


      • Measurement


      • Quality Assurance & Inspection


    • US 3D Machine Vision by Vertical


      • Automotive


      • Semiconductor


      • Consumer Electronics


      • Healthcare


      • Food and Packaging and others


    • CANADA Outlook (USD Billion, 2019-2030)


    • CANADA 3D Machine Vision by Component


      • Hardware


      • Software


    • CANADA 3D Machine Vision by Product


      • Smart Camera-Based


      • PC Based


    • CANADA 3D Machine Vision by Application


      • Measurement


      • Quality Assurance & Inspection


    • CANADA 3D Machine Vision by Vertical


      • Automotive


      • Semiconductor


      • Consumer Electronics


      • Healthcare


      • Food and Packaging and others


  • Europe Outlook (USD Billion, 2019-2030)


    • Europe 3D Machine Vision by Component


      • Hardware


      • Software


    • Europe 3D Machine Vision by Product


      • Smart Camera-Based


      • PC Based


    • Europe 3D Machine Vision by Application


      • Measurement


      • Quality Assurance & Inspection


    • Europe 3D Machine Vision by Vertical


      • Automotive


      • Semiconductor


      • Consumer Electronics


      • Healthcare


      • Food and Packaging and others


    • Germany Outlook (USD Billion, 2019-2030)


    • Germany 3D Machine Vision by Component


      • Hardware


      • Software


    • Germany 3D Machine Vision by Product


      • Smart Camera-Based


      • PC Based


    • Germany 3D Machine Vision by Application


      • Measurement


      • Quality Assurance & Inspection


    • Germany 3D Machine Vision by Vertical


      • Automotive


      • Semiconductor


      • Consumer Electronics


      • Healthcare


      • Food and Packaging and others


    • France Outlook (USD Billion, 2019-2030)


    • France 3D Machine Vision by Component


      • Hardware


      • Software


    • France 3D Machine Vision by Product


      • Smart Camera-Based


      • PC Based


    • France 3D Machine Vision by Application


      • Measurement


      • Quality Assurance & Inspection


    • France 3D Machine Vision by Vertical


      • Automotive


      • Semiconductor


      • Consumer Electronics


      • Healthcare


      • Food and Packaging and others


    • UK Outlook (USD Billion, 2019-2030)


    • UK 3D Machine Vision by Component


      • Hardware


      • Software


    • UK 3D Machine Vision by Product


      • Smart Camera-Based


      • PC Based


    • UK 3D Machine Vision by Application


      • Measurement


      • Quality Assurance & Inspection


    • UK 3D Machine Vision by Vertical


      • Automotive


      • Semiconductor


      • Consumer Electronics


      • Healthcare


      • Food and Packaging and others


    • ITALY Outlook (USD Billion, 2019-2030)


    • ITALY 3D Machine Vision by Component


      • Hardware


      • Software


    • ITALY 3D Machine Vision by Product


      • Smart Camera-Based


      • PC Based


    • ITALY 3D Machine Vision by Application


      • Measurement


      • Quality Assurance & Inspection


    • ITALY 3D Machine Vision by Vertical


      • Automotive


      • Semiconductor


      • Consumer Electronics


      • Healthcare


      • Food and Packaging and others


    • SPAIN Outlook (USD Billion, 2019-2030)


    • Spain 3D Machine Vision by Component


      • Hardware


      • Software


    • Spain 3D Machine Vision by Product


      • Smart Camera-Based


      • PC Based


    • Spain 3D Machine Vision by Application


      • Measurement


      • Quality Assurance & Inspection


    • Spain 3D Machine Vision by Vertical


      • Automotive


      • Semiconductor


      • Consumer Electronics


      • Healthcare


      • Food and Packaging and others


    • Rest Of Europe Outlook (USD Billion, 2019-2030)


    • Rest Of Europe 3D Machine Vision by Component


      • Hardware


      • Software


    • REST OF EUROPE 3D Machine Vision by Product


      • Smart Camera-Based


      • PC Based


    • Rest Of Europe 3D Machine Vision by Application


      • Measurement


      • Quality Assurance & Inspection


    • REST OF EUROPE 3D Machine Vision by Vertical


      • Automotive


      • Semiconductor


      • Consumer Electronics


      • Healthcare


      • Food and Packaging and others


  • Asia-Pacific Outlook (USD Billion, 2019-2030)


    • Asia-Pacific 3D Machine Vision by Component


      • Hardware


      • Software


    • Asia-Pacific 3D Machine Vision by Product


      • Smart Camera-Based


      • PC Based


    • Asia-Pacific 3D Machine Vision by Application


      • Measurement


      • Quality Assurance & Inspection


    • Asia-Pacific 3D Machine Vision by Vertical


      • Automotive


      • Semiconductor


      • Consumer Electronics


      • Healthcare


      • Food and Packaging and others


    • China Outlook (USD Billion, 2019-2030)


    • China 3D Machine Vision by Component


      • Hardware


      • Software


    • China 3D Machine Vision by Product


      • Smart Camera-Based


      • PC Based


    • China 3D Machine Vision by Application


      • Measurement


      • Quality Assurance & Inspection


    • China 3D Machine Vision by Vertical


      • Automotive


      • Semiconductor


      • Consumer Electronics


      • Healthcare


      • Food and Packaging and others


    • Japan Outlook (USD Billion, 2019-2030)


    • Japan 3D Machine Vision by Component


      • Hardware


      • Software


    • Japan 3D Machine Vision by Product


      • Smart Camera-Based


      • PC Based


    • Japan 3D Machine Vision by Application


      • Measurement


      • Quality Assurance & Inspection


    • Japan 3D Machine Vision by Vertical


      • Automotive


      • Semiconductor


      • Consumer Electronics


      • Healthcare


      • Food and Packaging and others


    • India Outlook (USD Billion, 2019-2030)


    • India 3D Machine Vision by Component


      • Hardware


      • Software


    • India 3D Machine Vision by Product


      • Smart Camera-Based


      • PC Based


    • India 3D Machine Vision by Application


      • Measurement


      • Quality Assurance & Inspection


    • India 3D Machine Vision by Vertical


      • Automotive


      • Semiconductor


      • Consumer Electronics


      • Healthcare


      • Food and Packaging and others


    • Australia Outlook (USD Billion, 2019-2030)


    • Australia 3D Machine Vision by Component


      • Hardware


      • Software


    • Australia 3D Machine Vision by Product


      • Smart Camera-Based


      • PC Based


    • Australia 3D Machine Vision by Application


      • Measurement


      • Quality Assurance & Inspection


    • Australia 3D Machine Vision by Vertical


      • Automotive


      • Semiconductor


      • Consumer Electronics


      • Healthcare


      • Food and Packaging and others


    • Rest of Asia-Pacific Outlook (USD Billion, 2019-2030)


    • Rest of Asia-Pacific 3D Machine Vision by Component


      • Hardware


      • Software


    • Rest of Asia-Pacific 3D Machine Vision by Product


      • Smart Camera-Based


      • PC Based


    • Rest of Asia-Pacific 3D Machine Vision by Application


      • Measurement


      • Quality Assurance & Inspection


    • Rest of Asia-Pacific 3D Machine Vision by Vertical


      • Automotive


      • Semiconductor


      • Consumer Electronics


      • Healthcare


      • Food and Packaging and others


  • Rest of the World Outlook (USD Billion, 2019-2030)


    • Rest of the World 3D Machine Vision by Component


      • Hardware


      • Software


    • Rest of the World 3D Machine Vision by Product


      • Smart Camera-Based


      • PC Based


    • Rest of the World 3D Machine Vision by Application


      • Measurement


      • Quality Assurance & Inspection


    • Rest of the World 3D Machine Vision by Vertical


      • Automotive


      • Semiconductor


      • Consumer Electronics


      • Healthcare


      • Food and Packaging and others


    • Middle East Outlook (USD Billion, 2019-2030)


    • Middle East 3D Machine Vision by Component


      • Hardware


      • Software


    • Middle East 3D Machine Vision by Product


      • Smart Camera-Based


      • PC Based


    • Middle East 3D Machine Vision by Application


      • Measurement


      • Quality Assurance & Inspection


    • Middle East 3D Machine Vision by Vertical


      • Automotive


      • Semiconductor


      • Consumer Electronics


      • Healthcare


      • Food and Packaging and others


    • Africa Outlook (USD Billion, 2019-2030)


    • Africa 3D Machine Vision by Component


      • Hardware


      • Software


    • Africa 3D Machine Vision by Product


      • Smart Camera-Based


      • PC Based


    • Africa 3D Machine Vision by Application


      • Measurement


      • Quality Assurance & Inspection


    • Africa 3D Machine Vision by Vertical


      • Automotive


      • Semiconductor


      • Consumer Electronics


      • Healthcare


      • Food and Packaging and others


    • Latin America Outlook (USD Billion, 2019-2030)


    • Latin America 3D Machine Vision by Component


      • Hardware


      • Software


    • Latin America 3D Machine Vision by Product


      • Smart Camera-Based


      • PC Based


    • Latin America 3D Machine Vision by Application


      • Measurement


      • Quality Assurance & Inspection


    • Latin America 3D Machine Vision by Vertical


      • Automotive


      • Semiconductor


      • Consumer Electronics


      • Healthcare


      • Food and Packaging and others


Research Methodology on the 3D Machine Vision Market


Research Objectives:


  • To analyze and forecast the market size of the Global 3D Machine Vision Market, in terms of value.

  • To identify the growth potential in different regions and countries of the Global 3D Machine Vision Market.

  • To identify the market dynamics of the Global 3D Machine Vision Market such as drivers, restraints, opportunities, and challenges.

  • To analyze competitive developments such as expansions, mergers & acquisitions, new product launches, agreements, partnerships, collaborations, and joint ventures in the Global 3D Machine Vision Market.

  • To strategically profile the key players and comprehensively analyze their market shares and core competencies.


Research Methodologies:


At Market Research Future (MRFR), we will adopt the following research methodologies to understand the Global 3D Machine Vision Market:


Primary Research:


Primary research includes field monitoring, surveys, interviews, detailed discussions with stakeholders, SMEs, and VOC (Voice of Customer), and primary interviews with industry experts. Primary research is used to validate the assessments and statistics obtained from secondary sources and to provide distinctive points of view on market development trends.


Secondary Research:


Secondary research includes sources such as public documents, company annual reports, data sources, press releases, websites, and industry databases referenced by our panel of industry experts and market analysts. Secondary research is used for the analysis of key developments in the industry, geographic analysis and dynamics.


The secondary sources include:


  • S&P Global Market Intelligence

  • Business Insider

  • Factiva

  • Industry reviews

  • Trade publications

  • Company websites

  • Electronic databases

  • Historical data/data from old surveys

  • National government documents

  • Internal and external proprietary databases

  • Theses and dissertations


Additionally, to make the report comprehensive, Market Research Future (MRFR) has added an expert qualitative and quantitative analysis. The analysis is derived from qualitative evaluations such as shareholder interviews, and current state economic and market trend scenarios to have an effective evaluation of the Global 3D Machine Vision Market.


Market Segmentation:


The Global 3D Machine Vision Market has been segmented in terms of component, type, application, and region.


Based on components, the market is segmented into hardware and software. The hardware component segment is further sub-segmented into cameras, processors, lighting sources, frame grabbers, and other components.


Based on type, the market has been segmented into presence/absence sensors, contour sensors, 2D machine vision, and 3D machine vision.


The applications of the Global 3D Machine Vision Market are divided into semiconductor & electronics, automotive, food & beverage, religion & conceptual, healthcare, aerospace & defence and others.


Based on region, the 3D Machine Vision Market has been segmented into North America, Europe, Asia-Pacific, and the Rest of the World (RoW).


Regional Analysis:


North America is anticipated to lead the Global 3D Machine Vision Market during the forecast period. The countries such as the US, Canada and Mexico are expected to be actively involved in the utilization of 3D machine vision techniques to propel advancements and expansion in the field of robotics, automation, and inspection. The automotive industry in the North American region is expected to be a lucrative market for 3D machine vision implementations. Europe is anticipated to exhibit significant growth levels in the Global 3D Machine Vision Market Share, attributed to the incorporation of 3D machine vision systems in the automotive, electronics and semiconductor, and healthcare industries.


Asia-Pacific is expected to witness prior expansion in the Global 3D Machine Vision Market during the forecast period 2023 to 2030. The countries such as China, India, Japan, and South Korea are actively involved in providing extensive opportunities for the growth of industrial automation and robotics, presenting the 3D machine vision market with innumerable growth opportunities. Additionally, the presence of reliable ports and well-developed IT infrastructure in the region is likely to drive the market during the estimated time frame.


Competitive Dashboard:


Some of the leading players, identified by MRFR in their recent market report include Vision Components GmbH (Germany), SICK AG (Germany), Stemmer Imaging Group (Germany), Cognex Corporation (US), IDS Imaging Development Systems GmbH (Germany), KEYENCE Corporation (Japan), Basler AG (Germany), National Instruments Corporation (US), Tordivel AS (Norway), and Omron Corporation (Japan).

Leading companies partner with us for data-driven Insights
client_1 client_2 client_3 client_4 client_5 client_6 client_7 client_8 client_9 client_10
Please fill in Business Email for Quick Response

1 Executive Summary

1.1 Market Summary

2 Market Introduction

2.1 Definition

2.2 Scope Of The Study

2.3 Market Structure

3 Market Insights

4 Research Methodology

4.1 Research Process

4.2 Primary Research

4.3 Secondary Research

4.4 Market Size Estimation

4.5 Forecast Model

4.6 List Of Assumptions

5 Market Dynamics

5.1 Introduction

5.2 Drivers

5.2.1 Growing Demand For Automated Quality Control Systems

5.2.2 Increasing Applications Of Machine Vision In The Automotive Industry

5.3 Restraints

5.3.1 Complexity In Deploying 3D Machine Vision Systems

5.4 Opportunities

5.4.1 The Emergence Of Industry 4.0

6 Market Factor Analysis

6.1 Value Chain Analysis

6.1.1 Component Suppliers

6.1.2 Original Equipment Manufacturers (OEMs)

6.1.3 System Integrators/Assemblers

6.1.4 End Users

6.2 Porter’s Five Forces Model

6.2.1 Threat Of New Entrants

6.2.2 Bargaining Power Of Suppliers

6.2.3 Bargaining Power Of Buyers

6.2.4 Threat Of Substitutes

6.2.5 Intensity Of Rivalry

7 Global 3D Machine Vision Market, By Component

7.1 Hardware

7.1.1 Camera

7.1.2 Communication Device

7.1.3 Control Cabinet

7.1.4 Others

7.2 Software

8 Global 3D Machine Vision Market, By Product

8.1 Smart-Camera Based

8.2 PC-Based

9 Global 3D Machine Vision Market, By Application

9.1 Inspection

9.2 Gauging

9.3 Guidance

9.4 Identification

10 Global 3D Machine Vision Market, By End User

10.1 Automotive

10.2 Semiconductor

10.3 Consumer Electronics

10.4 Healthcare

10.5 Food And Packaging

10.6 Others

11 Global 3D Machine Vision Market, By Region

11.1 Market Estimates And Forecast, By Region, 2023–2030

11.2 North America

11.2.1 Market Estimates And Forecast, By Country, 2023–2030

11.2.2 Market Estimates And Forecast, By Component, 2023–2030

11.2.3 Market Estimates And Forecast, By Product, 2023–2030

11.2.4 Market Estimates And Forecast, By Application, 2023–2030

11.2.5 Market Estimates And Forecast, By End User, 2023–2030

11.2.6 US

11.2.6.1 Market Estimates And Forecast, By Component, 2023–2030

11.2.6.2 Market Estimates And Forecast, By Product, 2023–2030

11.2.6.3 Market Estimates And Forecast, By Application, 2023–2030

11.2.6.4 Market Estimates And Forecast, By End User, 2023–2030

11.2.7 Canada

11.2.7.1 Market Estimates And Forecast, By Component, 2023–2030

11.2.7.2 Market Estimates And Forecast, By Product, 2023–2030

11.2.7.3 Market Estimates And Forecast, By Application, 2023–2030

11.2.7.4 Market Estimates And Forecast, By End User, 2023–2030

11.2.8 Mexico

11.2.8.1 Market Estimates And Forecast, By Component, 2023–2030

11.2.8.2 Market Estimates And Forecast, By Product, 2023–2030

11.2.8.3 Market Estimates And Forecast, By Application, 2023–2030

11.2.8.4 Market Estimates And Forecast, By End User, 2023–2030

11.3 Europe

11.3.1 Market Estimates And Forecast, By Country, 2023–2030

11.3.2 Market Estimates And Forecast, By Component, 2023–2030

11.3.3 Market Estimates And Forecast, By Product, 2023–2030

11.3.4 Market Estimates And Forecast, By Application, 2023–2030

11.3.5 Market Estimates And Forecast, By End User, 2023–2030

11.3.6 UK

11.3.6.1 Market Estimates And Forecast, By Component, 2023–2030

11.3.6.2 Market Estimates And Forecast, By Product, 2023–2030

11.3.6.3 Market Estimates And Forecast, By Application, 2023–2030

11.3.6.4 Market Estimates And Forecast, By End User, 2023–2030

11.3.7 Germany

11.3.7.1 Market Estimates And Forecast, By Component, 2023–2030

11.3.7.2 Market Estimates And Forecast, By Product, 2023–2030

11.3.7.3 Market Estimates And Forecast, By Application, 2023–2030

11.3.7.4 Market Estimates And Forecast, By End User, 2023–2030

11.3.8 France

11.3.8.1 Market Estimates And Forecast, By Component, 2023–2030

11.3.8.2 Market Estimates And Forecast, By Product, 2023–2030

11.3.8.3 Market Estimates And Forecast, By Application, 2023–2030

11.3.8.4 Market Estimates And Forecast, By End User, 2023–2030

11.3.9 Rest Of Europe

11.3.9.1 Market Estimates And Forecast, By Component, 2023–2030

11.3.9.2 Market Estimates And Forecast, By Product, 2023–2030

11.3.9.3 Market Estimates And Forecast, By Application, 2023–2030

11.3.9.4 Market Estimates And Forecast, By End User, 2023–2030

11.4 Asia-Pacific

11.4.1 Market Estimates And Forecast, By Country, 2023–2030

11.4.2 Market Estimates And Forecast, By Component, 2023–2030

11.4.3 Market Estimates And Forecast, By Product, 2023–2030

11.4.4 Market Estimates And Forecast, By Application, 2023–2030

11.4.5 Market Estimates And Forecast, By End User, 2023–2030

11.4.6 China

11.4.6.1 Market Estimates And Forecast, By Product, 2023–2030

11.4.6.2 Market Estimates And Forecast, By Application, 2023–2030

11.4.6.3 Market Estimates And Forecast, By End User, 2023–2030

11.4.7 Japan

11.4.7.1 Market Estimates And Forecast, By Component, 2023–2030

11.4.7.2 Market Estimates And Forecast, By Product, 2023–2030

11.4.7.3 Market Estimates And Forecast, By Application, 2023–2030

11.4.7.4 Market Estimates And Forecast, By End User, 2023–2030

11.4.8 India

11.4.8.1 Market Estimates And Forecast, By Component, 2023–2030

11.4.8.2 Market Estimates And Forecast, By Product, 2023–2030

11.4.8.3 Market Estimates And Forecast, By Application, 2023–2030

11.4.8.4 Market Estimates And Forecast, By End User, 2023–2030

11.4.9 Rest Of Asia-Pacific

11.4.9.1 Market Estimates And Forecast, By Component, 2023–2030

11.4.9.2 Market Estimates And Forecast, By Product, 2023–2030

11.4.9.3 Market Estimates And Forecast, By Application, 2023–2030

11.4.9.4 Market Estimates And Forecast, By End User, 2023–2030

11.5 Rest Of The World

11.5.1 Market Estimates And Forecast, By Country, 2023–2030

11.5.2 Market Estimates And Forecast, By Component, 2023–2030

11.5.3 Market Estimates And Forecast, By Product, 2023–2030

11.5.4 Market Estimates And Forecast, By Application, 2023–2030

11.5.5 Market Estimates And Forecast, By End User, 2023–2030

11.5.6 Middle East And Africa

11.5.6.1 Market Estimates And Forecast, By Component, 2023–2030

11.5.6.2 Market Estimates And Forecast, By Product, 2023–2030

11.5.6.3 Market Estimates And Forecast, By Application, 2023–2030

11.5.6.4 Market Estimates And Forecast, By End User, 2023–2030

11.5.7 South America

11.5.7.1 Market Estimates And Forecast, By Component, 2023–2030

11.5.7.2 Market Estimates And Forecast, By Product, 2023–2030

11.5.7.3 Market Estimates And Forecast, By Application, 2023–2030

11.5.7.4 Market Estimates And Forecast, By End User, 2023–2030

12 Competitive Landscape

12.1 Competitive Overview

12.2 Competitive Benchmarking Of The 3D Machine Vision Market

13 Company Profiles

13.1 OMRON Corporation

13.1.1 Company Overview

13.1.2 Financial Overview

13.1.3 Products/Services/Solutions Offered

13.1.4 Key Developments

13.1.5 SWOT Analysis

13.1.6 Key Strategies

13.2 Canon Inc.

13.2.1 Company Overview

13.2.2 Financial Overview

13.2.3 Products/Services/Solutions Offered

13.2.4 Key Developments

13.2.5 SWOT Analysis

13.2.6 Key Strategies

13.3 Cognex Corporation

13.3.1 Company Overview

13.3.2 Financial Overview

13.3.3 Products/Services/Solutions Offered

13.3.4 Key Developments

13.3.5 SWOT Analysis

13.3.6 Key Strategies

13.4 National Instruments

13.4.1 Company Overview

13.4.2 Financial Overview

13.4.3 Products/Services/Solutions Offered

13.4.4 Key Developments

13.4.5 SWOT Analysis

13.4.6 Key Strategies

13.5 Keyence Corporation

13.5.1 Company Overview

13.5.2 Financial Overview

13.5.3 Products/Services/Solutions Offered

13.5.4 Key Developments

13.5.5 SWOT Analysis

13.5.6 Key Strategies

13.6 Robotic Vision Technologies, Inc.

13.6.1 Company Overview

13.6.2 Financial Overview

13.6.3 Products/Services/Solutions Offered

13.6.4 Key Developments

13.7 Sony Corporation

13.7.1 Company Overview

13.7.2 Financial Overview

13.7.3 Products/Services/Solutions Offered

13.7.4 Key Developments

13.7.5 SWOT Analysis

13.7.6 Key Strategies

13.8 Coherent, Inc.

13.8.1 Company Overview

13.8.2 Financial Overview

13.8.3 Products/Services/Solutions Offered

13.8.4 Key Developments

13.9 Hermary Opto Electronics Inc.

13.9.1 Company Overview

13.9.2 Financial Overview

13.9.3 Products/Services/Solutions Offered

13.9.4 Key Developments

13.10 Basler AG

13.10.1 Company Overview

13.10.2 Financial Overview

13.10.3 Products/Services/Solutions Offered

13.10.4 Key Developments

14 List Of Tables

TABLE 1 LIST OF ASSUMPTIONS

TABLE 2 GLOBAL 3D MACHINE VISION MARKET, BY COMPONENT, 2023–2030 (USD MILLION)

TABLE 3 GLOBAL 3D MACHINE VISION MARKET, BY HARDWARE, 2023–2030 (USD MILLION)

TABLE 4 GLOBAL 3D MACHINE VISION MARKET, BY PRODUCT, 2023–2030 (USD MILLION)

TABLE 5 GLOBAL 3D MACHINE VISION MARKET, BY APPLICATION, 2023–2030 (USD MILLION)

TABLE 6 GLOBAL 3D MACHINE VISION MARKET, BY END USER, 2023–2030 (USD MILLION)

TABLE 7 GLOBAL 3D MACHINE VISION MARKET, BY REGION, 2023–2030 (USD MILLION)

TABLE 8 NORTH AMERICA: 3D MACHINE VISION MARKET, BY COUNTRY, 2023–2030 (USD MILLION)

TABLE 9 NORTH AMERICA: 3D MACHINE VISION MARKET, BY COMPONENT, 2023–2030 (USD MILLION)

TABLE 10 NORTH AMERICA: 3D MACHINE VISION MARKET, BY HARDWARE, 2023–2030 (USD MILLION)

TABLE 11 NORTH AMERICA: 3D MACHINE VISION MARKET, BY PRODUCT, 2023–2030 (USD MILLION)

TABLE 12 NORTH AMERICA: 3D MACHINE VISION MARKET, BY APPLICATION, 2023–2030 (USD MILLION)

TABLE 13 NORTH AMERICA: 3D MACHINE VISION MARKET, BY END USER, 2023–2030 (USD MILLION)

TABLE 14 US: 3D MACHINE VISION MARKET, BY COMPONENT, 2023–2030 (USD MILLION)

TABLE 15 US: 3D MACHINE VISION MARKET, BY HARDWARE, 2023–2030 (USD MILLION)

TABLE 16 US: 3D MACHINE VISION MARKET, BY PRODUCT, 2023–2030 (USD MILLION)

TABLE 17 US: 3D MACHINE VISION MARKET, BY APPLICATION, 2023–2030 (USD MILLION)

TABLE 18 US: 3D MACHINE VISION MARKET, BY END USER, 2023–2030 (USD MILLION)

TABLE 19 CANADA: 3D MACHINE VISION MARKET, BY COMPONENT, 2023–2030 (USD MILLION)

TABLE 20 CANADA: 3D MACHINE VISION MARKET, BY HARDWARE, 2023–2030 (USD MILLION)

TABLE 21 CANADA: 3D MACHINE VISION MARKET, BY PRODUCT, 2023–2030 (USD MILLION)

TABLE 22 CANADA: 3D MACHINE VISION MARKET, BY APPLICATION, 2023–2030 (USD MILLION)

TABLE 23 CANADA: 3D MACHINE VISION MARKET, BY END USER, 2023–2030 (USD MILLION)

TABLE 24 MEXICO: 3D MACHINE VISION MARKET, BY COMPONENT, 2023–2030 (USD MILLION)

TABLE 25 MEXICO: 3D MACHINE VISION MARKET, BY HARDWARE, 2023–2030 (USD MILLION)

TABLE 26 MEXICO: 3D MACHINE VISION MARKET, BY PRODUCT, 2023–2030 (USD MILLION)

TABLE 27 MEXICO: 3D MACHINE VISION MARKET, BY APPLICATION, 2023–2030 (USD MILLION)

TABLE 28 MEXICO: 3D MACHINE VISION MARKET, BY END USER, 2023–2030 (USD MILLION)

TABLE 29 EUROPE: 3D MACHINE VISION MARKET, BY COUNTRY, 2023–2030 (USD MILLION)

TABLE 30 EUROPE: 3D MACHINE VISION MARKET, BY COMPONENT, 2023–2030 (USD MILLION)

TABLE 31 EUROPE: 3D MACHINE VISION MARKET, BY HARDWARE, 2023–2030 (USD MILLION)

TABLE 32 EUROPE: 3D MACHINE VISION MARKET, BY PRODUCT, 2023–2030 (USD MILLION)

TABLE 33 EUROPE: 3D MACHINE VISION MARKET, BY APPLICATION, 2023–2030 (USD MILLION)

TABLE 34 EUROPE: 3D MACHINE VISION MARKET, BY END USER, 2023–2030 (USD MILLION)

TABLE 35 UK: 3D MACHINE VISION MARKET, BY COMPONENT, 2023–2030 (USD MILLION)

TABLE 36 UK: 3D MACHINE VISION MARKET, BY HARDWARE, 2023–2030 (USD MILLION)

TABLE 37 UK: 3D MACHINE VISION MARKET, BY PRODUCT, 2023–2030 (USD MILLION)

TABLE 38 UK: 3D MACHINE VISION MARKET, BY APPLICATION, 2023–2030 (USD MILLION)

TABLE 39 UK: 3D MACHINE VISION MARKET, BY END USER, 2023–2030 (USD MILLION)

TABLE 40 GERMANY: 3D MACHINE VISION MARKET, BY COMPONENT, 2023–2030 (USD MILLION)

TABLE 41 GERMANY: 3D MACHINE VISION MARKET, BY HARDWARE, 2023–2030 (USD MILLION)

TABLE 42 GERMANY: 3D MACHINE VISION MARKET, BY PRODUCT, 2023–2030 (USD MILLION)

TABLE 43 GERMANY: 3D MACHINE VISION MARKET, BY APPLICATION, 2023–2030 (USD MILLION)

TABLE 44 GERMANY: 3D MACHINE VISION MARKET, BY END USER, 2023–2030 (USD MILLION)

TABLE 45 FRANCE: 3D MACHINE VISION MARKET, BY COMPONENT, 2023–2030 (USD MILLION)

TABLE 46 FRANCE: 3D MACHINE VISION MARKET, BY HARDWARE, 2023–2030 (USD MILLION)

TABLE 47 FRANCE: 3D MACHINE VISION MARKET, BY PRODUCT, 2023–2030 (USD MILLION)

TABLE 48 FRANCE: 3D MACHINE VISION MARKET, BY APPLICATION, 2023–2030 (USD MILLION)

TABLE 49 FRANCE: 3D MACHINE VISION MARKET, BY END USER, 2023–2030 (USD MILLION)

TABLE 50 REST OF EUROPE: 3D MACHINE VISION MARKET, BY COMPONENT, 2023–2030 (USD MILLION)

TABLE 51 REST OF EUROPE: 3D MACHINE VISION MARKET, BY HARDWARE, 2023–2030 (USD MILLION)

TABLE 52 REST OF EUROPE: 3D MACHINE VISION MARKET, BY PRODUCT, 2023–2030 (USD MILLION)

TABLE 53 REST OF EUROPE: 3D MACHINE VISION MARKET, BY APPLICATION, 2023–2030 (USD MILLION)

TABLE 54 REST OF EUROPE: 3D MACHINE VISION MARKET, BY END USER, 2023–2030 (USD MILLION)

TABLE 55 ASIA-PACIFIC: 3D MACHINE VISION MARKET, BY COUNTRY, 2023–2030 (USD MILLION)

TABLE 56 ASIA-PACIFIC: 3D MACHINE VISION MARKET, BY COMPONENT, 2023–2030 (USD MILLION)

TABLE 57 ASIA-PACIFIC: 3D MACHINE VISION MARKET, BY HARDWARE, 2023–2030 (USD MILLION)

TABLE 58 ASIA-PACIFIC: 3D MACHINE VISION MARKET, BY PRODUCT, 2023–2030 (USD MILLION)

TABLE 59 ASIA-PACIFIC: 3D MACHINE VISION MARKET, BY APPLICATION, 2023–2030 (USD MILLION)

TABLE 60 ASIA-PACIFIC: 3D MACHINE VISION MARKET, BY END USER, 2023–2030 (USD MILLION)

TABLE 61 CHINA: 3D MACHINE VISION MARKET, BY COMPONENT, 2023–2030 (USD MILLION)

TABLE 62 CHINA: 3D MACHINE VISION MARKET, BY HARDWARE, 2023–2030 (USD MILLION)

TABLE 63 CHINA: 3D MACHINE VISION MARKET, BY PRODUCT, 2023–2030 (USD MILLION)

TABLE 64 CHINA: 3D MACHINE VISION MARKET, BY APPLICATION, 2023–2030 (USD MILLION)

TABLE 65 CHINA: 3D MACHINE VISION MARKET, BY END USER, 2023–2030 (USD MILLION)

TABLE 66 JAPAN: 3D MACHINE VISION MARKET, BY COMPONENT, 2023–2030 (USD MILLION)

TABLE 67 JAPAN: 3D MACHINE VISION MARKET, BY HARDWARE, 2023–2030 (USD MILLION)

TABLE 68 JAPAN: 3D MACHINE VISION MARKET, BY PRODUCT, 2023–2030 (USD MILLION)

TABLE 69 JAPAN: 3D MACHINE VISION MARKET, BY APPLICATION, 2023–2030 (USD MILLION)

TABLE 70 JAPAN: 3D MACHINE VISION MARKET, BY END USER, 2023–2030 (USD MILLION)

TABLE 71 INDIA: 3D MACHINE VISION MARKET, BY COMPONENT, 2023–2030 (USD MILLION)

TABLE 72 INDIA: 3D MACHINE VISION MARKET, BY HARDWARE, 2023–2030 (USD MILLION)

TABLE 73 INDIA: 3D MACHINE VISION MARKET, BY PRODUCT, 2023–2030 (USD MILLION)

TABLE 74 INDIA: 3D MACHINE VISION MARKET, BY APPLICATION, 2023–2030 (USD MILLION)

TABLE 75 INDIA: 3D MACHINE VISION MARKET, BY END USER, 2023–2030 (USD MILLION)

TABLE 76 REST OF ASIA-PACIFIC: 3D MACHINE VISION MARKET, BY COMPONENT, 2023–2030 (USD MILLION)

TABLE 77 REST OF ASIA-PACIFIC: 3D MACHINE VISION MARKET, BY HARDWARE, 2023–2030 (USD MILLION)

TABLE 78 REST OF ASIA-PACIFIC: 3D MACHINE VISION MARKET, BY PRODUCT, 2023–2030 (USD MILLION)

TABLE 79 REST OF ASIA-PACIFIC: 3D MACHINE VISION MARKET, BY APPLICATION, 2023–2030 (USD MILLION)

TABLE 80 REST OF ASIA-PACIFIC: 3D MACHINE VISION MARKET, BY END USER, 2023–2030 (USD MILLION)

TABLE 81 REST OF THE WORLD: 3D MACHINE VISION MARKET, BY COUNTRY, 2023–2030 (USD MILLION)

TABLE 82 REST OF THE WORLD: 3D MACHINE VISION MARKET, BY COMPONENT, 2023–2030 (USD MILLION)

TABLE 83 REST OF THE WORLD: 3D MACHINE VISION MARKET, BY HARDWARE, 2023–2030 (USD MILLION)

TABLE 84 REST OF THE WORLD: 3D MACHINE VISION MARKET, BY PRODUCT, 2023–2030 (USD MILLION)

TABLE 85 REST OF THE WORLD: 3D MACHINE VISION MARKET, BY APPLICATION, 2023–2030 (USD MILLION)

TABLE 86 REST OF THE WORLD: 3D MACHINE VISION MARKET, BY END USER, 2023–2030 (USD MILLION)

TABLE 87 MIDDLE EAST AND AFRICA: 3D MACHINE VISION MARKET, BY COMPONENT, 2023–2030 (USD MILLION)

TABLE 88 MIDDLE EAST AND AFRICA: 3D MACHINE VISION MARKET, BY HARDWARE, 2023–2030 (USD MILLION)

TABLE 89 MIDDLE EAST AND AFRICA: 3D MACHINE VISION MARKET, BY PRODUCT, 2023–2030 (USD MILLION)

TABLE 90 MIDDLE EAST AND AFRICA: 3D MACHINE VISION MARKET, BY APPLICATION, 2023–2030 (USD MILLION)

TABLE 91 MIDDLE EAST AND AFRICA: 3D MACHINE VISION MARKET, BY END USER, 2023–2030 (USD MILLION)

TABLE 92 SOUTH AMERICA: 3D MACHINE VISION MARKET, BY COMPONENT, 2023–2030 (USD MILLION)

TABLE 93 SOUTH AMERICA: 3D MACHINE VISION MARKET, BY HARDWARE, 2023–2030 (USD MILLION)

TABLE 94 SOUTH AMERICA: 3D MACHINE VISION MARKET, BY PRODUCT, 2023–2030 (USD MILLION)

TABLE 95 SOUTH AMERICA: 3D MACHINE VISION MARKET, BY APPLICATION, 2023–2030 (USD MILLION)

TABLE 96 SOUTH AMERICA: 3D MACHINE VISION MARKET, BY END USER, 2023–2030 (USD MILLION)

TABLE 97 OMRON CORPORATION: PRODUCTS/SOLUTION/SERVICES OFFERED

TABLE 98 OMRON CORPORATION: KEY DEVELOPMENTS

TABLE 99 CANON INC.: PRODUCTS/SOLUTION/SERVICES OFFERED

TABLE 100 CANON INC.: KEY DEVELOPMENTS

TABLE 101 COGNEX CORPORATION: PRODUCTS/SOLUTION/SERVICES OFFERED

TABLE 102 COGNEX CORPORATION: KEY DEVELOPMENTS

TABLE 103 NATIONAL INSTRUMENTS: PRODUCTS/SOLUTION/SERVICES OFFERED

TABLE 104 KEYENCE CORPORATION: PRODUCTS/SOLUTION/SERVICES OFFERED

TABLE 105 ROBOTIC VISION TECHNOLOGIES, INC.: PRODUCTS/SOLUTION/SERVICES OFFERED

TABLE 106 SONY CORPORATION: PRODUCTS/SOLUTION/SERVICES OFFERED

TABLE 107 SONY CORPORATION: KEY DEVELOPMENTS

TABLE 108 COHERENT, INC.: PRODUCTS/SOLUTION/SERVICES OFFERED

TABLE 109 HERMARY OPTOELECTRONICS INC.: PRODUCTS/SOLUTION/SERVICES OFFERED

TABLE 110 BASLER AG: PRODUCTS/SOLUTION/SERVICES OFFERED

15 List Of Figures

FIGURE 1 MARKET SYNOPSIS

FIGURE 2 GLOBAL 3D MACHINE VISION MARKET SHARE, BY REGION, 2023 (%)

FIGURE 3 GLOBAL 3D MACHINE VISION MARKET: MARKET STRUCTURE

FIGURE 4 NORTH AMERICA: 3D MACHINE VISION MARKET, BY COUNTRY, 2023 VS 2030 (USD MILLION)

FIGURE 5 NORTH AMERICA: 3D MACHINE VISION MARKET SHARE, BY COUNTRY, 2023 VS 2030 (%)

FIGURE 6 EUROPE: 3D MACHINE VISION MARKET, BY COUNTRY, 2023 VS 2030 (USD MILLION)

FIGURE 7 EUROPE: 3D MACHINE VISION MARKET SHARE, BY COUNTRY, 2023 VS 2030 (%)

FIGURE 8 ASIA-PACIFIC: 3D MACHINE VISION MARKET, BY COUNTRY, 2023 VS 2030 (USD MILLION)

FIGURE 9 ASIA-PACIFIC: 3D MACHINE VISION MARKET SHARE, BY COUNTRY, 2023 VS 2030 (%)

FIGURE 10 REST OF THE WORLD: 3D MACHINE VISION MARKET, BY COUNTRY, 2023 VS 2030 (USD MILLION)

FIGURE 11 REST OF THE WORLD: 3D MACHINE VISION MARKET SHARE, BY COUNTRY, 2023 VS 2030 (%)

FIGURE 12 RESEARCH PROCESS OF MRFR

FIGURE 13 TOP DOWN & BOTTOM-UP APPROACH

FIGURE 14 MARKET DYNAMICS ANALYSIS OF GLOBAL 3D MACHINE VISION MARKET

FIGURE 15 VALUE CHAIN: GLOBAL 3D MACHINE VISION MARKET

FIGURE 17 GLOBAL 3D MACHINE VISION MARKET, BY COMPONENT, 2023 VS 2030 (USD MILLION)

FIGURE 18 GLOBAL 3D MACHINE VISION MARKET, BY HARDWARE, 2023 VS 2030 (USD MILLION)

FIGURE 19 GLOBAL 3D MACHINE VISION MARKET, BY PRODUCT, 2023 VS 2030 (USD MILLION)

FIGURE 20 GLOBAL 3D MACHINE VISION MARKET, BY APPLICATION, 2023 VS 2030 (USD MILLION)

FIGURE 21 GLOBAL 3D MACHINE VISION MARKET, BY END USER, 2023 VS 2030 (USD MILLION)

FIGURE 22 GLOBAL 3D MACHINE VISION MARKET, BY REGION, 2023 VS 2030 (USD MILLION)

FIGURE 23 NORTH AMERICA: 3D MACHINE VISION MARKET, BY COUNTRY, 2023 VS 2030 (USD MILLION)

FIGURE 24 NORTH AMERICA: 3D MACHINE VISION MARKET, BY COMPONENT, 2023 VS 2030 (USD MILLION)

FIGURE 25 NORTH AMERICA: 3D MACHINE VISION MARKET, BY HARDWARE, 2023 VS 2030 (USD MILLION)

FIGURE 26 NORTH AMERICA: 3D MACHINE VISION MARKET, BY PRODUCT, 2023 VS 2030 (USD MILLION)

FIGURE 27 NORTH AMERICA: 3D MACHINE VISION MARKET, BY APPLICATION, 2023 VS 2030 (USD MILLION)

FIGURE 28 NORTH AMERICA: 3D MACHINE VISION MARKET, BY END USER, 2023 VS 2030 (USD MILLION)

FIGURE 29 EUROPE: 3D MACHINE VISION MARKET, BY COUNTRY, 2023 VS 2030 (USD MILLION)

FIGURE 30 EUROPE: 3D MACHINE VISION MARKET, BY COMPONENT, 2023 VS 2030 (USD MILLION)

FIGURE 31 EUROPE: 3D MACHINE VISION MARKET, BY HARDWARE, 2023 VS 2030 (USD MILLION)

FIGURE 32 EUROPE: 3D MACHINE VISION MARKET, BY PRODUCT, 2023 VS 2030 (USD MILLION)

FIGURE 33 EUROPE: 3D MACHINE VISION MARKET, BY APPLICATION, 2023 VS 2030 (USD MILLION)

FIGURE 34 EUROPE: 3D MACHINE VISION MARKET, BY END USER, 2023 VS 2030 (USD MILLION)

FIGURE 35 ASIA-PACIFIC: 3D MACHINE VISION MARKET, BY COUNTRY, 2023 VS 2030 (USD MILLION)

FIGURE 36 ASIA-PACIFIC: 3D MACHINE VISION MARKET, BY COMPONENT, 2023 VS 2030 (USD MILLION)

FIGURE 37 ASIA-PACIFIC: 3D MACHINE VISION MARKET, BY HARDWARE, 2023 VS 2030 (USD MILLION)

FIGURE 38 ASIA-PACIFIC: 3D MACHINE VISION MARKET, BY PRODUCT, 2023 VS 2030 (USD MILLION)

FIGURE 39 ASIA-PACIFIC: 3D MACHINE VISION MARKET, BY APPLICATION, 2023 VS 2030 (USD MILLION)

FIGURE 40 ASIA-PACIFIC: 3D MACHINE VISION MARKET, BY END USER, 2023 VS 2030 (USD MILLION)

FIGURE 41 REST OF THE WORLD: 3D MACHINE VISION MARKET, BY COUNTRY, 2023 VS 2030 (USD MILLION)

FIGURE 42 REST OF THE WORLD: 3D MACHINE VISION MARKET, BY COMPONENT, 2023 VS 2030 (USD MILLION)

FIGURE 43 REST OF THE WORLD: 3D MACHINE VISION MARKET, BY HARDWARE, 2023 VS 2030 (USD MILLION)

FIGURE 44 REST OF THE WORLD: 3D MACHINE VISION MARKET, BY PRODUCT, 2023 VS 2030 (USD MILLION)

FIGURE 45 REST OF THE WORLD: 3D MACHINE VISION MARKET, BY APPLICATION, 2023 VS 2030 (USD MILLION)

FIGURE 46 REST OF THE WORLD: 3D MACHINE VISION MARKET, BY END USER, 2023 VS 2030 (USD MILLION)

FIGURE 47 MAJOR PLAYER MARKET SHARE, 2023 (%)

FIGURE 48 COMPETITIVE BENCHMARKING OF THE 3D MACHINE VISION MARKET

FIGURE 49 OMRON CORPORATION: FINANCIAL OVERVIEW SNAPSHOT

FIGURE 50 OMRON CORPORATION: SWOT ANALYSIS

FIGURE 51 CANON INC.: FINANCIAL OVERVIEW SNAPSHOT

FIGURE 52 CANON INC.: SWOT ANALYSIS

FIGURE 53 COGNEX CORPORATION: FINANCIAL OVERVIEW SNAPSHOT

FIGURE 54 COGNEX CORPORATION: SWOT ANALYSIS

FIGURE 55 NATIONAL INSTRUMENTS: FINANCIAL OVERVIEW SNAPSHOT

FIGURE 56 NATIONAL INSTRUMENTS: SWOT ANALYSIS

FIGURE 57 KEYENCE CORPORATION: FINANCIAL OVERVIEW SNAPSHOT

FIGURE 58 KEYENCE CORPORATION: SWOT ANALYSIS

FIGURE 59 SONY CORPORATION: FINANCIAL OVERVIEW SNAPSHOT

FIGURE 60 SONY CORPORATION: SWOT ANALYSIS

FIGURE 61 COHERENT, INC.: FINANCIAL OVERVIEW SNAPSHOT

FIGURE 62 BASLER AG: FINANCIAL OVERVIEW SNAPSHOT

Purchase Option
Single User $ 4,950
Multiuser License $ 5,950
Enterprise User $ 7,250
Compare Licenses
Tailored for You
  • Dedicated Research on any specifics segment or region.
  • Focused Research on specific players in the market.
  • Custom Report based only on your requirements.
  • Flexibility to add or subtract any chapter in the study.
  • Historic data from 2014 and forecasts outlook till 2040.
  • Flexibility of providing data/insights in formats (PDF, PPT, Excel).
  • Provide cross segmentation in applicable scenario/markets.