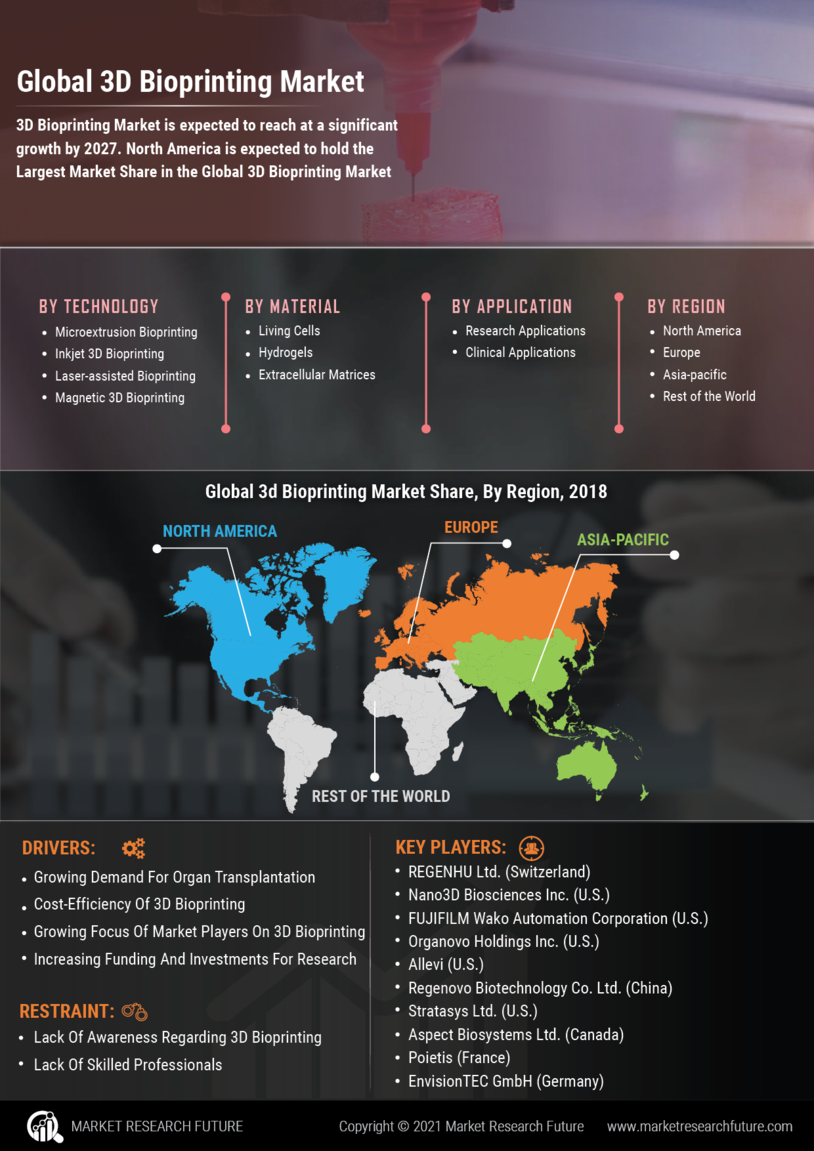
ID: MRFR/MED/0367-CR | January, 2019 | Region : Global
Global 3D Bioprinting Market share is projected to touch a value of USD 1,923.02 Million by 2023, states Market Research Future (MRFR) in its report. The market can display a CAGR of 24.59% during the forecast period due to its growing applications in tissue engineering and organ transplantation.
3D bioprinting encompasses an array of 3D printing methods to combine cells and biomaterials to produce biomedical parts. Although the technology is in high use for research and development purposes, its application in the production of tissues and organs is likely to garner high demand.
The prevailing pandemic, COVID-19, has generated the demand for companies to maintain a digital asset. In situations like these, the 3D printer aids to meet the requirement, which is expected to boost the 3D bioprinting market growth.
The cost-economical nature of 3D bioprinting is expected to brighten the bioprinting future. This is buttressed by the use of small implants and prosthetics used in the treatment of dental or craniofacial disorders. Furthermore, the presence of numerous players in the 3D bioprinting market can keep production costs low and augur well for the market in the forthcoming years.
However, lack of awareness of the technology and shortage of skilled professionals can act as growth deterrents in the market.
Drivers
Growing Demand for Organ Transplantation to Boost the Market
Growing demand for organ transplantation is projected to drive the market by 2023. The rising investments in 3D bioprinting via public and private means to widen its scope is likely to boost the market growth. Moreover, the cost-effectiveness of 3D bioprinted products is expected to develop the industry in the forecast timeframe.
Opportunities
Growing Application of 3D Bioprinting in Cosmetic Industry to Offer Lucrative Opportunities
The extensive usage of 3D bioprinting in the cosmetic industry is expected to offer various growth opportunities to the key players. The growing R&D, partnerships, and acquisitions are likely to augment the market in the coming period.
Restraints
Lack of Expertise to Hinder Market Growth
One of the major factors hindering the market growth is the lack of expertise and awareness is expected to obstruct the market growth during the forecast period.
Challenges
Socioethical Concerns Due to the usage of 3D Bioprinted products
The application of bioprinted products inside human bodies can grow biosafety concerns, which may also question some religious beliefs that can hinder the market growth. In addition, the concerns associated with waste elimination is expected to further restrict the market growth.
Cumulative Growth Analysis
Market is Expected to Grow Significantly in the Forecast Period
The market is anticipated to grow significantly in the coming period, at a rapid pace. The on-going technical development, the growing awareness, and the increasing 3D bioprinting applications are predicted to underpin the trade expansion at a global front.
The 3D bioprinting market is segmented by technology, material, application, and end-user.
By Technology
Inkjet 3D Bioprinting Segment to Exhibit Higher CAGR
Based on technology, the global market for 3D bioprinting is segmented into inkjet 3D bioprinting, microextrusion bioprinting, magnetic 3D bioprinting, and laser-assisted bioprinting. Among all, the microextrusion bioprinting segment is projected to witness a CAGR of 25.24% during the forecast period. This can be attributed to its growing applications in bioprinting. On the other hand, inkjet 3D bioprinting can exhibit 26.44% CAGR owing to being a viable alternative for scaffold fabrication.
By Material
Hydrogels to Thrive at a CAGR of 26.63% by 2023
By material, the global market for 3D bioprinting is segmented into living cells, extracellular matrices, and hydrogels. The hydrogels segment is expected to generate USD 652.54 million by 2023 at a CAGR of 26.63% during the forecast period.
By Applications
Research Applications Segment to Exhibit Higher CAGR due to its Growing Application in Regenerative Medicines
Based on applications, the global market for 3D Bioprinting market is segmented into research and clinical applications. The research applications segment is expected to exhibit a CAGR of 24.74% by 2023 owing to applications in 3D cell culture and regenerative medicine. The clinical applications segment is likely to hold the market value of USD 507.55 million by 2023 while expanding at a CAGR of 24.19% during the assessment period.
By End-Users
Pharmaceutical & Biotechnology Segment to Grow Due to Growing Demand for Personalized Medicines
Among end-users, the global market for 3D bioprinting market is segmented into pharmaceutical & biotechnology companies and research organizations & academic institutes. Pharmaceutical & biotechnology companies are projected to display a CAGR of 24.98% till 2023 owing to the trend in personalized medicines.
North America is expected to hold the Largest Market Share in the Global 3D Bioprinting Market
As per the 3D bioprinting industry analysis conducted by MRFR, the Americas is expected to acquire the market value of USD 689.91 million by 2023. This can be attributed to growing investments in research and development and the presence of advanced healthcare infrastructure. The demand for organ transplant is likely to rise to grow the regional market in the coming period. In addition, the on-going development of 3D printed pills, which can be customized as per the person’s age and body weight, is expected to offer various opportunities for expansion for the 3D bioprinting market.
The APAC is projected to acquire the market value of USD 507.18 million by 2023 at a CAGR of 27.25% during the forecast period. The APAC region is anticipated to grow at a rapid pace due to the development in 3D printing, incorporation of the latest technologies in the healthcare sector, and abundance of opportunities. In addition, increasing government funding to accelerate the pace of 3D printing technology is projected to augment the 3D bioprinting market size.
The Europe 3D bioprinting market is expected to acquire a market value of USD 649.91 million by 2023 due to the rising focus on health and wellness. Increased demand for cosmetic surgery can play a salient role in the market’s progress in the region. Furthermore, agreements between established players to expedite the evolution of technology can net novel results. This is exemplified by the deal signed between BASF SE and Poietis to improve skincare products by the former.
Growing Initiatives to Expand Customer Base to Grow Competition
The growing collaboration and rising partnerships among key players is expected to strengthen the competitiveness of the global market for 3D bioprinting. The renowned players of the market are taking initiatives to grow their consumer base by incorporating innovation in their products.
Industry News
November 2020
Professor of Biomedical Engineering Adam Feinberg and his team have built the first-ever full-size 3D bioprinted human heart model with the usage of Freeform Reversible Embedding of Suspended Hydrogels (FRESH) technique.
Key Players
Report Overview
The 3D bioprinting market is expected to expand significantly during the forecast period owing to the rapid advancement in healthcare.
Global 3D Bioprinting Market - Summary
Overview
The global 3D bioprinting market is poised to touch a size of USD 1,923.02 million by 2023. It is predicted to exhibit a CAGR of 24.59% during the forecast period. Growing demand for organ transplantation is expected to spur the market growth till 2023. Rising incidence of organ failure due to aging, accidents, and diseases have created a gap for functioning organs. 3D bioprinting can close the gap by producing them on a massive scale.
The cost-effective nature of the technology is projected to drive the market demand. Opportunities in manufacturing pills in the pharmaceutical industry as well as producing implants and prosthetics can augur well for the market.
Rise in investments for research and development to widen the scope of the technology can contribute to market growth. Funding by venture private and public firms can facilitate in its growth. In addition, partnerships between firms have been known to boost market growth. For instance, Organovo Holdings entered into a multi-year agreement with Merck in 2015. It allowed the latter to gain access to the latter’s bioprinting platform to develop customized tissue models.
Industry Opportunity
Entry of various startup companies such as Nano 3D Bioscience and Cyfuse Biomedical in the industry is expected to open up new avenues for expansion. Prominent companies can gain entry by acquiring small and medium startups and gain an enviable position in the market.
Segmentation Analysis
Technologies in the 3D bioprinting market include laser-assisted bioprinting, magnetic 3D bioprinting, inkjet 3D bioprinting, and microextrusion bioprinting. Microextrusion bioprinting is increasingly being used by researchers as an alternative to scaffold fabrication. Moreover, the technique offers high cell densities owing to the use of bioinks to mimic matrices is likely to propel its growth. Inkjet 3D bioprinting is also expected to command a significant market share owing to its compatibility with living cells.
By material, the market is segmented into extracellular matrices, living cells, hydrogels, and others. Living cells hold a significant market share owing to its manufacture using in-air microfluidics. Their application in repairing damaged tissues coupled with their compatibility with biomaterials to form damaged microstructures is likely to augur well for the segment. Hydrogels, on the other hand, are also in high demand in the 3D bioprinting market owing to their manufacture using synthetic or natural materials.
By application, the market is segmented into clinical and research applications. Clinical applications can command a high market demand thanks to organ transplantation. The shortage of organs can ample scope for the market to expand its horizons through this application, Research applications can contribute to the 3D bioprinting market revenue owing to the emerging field of regenerative medicine.
By end-user, the 3D bioprinting market is segmented into research organizations & academic institutes and pharmaceutical & biotechnology companies. Pharmaceutical & biotechnology companies are increasingly leaning towards the technology to cater to the demands of patients. Emergence of personalized medicine can offer scope for the end-user to generate revenue for the market. Research organizations & academic institutes are receiving grants to expedite the development of 3D bioprinting which can expand its purview in other sectors.
Regional Analysis
Geographic segmentation of the 3D bioprinting market is focused on the following regions - Americas, Europe, Asia Pacific (APAC), and the Middle East & Africa (MEA).
The Americas held the largest market share in 2017 owing to a noticeable rise in research and development (R&D) activities, development of healthcare infrastructure, large patient pool, and increased budget for healthcare in the U.S. and Canada.
The Europe held a substantial market share thanks to investment in 3D printing and their high demand in France, the U.K., and Germany. In addition, the application of the technology in the cosmetic industry coupled with the ban on animal testing are factors which can provide headroom for the 3D bioprinting market to thrive in the region.
The APAC region can experience the highest CAGR owing to the developing healthcare sector in China, collaborations among prominent companies to set up units, and increased funding for R&D. In addition, government initiatives
Competitive Landscape
Top players in the 3D bioprinting market include Organovo Holdings Inc. (U.S.), FUJIFILM Wako Automation Corporation (U.S.), Regenovo Biotechnology Co. Ltd. (China), REGENHU Ltd. (Switzerland), Allevi (U.S.), Cellink AB (Sweden), Cyfuse Biomedical K.K. (Japan), Nano3D Biosciences Inc. (U.S.), Stratasys Ltd. (U.S.), EnvisionTEC GmbH (Germany), Aspect Biosystems Ltd. (Canada), and Poietis (France).
1 Report Prologue
2 Executive Summary
3 Market Introduction
3.1 Definition 20
3.2 Scope of the Study 20
3.3 Research Objective 20
3.4 Assumptions & Limitations 20
3.4.1 Assumptions 20
3.4.2 Limitations 20
3.5 Market Structure 21
3.6 Research Process 21
4 Research Methodology
4.1 Primary Research 24
4.2 Secondary Research 25
4.3 Market Size Estimation 26
4.4 Forecast Model 26
5 Market Dynamics
5.1 Introduction 28
5.2 Drivers 28
5.2.1 Growing Demand for Organ Transplantation 28
5.2.2 Cost-Efficiency of 3D Bioprinting 28
5.2.3 Growing Focus of Market Players on 3D Bioprinting 29
5.2.4 Increasing Funding and Investments for Research 29
5.3 Restraints 29
5.3.1 Lack of Awareness Regarding 3D Bioprinting 29
5.3.2 Lack of Skilled Professionals 29
5.4 Opportunities 30
5.4.1 Dominance of Start-Ups 30
6 Market Factor Analysis
6.1 Porter’s Five Forces Model 32
6.1.1 Bargaining Power of Suppliers 32
6.1.2 Bargaining Power of Buyers 33
6.1.3 Threat of New Entrants 33
6.1.4 Threat of Substitutes 33
6.1.5 Rivalry 33
6.2 Supply Chain Analysis 34
6.2.1 R&D and Development 34
6.2.2 Manufacturing 34
6.2.3 Distribution & Sales 34
6.2.4 Post-Sales Monitoring 35
6.3 Investment Feasibility Analysis 35
6.4 Pricing Analysis 35
7 3D Bioprinting Market, by Technology
7.1 Introduction 37
7.2 Microextrusion Bioprinting 38
7.3 Inkjet 3D bioprinting 39
7.4 Laser-Assisted Bioprinting 39
7.5 Magnetic 3D Bioprinting 40
8 3D Bioprinting Market, by Material
8.1 Introduction 42
8.2 Living Cells 43
8.3 Hydrogels 44
8.4 Extracellular Matrices 44
9 3D Bioprinting Market, by Application
9.1 Introduction 47
9.2 Research Applications 48
9.3 Clinical Applications 51
10 3D Bioprinting Market, by End User
10.1 Introduction 54
10.2 Pharmaceutical & Biotechnology Companies 55
10.3 Research Organizations & Academic Institutes 56
11 Global 3D Bioprinting Market, by Region
11.1 Introduction 58
11.2 Americas 60
3D Bioprinting Market, by Technology
3D Bioprinting Market, by Material
3D Bioprinting Market, by Application
3D Bioprinting Market, by End User
11.2.1 North America 63
3D Bioprinting Market, by Technology
3D Bioprinting Market, by Material
3D Bioprinting Market, by Application
3D Bioprinting Market, by End User
11.2.1.1 US 67
3D Bioprinting Market, by Technology
3D Bioprinting Market, by Material
3D Bioprinting Market, by Application
3D Bioprinting Market, by End User
11.2.1.2 Canada 69
3D Bioprinting Market, by Technology
3D Bioprinting Market, by Material
3D Bioprinting Market, by Application
3D Bioprinting Market, by End User
11.2.2 South America 72
3D Bioprinting Market, by Technology
3D Bioprinting Market, by Material
3D Bioprinting Market, by Application
3D Bioprinting Market, by End User
11.3 Europe 75
3D Bioprinting Market, by Technology
3D Bioprinting Market, by Material
3D Bioprinting Market, by Application
3D Bioprinting Market, by End User
11.3.1 Western Europe 79
3D Bioprinting Market, by Technology
3D Bioprinting Market, by Material
3D Bioprinting Market, by Application
3D Bioprinting Market, by End User
11.3.1.1 Germany 83
3D Bioprinting Market, by Technology
3D Bioprinting Market, by Material
3D Bioprinting Market, by Application
3D Bioprinting Market, by End User
11.3.1.2 France 85
3D Bioprinting Market, by Technology
3D Bioprinting Market, by Material
3D Bioprinting Market, by Application
3D Bioprinting Market, by End User
11.3.1.3 U.K 88
3D Bioprinting Market, by Technology
3D Bioprinting Market, by Material
3D Bioprinting Market, by Application
3D Bioprinting Market, by End User
11.3.1.4 Italy 90
3D Bioprinting Market, by Technology
3D Bioprinting Market, by Material
3D Bioprinting Market, by Application
3D Bioprinting Market, by End User
11.3.1.5 Spain 93
3D Bioprinting Market, by Technology
3D Bioprinting Market, by Material
3D Bioprinting Market, by Application
3D Bioprinting Market, by End User
11.3.1.6 Rest of Western Europe 95
3D Bioprinting Market, by Technology
3D Bioprinting Market, by Material
3D Bioprinting Market, by Application
3D Bioprinting Market, by End User
11.3.2 Eastern Europe 98
3D Bioprinting Market, by Technology
3D Bioprinting Market, by Material
3D Bioprinting Market, by Application
3D Bioprinting Market, by End User
11.4 Asia-Pacific 101
3D Bioprinting Market, by Technology
3D Bioprinting Market, by Material
3D Bioprinting Market, by Application
3D Bioprinting Market, by End User
11.4.1 Japan 105
3D Bioprinting Market, by Technology
3D Bioprinting Market, by Material
3D Bioprinting Market, by Application
3D Bioprinting Market, by End User
11.4.2 China 108
3D Bioprinting Market, by Technology
3D Bioprinting Market, by Material
3D Bioprinting Market, by Application
3D Bioprinting Market, by End User
11.4.3 India 111
3D Bioprinting Market, by Technology
3D Bioprinting Market, by Material
3D Bioprinting Market, by Application
3D Bioprinting Market, by End User
11.4.4 Australia 114
3D Bioprinting Market, by Technology
3D Bioprinting Market, by Material
3D Bioprinting Market, by Application
3D Bioprinting Market, by End User
11.4.5 South Korea 116
3D Bioprinting Market, by Technology
3D Bioprinting Market, by Material
3D Bioprinting Market, by Application
3D Bioprinting Market, by End User
11.4.6 Rest of Asia–Pacific 119
3D Bioprinting Market, by Technology
3D Bioprinting Market, by Material
3D Bioprinting Market, by Application
3D Bioprinting Market, by End User
11.5 Middle East and Africa 122
3D Bioprinting Market, by Technology
3D Bioprinting Market, by Material
3D Bioprinting Market, by Application
3D Bioprinting Market, by End User
11.5.1 Middle East 126
3D Bioprinting Market, by Technology
3D Bioprinting Market, by Material
3D Bioprinting Market, by Application
3D Bioprinting Market, by End User
11.5.2 Africa 129
3D Bioprinting Market, by Technology
3D Bioprinting Market, by Material
3D Bioprinting Market, by Application
3D Bioprinting Market, by End User
12 Competitive Landscape
12.1 Introduction 133
12.2 Company Ranking 133
13 Company Profiles
13.1 Organovo Holdings Inc. 135
13.1.1 Company Overview 135
13.1.2 Financial Overview 135
13.1.3 Products/Services Offered 136
13.1.4 Key Developments 136
13.1.5 SWOT Analysis 136
13.1.6 Key Strategy 136
13.2 Cellink AB 137
13.2.1 Company Overview 137
13.2.2 Financial Overview 137
13.2.3 Products/Services Offered 138
13.2.4 Key Developments 138
13.2.5 SWOT Analysis 138
13.2.6 Key Strategy 139
13.3 Stratasys Ltd 140
13.3.1 Company Overview 140
13.3.2 Financial Overview 140
13.3.3 Products/Services Offered 141
13.3.4 Key Developments 141
13.3.5 SWOT Analysis 141
13.3.6 Key Strategy 141
13.4 FUJIFILM Wako Automation Corporation 142
13.4.1 Company Overview 142
13.4.2 Financial Overview 142
13.4.3 Products/Services Offered 143
13.4.4 Key Developments 143
13.4.5 SWOT Analysis 143
13.4.6 Key Strategy 143
13.5 Envisiontec GMBH 144
13.5.1 Company Overview 144
13.5.2 Financial Overview 144
13.5.3 Products/Services Offered 144
13.5.4 Key Developments 144
13.5.5 SWOT Analysis 145
13.5.6 Key Strategy 145
13.6 Nano3D Biosciences Inc. 146
13.6.1 Company Overview 146
13.6.2 Financial Overview 146
13.6.3 Products/Services Offered 146
13.6.4 Key Developments 146
13.6.5 SWOT Analysis 147
13.6.6 Key Strategy 147
13.7 Allevi 148
13.7.1 Company Overview 148
13.7.2 Financial Overview 148
13.7.3 Products/Services Offered 148
13.7.4 Key Developments 148
13.7.5 SWOT Analysis 149
13.7.6 Key Strategy 149
13.8 Cyfuse Biomedical K.K. 150
13.8.1 Company Overview 150
13.8.2 Financial Overview 150
13.8.3 Products/Services Offered 150
13.8.4 Key Developments 150
13.8.5 SWOT Analysis 150
13.8.6 Key Strategy 151
13.9 REGENHU LTD 152
13.9.1 Company Overview 152
13.9.2 Financial Overview 152
13.9.3 Products/Services Offered 152
13.9.4 Key Developments 152
13.9.5 SWOT Analysis 153
13.9.6 Key Strategy 153
13.10 Aspect Biosystems Ltd 154
13.10.1 Company Overview 154
13.10.2 Financial Overview 154
13.10.3 Products/Services Offered 154
13.10.4 Key Developments 154
13.10.5 SWOT Analysis 155
13.10.6 Key Strategy 155
13.11 Regenovo Biotechnology Co. Ltd. 156
13.11.1 Company Overview 156
13.11.2 Financial Overview 156
13.11.3 Products/Services Offered 156
13.11.4 Key Developments 156
13.11.5 SWOT Analysis 157
13.11.6 Key Strategy 157
13.12 Poietis 158
13.12.1 Company Overview 158
13.12.2 Financial Overview 158
13.12.3 Products/Services Offered 158
13.12.4 Key Developments 158
13.12.5 SWOT Analysis 159
13.12.6 Key Strategy 159
14 Appendix
14.1 Discussion Blue Print 161
15 List of Tables
TABLE 1 MARKET SYNOPSIS 18
TABLE 2 PRIMARY INTERVIEWS 22
TABLE 3 GLOBAL 3D BIOPRINTING MARKET BY TECHNOLOGY, 2020–2027 (USD MILLION) 38
TABLE 4 GLOBAL 3D BIOPRINTING MARKET FOR MICROEXTRUSION BIOPRINTING BY REGION, 2020–2027 (USD MILLION) 38
TABLE 5 GLOBAL 3D BIOPRINTING MARKET FOR INKJET 3D BIOPRINTING BY REGION, 2020–2027 (USD MILLION) 39
TABLE 6 GLOBAL 3D BIOPRINTING MARKET FOR LASER-ASSISTED BIOPRINTING BY REGION, 2020–2027 (USD MILLION) 40
TABLE 7 GLOBAL 3D BIOPRINTING MARKET FOR MAGNETIC 3D BIOPRINTING BY REGION, 2020–2027 (USD MILLION) 40
TABLE 8 GLOBAL 3D BIOPRINTING MARKET BY MATERIAL, 2020–2027 (USD MILLION) 43
TABLE 9 GLOBAL 3D BIOPRINTING MARKET FOR LIVING CELLS BY REGION, 2020–2027 (USD MILLION) 43
TABLE 10 GLOBAL 3D BIOPRINTING MARKET FOR HYDROGELS BY REGION, 2020–2027 (USD MILLION) 44
TABLE 11 GLOBAL 3D BIOPRINTING MARKET FOR EXTRACELLULAR MATRICES BY REGION, 2020–2027 (USD MILLION) 45
TABLE 12 GLOBAL 3D BIOPRINTING MARKET BY APPLICATION, 2020–2027 (USD MILLION) 47
TABLE 13 GLOBAL 3D BIOPRINTING MARKET FOR RESEARCH APPLICATIONS BY TYPE, 2020–2027 (USD MILLION) 48
TABLE 14 GLOBAL 3D BIOPRINTING MARKET FOR CLINICAL APPLICATIONS BY TYPE, 2020–2027 (USD MILLION) 48
TABLE 15 GLOBAL 3D BIOPRINTING MARKET FOR RESEARCH APPLICATIONS BY REGION, 2020–2027 (USD MILLION) 49
TABLE 16 GLOBAL 3D BIOPRINTING MARKET FOR DRUG RESEARCH BY REGION, 2020–2027 (USD MILLION) 49
TABLE 17 GLOBAL 3D BIOPRINTING MARKET FOR REGENERATIVE MEDICINE & TISSUE ENGINEERING BY REGION, 2020–2027
(USD MILLION) 50
TABLE 18 GLOBAL 3D BIOPRINTING MARKET FOR 3D CELL CULTURE BY REGION, 2020–2027 (USD MILLION) 50
TABLE 19 GLOBAL 3D BIOPRINTING MARKET FOR CLINICAL APPLICATIONS BY REGION, 2020–2027 (USD MILLION) 51
TABLE 20 GLOBAL 3D BIOPRINTING MARKET FOR SKIN BY REGION, 2020–2027 (USD MILLION) 51
TABLE 21 GLOBAL 3D BIOPRINTING MARKET FOR DENTAL BY REGION, 2020–2027 (USD MILLION) 52
TABLE 22 GLOBAL 3D BIOPRINTING MARKET FOR BONE BY REGION, 2020–2027 (USD MILLION) 52
TABLE 23 GLOBAL 3D BIOPRINTING MARKET BY END USER, 2020–2027 (USD MILLION) 55
TABLE 24 GLOBAL 3D BIOPRINTING MARKET FOR PHARMACEUTICAL & BIOTECHNOLOGY COMPANIES, BY REGION, 2020–2027
(USD MILLION) 55
TABLE 25 GLOBAL 3D BIOPRINTING MARKET FOR RESEARCH ORGANIZATIONS & ACADEMIC INSTITUTES, BY REGION, 2020–2027
(USD MILLION) 56
TABLE 26 GLOBAL 3D BIOPRINTING MARKET, BY REGION, 2020–2027 (USD MILLION) 59
TABLE 27 AMERICAS: 3D BIOPRINTING MARKET, BY REGION, 2020–2027 (USD MILLION) 60
TABLE 28 AMERICAS: 3D BIOPRINTING MARKET, BY TECHNOLOGY, 2020–2027 (USD MILLION) 61
TABLE 29 AMERICAS: 3D BIOPRINTING MARKET, BY MATERIAL, 2020–2027 (USD MILLION) 61
TABLE 30 AMERICAS: 3D BIOPRINTING MARKET, BY APPLICATION, 2020–2027 (USD MILLION) 62
TABLE 31 AMERICAS: 3D BIOPRINTING MARKET FOR RESEARCH APPLICATION BY TYPE, 2020–2027 (USD MILLION) 62
TABLE 32 AMERICAS: 3D BIOPRINTING MARKET FOR CLINICAL APPLICATIONS BY TYPE, 2020–2027 (USD MILLION) 62
TABLE 33 AMERICAS: 3D BIOPRINTING MARKET, BY END USER, 2020–2027 (USD MILLION) 63
TABLE 34 NORTH AMERICA: 3D BIOPRINTING MARKET, BY COUNTRY, 2020–2027 (USD MILLION) 64
TABLE 35 NORTH AMERICA: 3D BIOPRINTING MARKET, BY TECHNOLOGY, 2020–2027 (USD MILLION) 64
TABLE 36 NORTH AMERICA: 3D BIOPRINTING MARKET, BY MATERIAL, 2020–2027 (USD MILLION) 65
TABLE 37 NORTH AMERICA: 3D BIOPRINTING MARKET, BY APPLICATION, 2020–2027 (USD MILLION) 65
TABLE 38 NORTH AMERICA: 3D BIOPRINTING MARKET FOR RESEARCH APPLICATION BY TYPE, 2020–2027 (USD MILLION) 65
TABLE 39 NORTH AMERICA: 3D BIOPRINTING MARKET FOR CLINICAL APPLICATIONS BY TYPE, 2020–2027 (USD MILLION) 66
TABLE 40 NORTH AMERICA: 3D BIOPRINTING MARKET, BY END USER, 2020–2027 (USD MILLION) 66
TABLE 41 US: 3D BIOPRINTING MARKET, BY TECHNOLOGY, 2020–2027 (USD MILLION) 67
TABLE 42 US: 3D BIOPRINTING MARKET, BY MATERIAL, 2020–2027 (USD MILLION) 67
TABLE 43 US: 3D BIOPRINTING MARKET, BY APPLICATION, 2020–2027 (USD MILLION) 68
TABLE 44 US: 3D BIOPRINTING MARKET FOR RESEARCH APPLICATION BY TYPE, 2020–2027 (USD MILLION) 68
TABLE 45 US: 3D BIOPRINTING MARKET FOR CLINICAL APPLICATIONS BY TYPE, 2020–2027 (USD MILLION) 68
TABLE 46 US: 3D BIOPRINTING MARKET, BY END USER, 2020–2027 (USD MILLION) 69
TABLE 47 CANADA: 3D BIOPRINTING MARKET, BY TECHNOLOGY, 2020–2027 (USD MILLION) 69
TABLE 48 CANADA: 3D BIOPRINTING MARKET, BY MATERIAL, 2020–2027 (USD MILLION) 70
TABLE 49 CANADA: 3D BIOPRINTING MARKET, BY APPLICATION, 2020–2027 (USD MILLION) 70
TABLE 50 CANADA: 3D BIOPRINTING MARKET FOR RESEARCH APPLICATION BY TYPE, 2020–2027 (USD MILLION) 70
TABLE 51 CANADA: 3D BIOPRINTING MARKET FOR CLINICAL APPLICATIONS BY TYPE, 2020–2027 (USD MILLION) 71
TABLE 52 CANADA: 3D BIOPRINTING MARKET, BY END USER, 2020–2027 (USD MILLION) 71
TABLE 53 SOUTH AMERICA: 3D BIOPRINTING MARKET, BY TECHNOLOGY, 2020–2027 (USD MILLION) 72
TABLE 54 SOUTH AMERICA: 3D BIOPRINTING MARKET, BY MATERIAL, 2020–2027 (USD MILLION) 72
TABLE 55 SOUTH AMERICA: 3D BIOPRINTING MARKET, BY APPLICATION, 2020–2027 (USD MILLION) 73
TABLE 56 SOUTH AMERICA: 3D BIOPRINTING MARKET FOR RESEARCH APPLICATION BY TYPE, 2020–2027 (USD MILLION) 73
TABLE 57 SOUTH AMERICA: 3D BIOPRINTING MARKET FOR CLINICAL APPLICATIONS BY TYPE, 2020–2027 (USD MILLION) 73
TABLE 58 SOUTH AMERICA: 3D BIOPRINTING MARKET, BY END USER, 2020–2027 (USD MILLION) 74
TABLE 59 EUROPE: 3D BIOPRINTING MARKET, BY REGION, 2020–2027 (USD MILLION) 76
TABLE 60 EUROPE: 3D BIOPRINTING MARKET, BY TECHNOLOGY, 2020–2027 (USD MILLION) 76
TABLE 61 EUROPE: 3D BIOPRINTING MARKET, BY MATERIAL, 2020–2027 (USD MILLION) 77
TABLE 62 EUROPE: 3D BIOPRINTING MARKET, BY APPLICATION, 2020–2027 (USD MILLION) 77
TABLE 63 EUROPE: 3D BIOPRINTING MARKET FOR RESEARCH APPLICATION BY TYPE, 2020–2027 (USD MILLION) 77
TABLE 64 EUROPE: 3D BIOPRINTING MARKET FOR CLINICAL APPLICATIONS BY TYPE, 2020–2027 (USD MILLION) 78
TABLE 65 EUROPE: 3D BIOPRINTING MARKET, BY END USER, 2020–2027 (USD MILLION) 78
TABLE 66 WESTERN EUROPE: 3D BIOPRINTING MARKET, BY COUNTRY, 2020–2027 (USD MILLION) 79
TABLE 67 WESTERN EUROPE: 3D BIOPRINTING MARKET, BY TECHNOLOGY, 2020–2027 (USD MILLION) 80
TABLE 68 WESTERN EUROPE: 3D BIOPRINTING MARKET, BY MATERIAL, 2020–2027 (USD MILLION) 80
TABLE 69 WESTERN EUROPE: 3D BIOPRINTING MARKET, BY APPLICATION, 2020–2027 (USD MILLION) 81
TABLE 70 WESTERN EUROPE: 3D BIOPRINTING MARKET FOR RESEARCH APPLICATION BY TYPE, 2020–2027 (USD MILLION) 81
TABLE 71 WESTERN EUROPE: 3D BIOPRINTING MARKET FOR CLINICAL APPLICATIONS BY TYPE, 2020–2027 (USD MILLION) 81
TABLE 72 WESTERN EUROPE: 3D BIOPRINTING MARKET, BY END USER, 2020–2027 (USD MILLION) 82
TABLE 73 GERMANY: 3D BIOPRINTING MARKET, BY TECHNOLOGY, 2020–2027 (USD MILLION) 83
TABLE 74 GERMANY: 3D BIOPRINTING MARKET, BY MATERIAL, 2020–2027 (USD MILLION) 83
TABLE 75 GERMANY: 3D BIOPRINTING MARKET, BY APPLICATION, 2020–2027 (USD MILLION) 84
TABLE 76 GERMANY: 3D BIOPRINTING MARKET FOR RESEARCH APPLICATION BY TYPE, 2020–2027 (USD MILLION) 84
TABLE 77 GERMANY: 3D BIOPRINTING MARKET FOR CLINICAL APPLICATIONS BY TYPE, 2020–2027 (USD MILLION) 84
TABLE 78 GERMANY: 3D BIOPRINTING MARKET, BY END USER, 2020–2027 (USD MILLION) 85
TABLE 79 FRANCE: 3D BIOPRINTING MARKET, BY TECHNOLOGY, 2020–2027 (USD MILLION) 85
TABLE 80 FRANCE: 3D BIOPRINTING MARKET, BY MATERIAL, 2020–2027 (USD MILLION) 86
TABLE 81 FRANCE: 3D BIOPRINTING MARKET, BY APPLICATION, 2020–2027 (USD MILLION) 86
TABLE 82 FRANCE: 3D BIOPRINTING MARKET FOR RESEARCH APPLICATION BY TYPE, 2020–2027 (USD MILLION) 86
TABLE 83 FRANCE: 3D BIOPRINTING MARKET FOR CLINICAL APPLICATIONS BY TYPE, 2020–2027 (USD MILLION) 87
TABLE 84 FRANCE: 3D BIOPRINTING MARKET, BY END USER, 2020–2027 (USD MILLION) 87
TABLE 85 U.K: 3D BIOPRINTING MARKET, BY TECHNOLOGY, 2020–2027 (USD MILLION) 88
TABLE 86 U.K: 3D BIOPRINTING MARKET, BY MATERIAL, 2020–2027 (USD MILLION) 88
TABLE 87 U.K: 3D BIOPRINTING MARKET, BY APPLICATION, 2020–2027 (USD MILLION) 89
TABLE 88 U.K: 3D BIOPRINTING MARKET FOR RESEARCH APPLICATION BY TYPE, 2020–2027 (USD MILLION) 89
TABLE 89 U.K: 3D BIOPRINTING MARKET FOR CLINICAL APPLICATIONS BY TYPE, 2020–2027 (USD MILLION) 89
TABLE 90 U.K: 3D BIOPRINTING MARKET, BY END USER, 2020–2027 (USD MILLION) 90
TABLE 91 ITALY: 3D BIOPRINTING MARKET, BY TECHNOLOGY, 2020–2027 (USD MILLION) 90
TABLE 92 ITALY: 3D BIOPRINTING MARKET, BY MATERIAL, 2020–2027 (USD MILLION) 91
TABLE 93 ITALY: 3D BIOPRINTING MARKET, BY APPLICATION, 2020–2027 (USD MILLION) 91
TABLE 94 ITALY: 3D BIOPRINTING MARKET FOR RESEARCH APPLICATION BY TYPE, 2020–2027 (USD MILLION) 91
TABLE 95 ITALY: 3D BIOPRINTING MARKET FOR CLINICAL APPLICATIONS BY TYPE, 2020–2027 (USD MILLION) 92
TABLE 96 ITALY: 3D BIOPRINTING MARKET, BY END USER, 2020–2027 (USD MILLION) 92
TABLE 97 SPAIN: 3D BIOPRINTING MARKET, BY TECHNOLOGY, 2020–2027 (USD MILLION) 93
TABLE 98 SPAIN: 3D BIOPRINTING MARKET, BY MATERIAL, 2020–2027 (USD MILLION) 93
TABLE 99 SPAIN: 3D BIOPRINTING MARKET, BY APPLICATION, 2020–2027 (USD MILLION) 94
TABLE 100 SPAIN: 3D BIOPRINTING MARKET FOR RESEARCH APPLICATION BY TYPE, 2020–2027 (USD MILLION) 94
TABLE 101 SPAIN: 3D BIOPRINTING MARKET FOR CLINICAL APPLICATIONS BY TYPE, 2020–2027 (USD MILLION) 94
TABLE 102 SPAIN: 3D BIOPRINTING MARKET, BY END USER, 2020–2027 (USD MILLION) 95
TABLE 103 REST OF WESTERN EUROPE: 3D BIOPRINTING MARKET, BY TECHNOLOGY, 2020–2027 (USD MILLION) 95
TABLE 104 REST OF WESTERN EUROPE: 3D BIOPRINTING MARKET, BY MATERIAL, 2020–2027 (USD MILLION) 96
TABLE 105 REST OF WESTERN EUROPE: 3D BIOPRINTING MARKET, BY APPLICATION, 2020–2027 (USD MILLION) 96
TABLE 106 REST OF WESTERN EUROPE: 3D BIOPRINTING MARKET FOR RESEARCH APPLICATION BY TYPE, 2020–2027 (USD MILLION) 97
TABLE 107 REST OF WESTERN EUROPE: 3D BIOPRINTING MARKET FOR CLINICAL APPLICATIONS BY TYPE, 2020–2027 (USD MILLION) 97
TABLE 108 REST OF WESTERN EUROPE: 3D BIOPRINTING MARKET, BY END USER, 2020–2027 (USD MILLION) 98
TABLE 109 EASTERN EUROPE: 3D BIOPRINTING MARKET, BY TECHNOLOGY, 2020–2027 (USD MILLION) 98
TABLE 110 EASTERN EUROPE: 3D BIOPRINTING MARKET, BY MATERIAL, 2020–2027 (USD MILLION) 99
TABLE 111 EASTERN EUROPE: 3D BIOPRINTING MARKET, BY APPLICATION, 2020–2027 (USD MILLION) 99
TABLE 112 EASTERN EUROPE: 3D BIOPRINTING MARKET FOR RESEARCH APPLICATION BY TYPE, 2020–2027 (USD MILLION) 99
TABLE 113 EASTERN EUROPE: 3D BIOPRINTING MARKET FOR CLINICAL APPLICATIONS BY TYPE, 2020–2027 (USD MILLION) 100
TABLE 114 EASTERN EUROPE: 3D BIOPRINTING MARKET, BY END USER, 2020–2027 (USD MILLION) 100
TABLE 115 ASIA-PACIFIC: 3D BIOPRINTING MARKET, BY COUNTRY, 2020–2027 (USD MILLION) 102
TABLE 116 ASIA-PACIFIC: 3D BIOPRINTING MARKET, BY TECHNOLOGY, 2020–2027 (USD MILLION) 102
TABLE 117 ASIA-PACIFIC: 3D BIOPRINTING MARKET, BY MATERIAL, 2020–2027 (USD MILLION) 103
TABLE 118 ASIA-PACIFIC: 3D BIOPRINTING MARKET, BY APPLICATION, 2020–2027 (USD MILLION) 103
TABLE 119 ASIA-PACIFIC: 3D BIOPRINTING MARKET FOR RESEARCH APPLICATION BY TYPE, 2020–2027 (USD MILLION) 103
TABLE 120 ASIA-PACIFIC: 3D BIOPRINTING MARKET FOR CLINICAL APPLICATIONS BY TYPE, 2020–2027 (USD MILLION) 104
TABLE 121 ASIA-PACIFIC: 3D BIOPRINTING MARKET, BY END USER, 2020–2027 (USD MILLION) 104
TABLE 122 JAPAN: 3D BIOPRINTING MARKET, BY TECHNOLOGY, 2020–2027 (USD MILLION) 105
TABLE 123 JAPAN: 3D BIOPRINTING MARKET, BY MATERIAL, 2020–2027 (USD MILLION) 105
TABLE 124 JAPAN: 3D BIOPRINTING MARKET, BY APPLICATION, 2020–2027 (USD MILLION) 106
TABLE 125 JAPAN: 3D BIOPRINTING MARKET FOR RESEARCH APPLICATION BY TYPE, 2020–2027 (USD MILLION) 106
TABLE 126 JAPAN: 3D BIOPRINTING MARKET FOR CLINICAL APPLICATIONS BY TYPE, 2020–2027 (USD MILLION) 106
TABLE 127 JAPAN: 3D BIOPRINTING MARKET, BY END USER, 2020–2027 (USD MILLION) 107
TABLE 128 CHINA: 3D BIOPRINTING MARKET, BY TECHNOLOGY, 2020–2027 (USD MILLION) 108
TABLE 129 CHINA: 3D BIOPRINTING MARKET, BY MATERIAL, 2020–2027 (USD MILLION) 108
TABLE 130 CHINA: 3D BIOPRINTING MARKET, BY APPLICATION, 2020–2027 (USD MILLION) 109
TABLE 131 CHINA: 3D BIOPRINTING MARKET FOR RESEARCH APPLICATION BY TYPE, 2020–2027 (USD MILLION) 109
TABLE 132 CHINA: 3D BIOPRINTING MARKET FOR CLINICAL APPLICATIONS BY TYPE, 2020–2027 (USD MILLION) 109
TABLE 133 CHINA: 3D BIOPRINTING MARKET, BY END USER, 2020–2027 (USD MILLION) 110
TABLE 134 INDIA: 3D BIOPRINTING MARKET, BY TECHNOLOGY, 2020–2027 (USD MILLION) 111
TABLE 135 INDIA: 3D BIOPRINTING MARKET, BY MATERIAL, 2020–2027 (USD MILLION) 111
TABLE 136 INDIA: 3D BIOPRINTING MARKET, BY APPLICATION, 2020–2027 (USD MILLION) 112
TABLE 137 INDIA: 3D BIOPRINTING MARKET FOR RESEARCH APPLICATION BY TYPE, 2020–2027 (USD MILLION) 112
TABLE 138 INDIA: 3D BIOPRINTING MARKET FOR CLINICAL APPLICATIONS BY TYPE, 2020–2027 (USD MILLION) 112
TABLE 139 INDIA: 3D BIOPRINTING MARKET, BY END USER, 2020–2027 (USD MILLION) 113
TABLE 140 AUSTRALIA: 3D BIOPRINTING MARKET, BY TECHNOLOGY, 2020–2027 (USD MILLION) 114
TABLE 141 AUSTRALIA: 3D BIOPRINTING MARKET, BY MATERIAL, 2020–2027 (USD MILLION) 114
TABLE 142 AUSTRALIA: 3D BIOPRINTING MARKET, BY APPLICATION, 2020–2027 (USD MILLION) 115
TABLE 143 AUSTRALIA: 3D BIOPRINTING MARKET FOR RESEARCH APPLICATION BY TYPE, 2020–2027 (USD MILLION) 115
TABLE 144 AUSTRALIA: 3D BIOPRINTING MARKET FOR CLINICAL APPLICATIONS BY TYPE, 2020–2027 (USD MILLION) 115
TABLE 145 AUSTRALIA: 3D BIOPRINTING MARKET, BY END USER, 2020–2027 (USD MILLION) 116
TABLE 146 SOUTH KOREA: 3D BIOPRINTING MARKET, BY TECHNOLOGY, 2020–2027 (USD MILLION) 116
TABLE 147 SOUTH KOREA: 3D BIOPRINTING MARKET, BY MATERIAL, 2020–2027 (USD MILLION) 117
TABLE 148 SOUTH KOREA: 3D BIOPRINTING MARKET, BY APPLICATION, 2020–2027 (USD MILLION) 117
TABLE 149 SOUTH KOREA: 3D BIOPRINTING MARKET FOR RESEARCH APPLICATION BY TYPE, 2020–2027 (USD MILLION) 117
TABLE 150 SOUTH KOREA: 3D BIOPRINTING MARKET FOR CLINICAL APPLICATIONS BY TYPE, 2020–2027 (USD MILLION) 118
TABLE 151 SOUTH KOREA: 3D BIOPRINTING MARKET, BY END USER, 2020–2027 (USD MILLION) 118
TABLE 152 REST OF ASIA–PACIFIC: 3D BIOPRINTING MARKET, BY TECHNOLOGY, 2020–2027 (USD MILLION) 119
TABLE 153 REST OF ASIA–PACIFIC: 3D BIOPRINTING MARKET, BY MATERIAL, 2020–2027 (USD MILLION) 119
TABLE 154 REST OF ASIA–PACIFIC: 3D BIOPRINTING MARKET, BY APPLICATION, 2020–2027 (USD MILLION) 120
TABLE 155 REST OF ASIA–PACIFIC: 3D BIOPRINTING MARKET FOR RESEARCH APPLICATION BY TYPE, 2020–2027 (USD MILLION) 120
TABLE 156 REST OF ASIA–PACIFIC: 3D BIOPRINTING MARKET FOR CLINICAL APPLICATIONS BY TYPE, 2020–2027 (USD MILLION) 120
TABLE 157 REST OF ASIA–PACIFIC: 3D BIOPRINTING MARKET, BY END USER, 2020–2027 (USD MILLION) 121
TABLE 158 MIDDLE EAST AND AFRICA: 3D BIOPRINTING MARKET, BY REGION, 2020–2027 (USD MILLION) 122
TABLE 159 MIDDLE EAST AND AFRICA: 3D BIOPRINTING MARKET, BY TECHNOLOGY, 2020–2027 (USD MILLION) 123
TABLE 160 MIDDLE EAST AND AFRICA: 3D BIOPRINTING MARKET, BY MATERIAL, 2020–2027 (USD MILLION) 123
TABLE 161 MIDDLE EAST AND AFRICA: 3D BIOPRINTING MARKET, BY APPLICATION, 2020–2027 (USD MILLION) 124
TABLE 162 MIDDLE EAST AND AFRICA: 3D BIOPRINTING MARKET FOR RESEARCH APPLICATION BY TYPE, 2020–2027 (USD MILLION) 124
TABLE 163 MIDDLE EAST AND AFRICA: 3D BIOPRINTING MARKET FOR CLINICAL APPLICATIONS BY TYPE, 2020–2027 (USD MILLION) 124
TABLE 164 MIDDLE EAST AND AFRICA: 3D BIOPRINTING MARKET, BY END USER, 2020–2027 (USD MILLION) 125
TABLE 165 MIDDLE EAST: 3D BIOPRINTING MARKET, BY TECHNOLOGY, 2020–2027 (USD MILLION) 126
TABLE 166 MIDDLE EAST: 3D BIOPRINTING MARKET, BY MATERIAL, 2020–2027 (USD MILLION) 126
TABLE 167 MIDDLE EAST: 3D BIOPRINTING MARKET, BY APPLICATION, 2020–2027 (USD MILLION) 127
TABLE 168 MIDDLE EAST: 3D BIOPRINTING MARKET FOR RESEARCH APPLICATION BY TYPE, 2020–2027 (USD MILLION) 127
TABLE 169 MIDDLE EAST: 3D BIOPRINTING MARKET FOR CLINICAL APPLICATIONS BY TYPE, 2020–2027 (USD MILLION) 127
TABLE 170 MIDDLE EAST: 3D BIOPRINTING MARKET, BY END USER, 2020–2027 (USD MILLION) 128
TABLE 171 AFRICA: 3D BIOPRINTING MARKET, BY TECHNOLOGY, 2020–2027 (USD MILLION) 129
TABLE 172 AFRICA: 3D BIOPRINTING MARKET, BY MATERIAL, 2020–2027 (USD MILLION) 129
TABLE 173 AFRICA: 3D BIOPRINTING MARKET, BY APPLICATION, 2020–2027 (USD MILLION) 130
TABLE 174 AFRICA: 3D BIOPRINTING MARKET FOR RESEARCH APPLICATION BY TYPE, 2020–2027 (USD MILLION) 130
TABLE 175 AFRICA: 3D BIOPRINTING MARKET FOR CLINICAL APPLICATIONS BY TYPE, 2020–2027 (USD MILLION) 130
TABLE 176 AFRICA: 3D BIOPRINTING MARKET, BY END USER, 2020–2027 (USD MILLION) 131
16 List of Figures
FIGURE 1 RESEARCH PROCESS 21
FIGURE 2 TOP-DOWN & BOTTOM-UP APPROACH 26
FIGURE 3 MARKET DYNAMICS: ANALYSIS OF THE GLOBAL 3D BIOPRINTING MARKET 28
FIGURE 4 PORTER’S FIVE FORCES ANALYSIS: GLOBAL 3D BIOPRINTING MARKET 32
FIGURE 5 SUPPLY CHAIN: GLOBAL 3D BIOPRINTING MARKET 34
FIGURE 6 GLOBAL 3D BIOPRINTING MARKET SHARE, BY TECHNOLOGY, 2020 (%) 37
FIGURE 7 GLOBAL 3D BIOPRINTING MARKET, BY TECHNOLOGY, 2020 & 2027 (USD MILLION) 37
FIGURE 8 GLOBAL 3D BIOPRINTING MARKET SHARE, BY MATERIAL, 2020 (%) 42
FIGURE 9 GLOBAL 3D BIOPRINTING MARKET, BY MATERIAL, 2020 & 2027 (USD MILLION) 42
FIGURE 10 GLOBAL 3D BIOPRINTING MARKET SHARE, BY APPLICATION, 2020 (%) 47
FIGURE 11 GLOBAL 3D BIOPRINTING MARKET, BY APPLICATION, 2020 & 2027 (USD MILLION) 47
FIGURE 12 GLOBAL 3D BIOPRINTING MARKET SHARE, BY END USER, 2020 (%) 54
FIGURE 13 GLOBAL 3D BIOPRINTING MARKET, BY END USER, 2020 & 2027 (USD MILLION) 54
FIGURE 14 GLOBAL 3D BIOPRINTING MARKET, BY REGION, 2020 & 2027 (USD MILLION) 58
FIGURE 15 GLOBAL 3D BIOPRINTING MARKET SHARE, BY REGION, 2020 (%) 59
FIGURE 16 AMERICAS: 3D BIOPRINTING MARKET SHARE, BY REGION, 2020 (%) 60
FIGURE 17 NORTH AMERICA: 3D BIOPRINTING MARKET SHARE, BY COUNTRY, 2020 (%) 63
FIGURE 18 EUROPE: 3D BIOPRINTING MARKET SHARE, BY REGION, 2020 (%) 75
FIGURE 19 WESTERN EUROPE: 3D BIOPRINTING MARKET SHARE, BY COUNTRY, 2020 (%) 79
FIGURE 20 ASIA-PACIFIC: 3D BIOPRINTING MARKET SHARE, BY COUNTRY, 2020 (%) 101
FIGURE 21 MIDDLE EAST AND AFRICA: 3D BIOPRINTING MARKET SHARE, BY REGION, 2020 (%) 122
1.1 Introduction
A large number of companies are working in the global 3D bioprinting market. Through extensive research, it is found that market players have adopted strategies of product launches, acquisitions, and collaborations. On the basis of the market study, we found some key players operating in this market which are Organovo Holdings Inc., Cellink AB, Stratasys Ltd, Envisiontec GMBH, Cyfuse Biomedical K.K., Aspect Biosystems Ltd, FUJIFILM Wako Automation Corporation, Nano3D Biosciences Inc., Allevi, Regenhu Ltd, Poietis, Regenovo Biotechnology Co. Ltd, and others.
Organovo Holdings Inc. is one of the leading players in the market with a strong customer base and diverse product portfolio. The company has a collaboration with major pharmaceutical companies and research institutes. Organovo is known as a trusted bioprinting products provider for drug discovery and regenerative medicine laboratories. Furthermore, the company is capturing emerging markets by launching new products.
1.2 Company Ranking
Many leading players are concentrated in the Americas and Europe owing to the strengthening healthcare system, well-established market, high healthcare expenditures, and numerous opportunities for growth. These players have expanded their market in other regions as well. Major players in the market are investing a huge amount of money in research and development activities and filing product patents. For instance, according to the 3D printing industry, 3D bioprinting industry is experiencing a surge in product patent filings, and 950 patents were filed by more than 100 companies by the end of 2016. Furthermore, companies such as Organovo Holdings Inc., Cellink AB, Stratasys Ltd, Envisiontec GMBH, Cyfuse Biomedical K.K., and Aspect Biosystems Ltd are top six market players in this market. Apart from this, FUJIFILM Wako Automation Corporation, Nano3D Biosciences Inc., Allevi, Regenhu Ltd, Poietis, and Regenovo Biotechnology Co. Ltd are some of the well-established players in the global 3D bioprinting market.
Organovo Holdings Inc. is a leading biotechnology company which provides 3D bioprinting functional tissues. The company focuses on manufacturing three-dimensional tissues, and these tissues are used in various research and development activities as well as in implant therapies. Moreover, the company depends on collaborations and strategic agreements with biopharmaceutical companies, research institutes, and healthcare providers to expand its business.