ID: MRFR/MED/0367-CR | February 2021 | Region: Global | 163 Pages
1 Report Prologue
2 Executive Summary
3 Market Introduction
3.1 Definition 20
3.2 Scope of the Study 20
3.3 Research Objective 20
3.4 Assumptions & Limitations 20
3.4.1 Assumptions 20
3.4.2 Limitations 20
3.5 Market Structure 21
3.6 Research Process 21
4 Research Methodology
4.1 Primary Research 24
4.2 Secondary Research 25
4.3 Market Size Estimation 26
4.4 Forecast Model 26
5 Market Dynamics
5.1 Introduction 28
5.2 Drivers 28
5.2.1 Growing Demand for Organ Transplantation 28
5.2.2 Cost-Efficiency of 3D Bioprinting 28
5.2.3 Growing Focus of Market Players on 3D Bioprinting 29
5.2.4 Increasing Funding and Investments for Research 29
5.3 Restraints 29
5.3.1 Lack of Awareness Regarding 3D Bioprinting 29
5.3.2 Lack of Skilled Professionals 29
5.4 Opportunities 30
5.4.1 Dominance of Start-Ups 30
6 Market Factor Analysis
6.1 Porterβs Five Forces Model 32
6.1.1 Bargaining Power of Suppliers 32
6.1.2 Bargaining Power of Buyers 33
6.1.3 Threat of New Entrants 33
6.1.4 Threat of Substitutes 33
6.1.5 Rivalry 33
6.2 Supply Chain Analysis 34
6.2.1 R&D and Development 34
6.2.2 Manufacturing 34
6.2.3 Distribution & Sales 34
6.2.4 Post-Sales Monitoring 35
6.3 Investment Feasibility Analysis 35
6.4 Pricing Analysis 35
7 3D Bioprinting Market, by Technology
7.1 Introduction 37
7.2 Microextrusion Bioprinting 38
7.3 Inkjet 3D bioprinting 39
7.4 Laser-Assisted Bioprinting 39
7.5 Magnetic 3D Bioprinting 40
8 3D Bioprinting Market, by Material
8.1 Introduction 42
8.2 Living Cells 43
8.3 Hydrogels 44
8.4 Extracellular Matrices 44
9 3D Bioprinting Market, by Application
9.1 Introduction 47
9.2 Research Applications 48
9.3 Clinical Applications 51
10 3D Bioprinting Market, by End User
10.1 Introduction 54
10.2 Pharmaceutical & Biotechnology Companies 55
10.3 Research Organizations & Academic Institutes 56
11 Global 3D Bioprinting Market, by Region
11.1 Introduction 58
11.2 Americas 60
3D Bioprinting Market, by Technology
3D Bioprinting Market, by Material
3D Bioprinting Market, by Application
3D Bioprinting Market, by End User
11.2.1 North America 63
3D Bioprinting Market, by Technology
3D Bioprinting Market, by Material
3D Bioprinting Market, by Application
3D Bioprinting Market, by End User
11.2.1.1 US 67
3D Bioprinting Market, by Technology
3D Bioprinting Market, by Material
3D Bioprinting Market, by Application
3D Bioprinting Market, by End User
11.2.1.2 Canada 69
3D Bioprinting Market, by Technology
3D Bioprinting Market, by Material
3D Bioprinting Market, by Application
3D Bioprinting Market, by End User
11.2.2 South America 72
3D Bioprinting Market, by Technology
3D Bioprinting Market, by Material
3D Bioprinting Market, by Application
3D Bioprinting Market, by End User
11.3 Europe 75
3D Bioprinting Market, by Technology
3D Bioprinting Market, by Material
3D Bioprinting Market, by Application
3D Bioprinting Market, by End User
11.3.1 Western Europe 79
3D Bioprinting Market, by Technology
3D Bioprinting Market, by Material
3D Bioprinting Market, by Application
3D Bioprinting Market, by End User
11.3.1.1 Germany 83
3D Bioprinting Market, by Technology
3D Bioprinting Market, by Material
3D Bioprinting Market, by Application
3D Bioprinting Market, by End User
11.3.1.2 France 85
3D Bioprinting Market, by Technology
3D Bioprinting Market, by Material
3D Bioprinting Market, by Application
3D Bioprinting Market, by End User
11.3.1.3 U.K 88
3D Bioprinting Market, by Technology
3D Bioprinting Market, by Material
3D Bioprinting Market, by Application
3D Bioprinting Market, by End User
11.3.1.4 Italy 90
3D Bioprinting Market, by Technology
3D Bioprinting Market, by Material
3D Bioprinting Market, by Application
3D Bioprinting Market, by End User
11.3.1.5 Spain 93
3D Bioprinting Market, by Technology
3D Bioprinting Market, by Material
3D Bioprinting Market, by Application
3D Bioprinting Market, by End User
11.3.1.6 Rest of Western Europe 95
3D Bioprinting Market, by Technology
3D Bioprinting Market, by Material
3D Bioprinting Market, by Application
3D Bioprinting Market, by End User
11.3.2 Eastern Europe 98
3D Bioprinting Market, by Technology
3D Bioprinting Market, by Material
3D Bioprinting Market, by Application
3D Bioprinting Market, by End User
11.4 Asia-Pacific 101
3D Bioprinting Market, by Technology
3D Bioprinting Market, by Material
3D Bioprinting Market, by Application
3D Bioprinting Market, by End User
11.4.1 Japan 105
3D Bioprinting Market, by Technology
3D Bioprinting Market, by Material
3D Bioprinting Market, by Application
3D Bioprinting Market, by End User
11.4.2 China 108
3D Bioprinting Market, by Technology
3D Bioprinting Market, by Material
3D Bioprinting Market, by Application
3D Bioprinting Market, by End User
11.4.3 India 111
3D Bioprinting Market, by Technology
3D Bioprinting Market, by Material
3D Bioprinting Market, by Application
3D Bioprinting Market, by End User
11.4.4 Australia 114
3D Bioprinting Market, by Technology
3D Bioprinting Market, by Material
3D Bioprinting Market, by Application
3D Bioprinting Market, by End User
11.4.5 South Korea 116
3D Bioprinting Market, by Technology
3D Bioprinting Market, by Material
3D Bioprinting Market, by Application
3D Bioprinting Market, by End User
11.4.6 Rest of AsiaβPacific 119
3D Bioprinting Market, by Technology
3D Bioprinting Market, by Material
3D Bioprinting Market, by Application
3D Bioprinting Market, by End User
11.5 Middle East and Africa 122
3D Bioprinting Market, by Technology
3D Bioprinting Market, by Material
3D Bioprinting Market, by Application
3D Bioprinting Market, by End User
11.5.1 Middle East 126
3D Bioprinting Market, by Technology
3D Bioprinting Market, by Material
3D Bioprinting Market, by Application
3D Bioprinting Market, by End User
11.5.2 Africa 129
3D Bioprinting Market, by Technology
3D Bioprinting Market, by Material
3D Bioprinting Market, by Application
3D Bioprinting Market, by End User
12 Competitive Landscape
12.1 Introduction 133
12.2 Company Ranking 133
13 Company Profiles
13.1 Organovo Holdings Inc. 135
13.1.1 Company Overview 135
13.1.2 Financial Overview 135
13.1.3 Products/Services Offered 136
13.1.4 Key Developments 136
13.1.5 SWOT Analysis 136
13.1.6 Key Strategy 136
13.2 Cellink AB 137
13.2.1 Company Overview 137
13.2.2 Financial Overview 137
13.2.3 Products/Services Offered 138
13.2.4 Key Developments 138
13.2.5 SWOT Analysis 138
13.2.6 Key Strategy 139
13.3 Stratasys Ltd 140
13.3.1 Company Overview 140
13.3.2 Financial Overview 140
13.3.3 Products/Services Offered 141
13.3.4 Key Developments 141
13.3.5 SWOT Analysis 141
13.3.6 Key Strategy 141
13.4 FUJIFILM Wako Automation Corporation 142
13.4.1 Company Overview 142
13.4.2 Financial Overview 142
13.4.3 Products/Services Offered 143
13.4.4 Key Developments 143
13.4.5 SWOT Analysis 143
13.4.6 Key Strategy 143
13.5 Envisiontec GMBH 144
13.5.1 Company Overview 144
13.5.2 Financial Overview 144
13.5.3 Products/Services Offered 144
13.5.4 Key Developments 144
13.5.5 SWOT Analysis 145
13.5.6 Key Strategy 145
13.6 Nano3D Biosciences Inc. 146
13.6.1 Company Overview 146
13.6.2 Financial Overview 146
13.6.3 Products/Services Offered 146
13.6.4 Key Developments 146
13.6.5 SWOT Analysis 147
13.6.6 Key Strategy 147
13.7 Allevi 148
13.7.1 Company Overview 148
13.7.2 Financial Overview 148
13.7.3 Products/Services Offered 148
13.7.4 Key Developments 148
13.7.5 SWOT Analysis 149
13.7.6 Key Strategy 149
13.8 Cyfuse Biomedical K.K. 150
13.8.1 Company Overview 150
13.8.2 Financial Overview 150
13.8.3 Products/Services Offered 150
13.8.4 Key Developments 150
13.8.5 SWOT Analysis 150
13.8.6 Key Strategy 151
13.9 REGENHU LTD 152
13.9.1 Company Overview 152
13.9.2 Financial Overview 152
13.9.3 Products/Services Offered 152
13.9.4 Key Developments 152
13.9.5 SWOT Analysis 153
13.9.6 Key Strategy 153
13.10 Aspect Biosystems Ltd 154
13.10.1 Company Overview 154
13.10.2 Financial Overview 154
13.10.3 Products/Services Offered 154
13.10.4 Key Developments 154
13.10.5 SWOT Analysis 155
13.10.6 Key Strategy 155
13.11 Regenovo Biotechnology Co. Ltd. 156
13.11.1 Company Overview 156
13.11.2 Financial Overview 156
13.11.3 Products/Services Offered 156
13.11.4 Key Developments 156
13.11.5 SWOT Analysis 157
13.11.6 Key Strategy 157
13.12 Poietis 158
13.12.1 Company Overview 158
13.12.2 Financial Overview 158
13.12.3 Products/Services Offered 158
13.12.4 Key Developments 158
13.12.5 SWOT Analysis 159
13.12.6 Key Strategy 159
14 Appendix
14.1 Discussion Blue Print 161
15 List of Tables
TABLE 1 MARKET SYNOPSIS 18
TABLE 2 PRIMARY INTERVIEWS 22
TABLE 3 GLOBAL 3D BIOPRINTING MARKET BY TECHNOLOGY, 2020β2028 (USD MILLION) 38
TABLE 4 GLOBAL 3D BIOPRINTING MARKET FOR MICROEXTRUSION BIOPRINTING BY REGION, 2020β2028 (USD MILLION) 38
TABLE 5 GLOBAL 3D BIOPRINTING MARKET FOR INKJET 3D BIOPRINTING BY REGION, 2020β2028 (USD MILLION) 39
TABLE 6 GLOBAL 3D BIOPRINTING MARKET FOR LASER-ASSISTED BIOPRINTING BY REGION, 2020β2028 (USD MILLION) 40
TABLE 7 GLOBAL 3D BIOPRINTING MARKET FOR MAGNETIC 3D BIOPRINTING BY REGION, 2020β2028 (USD MILLION) 40
TABLE 8 GLOBAL 3D BIOPRINTING MARKET BY MATERIAL, 2020β2028 (USD MILLION) 43
TABLE 9 GLOBAL 3D BIOPRINTING MARKET FOR LIVING CELLS BY REGION, 2020β2028 (USD MILLION) 43
TABLE 10 GLOBAL 3D BIOPRINTING MARKET FOR HYDROGELS BY REGION, 2020β2028 (USD MILLION) 44
TABLE 11 GLOBAL 3D BIOPRINTING MARKET FOR EXTRACELLULAR MATRICES BY REGION, 2020β2028 (USD MILLION) 45
TABLE 12 GLOBAL 3D BIOPRINTING MARKET BY APPLICATION, 2020β2028 (USD MILLION) 47
TABLE 13 GLOBAL 3D BIOPRINTING MARKET FOR RESEARCH APPLICATIONS BY TYPE, 2020β2028 (USD MILLION) 48
TABLE 14 GLOBAL 3D BIOPRINTING MARKET FOR CLINICAL APPLICATIONS BY TYPE, 2020β2028 (USD MILLION) 48
TABLE 15 GLOBAL 3D BIOPRINTING MARKET FOR RESEARCH APPLICATIONS BY REGION, 2020β2028 (USD MILLION) 49
TABLE 16 GLOBAL 3D BIOPRINTING MARKET FOR DRUG RESEARCH BY REGION, 2020β2028 (USD MILLION) 49
TABLE 17 GLOBAL 3D BIOPRINTING MARKET FOR REGENERATIVE MEDICINE & TISSUE ENGINEERING BY REGION, 2020β2028
(USD MILLION) 50
TABLE 18 GLOBAL 3D BIOPRINTING MARKET FOR 3D CELL CULTURE BY REGION, 2020β2028 (USD MILLION) 50
TABLE 19 GLOBAL 3D BIOPRINTING MARKET FOR CLINICAL APPLICATIONS BY REGION, 2020β2028 (USD MILLION) 51
TABLE 20 GLOBAL 3D BIOPRINTING MARKET FOR SKIN BY REGION, 2020β2028 (USD MILLION) 51
TABLE 21 GLOBAL 3D BIOPRINTING MARKET FOR DENTAL BY REGION, 2020β2028 (USD MILLION) 52
TABLE 22 GLOBAL 3D BIOPRINTING MARKET FOR BONE BY REGION, 2020β2028 (USD MILLION) 52
TABLE 23 GLOBAL 3D BIOPRINTING MARKET BY END USER, 2020β2028 (USD MILLION) 55
TABLE 24 GLOBAL 3D BIOPRINTING MARKET FOR PHARMACEUTICAL & BIOTECHNOLOGY COMPANIES, BY REGION, 2020β2028
(USD MILLION) 55
TABLE 25 GLOBAL 3D BIOPRINTING MARKET FOR RESEARCH ORGANIZATIONS & ACADEMIC INSTITUTES, BY REGION, 2020β2028
(USD MILLION) 56
TABLE 26 GLOBAL 3D BIOPRINTING MARKET, BY REGION, 2020β2028 (USD MILLION) 59
TABLE 27 AMERICAS: 3D BIOPRINTING MARKET, BY REGION, 2020β2028 (USD MILLION) 60
TABLE 28 AMERICAS: 3D BIOPRINTING MARKET, BY TECHNOLOGY, 2020β2028 (USD MILLION) 61
TABLE 29 AMERICAS: 3D BIOPRINTING MARKET, BY MATERIAL, 2020β2028 (USD MILLION) 61
TABLE 30 AMERICAS: 3D BIOPRINTING MARKET, BY APPLICATION, 2020β2028 (USD MILLION) 62
TABLE 31 AMERICAS: 3D BIOPRINTING MARKET FOR RESEARCH APPLICATION BY TYPE, 2020β2028 (USD MILLION) 62
TABLE 32 AMERICAS: 3D BIOPRINTING MARKET FOR CLINICAL APPLICATIONS BY TYPE, 2020β2028 (USD MILLION) 62
TABLE 33 AMERICAS: 3D BIOPRINTING MARKET, BY END USER, 2020β2028 (USD MILLION) 63
TABLE 34 NORTH AMERICA: 3D BIOPRINTING MARKET, BY COUNTRY, 2020β2028 (USD MILLION) 64
TABLE 35 NORTH AMERICA: 3D BIOPRINTING MARKET, BY TECHNOLOGY, 2020β2028 (USD MILLION) 64
TABLE 36 NORTH AMERICA: 3D BIOPRINTING MARKET, BY MATERIAL, 2020β2028 (USD MILLION) 65
TABLE 37 NORTH AMERICA: 3D BIOPRINTING MARKET, BY APPLICATION, 2020β2028 (USD MILLION) 65
TABLE 38 NORTH AMERICA: 3D BIOPRINTING MARKET FOR RESEARCH APPLICATION BY TYPE, 2020β2028 (USD MILLION) 65
TABLE 39 NORTH AMERICA: 3D BIOPRINTING MARKET FOR CLINICAL APPLICATIONS BY TYPE, 2020β2028 (USD MILLION) 66
TABLE 40 NORTH AMERICA: 3D BIOPRINTING MARKET, BY END USER, 2020β2028 (USD MILLION) 66
TABLE 41 US: 3D BIOPRINTING MARKET, BY TECHNOLOGY, 2020β2028 (USD MILLION) 67
TABLE 42 US: 3D BIOPRINTING MARKET, BY MATERIAL, 2020β2028 (USD MILLION) 67
TABLE 43 US: 3D BIOPRINTING MARKET, BY APPLICATION, 2020β2028 (USD MILLION) 68
TABLE 44 US: 3D BIOPRINTING MARKET FOR RESEARCH APPLICATION BY TYPE, 2020β2028 (USD MILLION) 68
TABLE 45 US: 3D BIOPRINTING MARKET FOR CLINICAL APPLICATIONS BY TYPE, 2020β2028 (USD MILLION) 68
TABLE 46 US: 3D BIOPRINTING MARKET, BY END USER, 2020β2028 (USD MILLION) 69
TABLE 47 CANADA: 3D BIOPRINTING MARKET, BY TECHNOLOGY, 2020β2028 (USD MILLION) 69
TABLE 48 CANADA: 3D BIOPRINTING MARKET, BY MATERIAL, 2020β2028 (USD MILLION) 70
TABLE 49 CANADA: 3D BIOPRINTING MARKET, BY APPLICATION, 2020β2028 (USD MILLION) 70
TABLE 50 CANADA: 3D BIOPRINTING MARKET FOR RESEARCH APPLICATION BY TYPE, 2020β2028 (USD MILLION) 70
TABLE 51 CANADA: 3D BIOPRINTING MARKET FOR CLINICAL APPLICATIONS BY TYPE, 2020β2028 (USD MILLION) 71
TABLE 52 CANADA: 3D BIOPRINTING MARKET, BY END USER, 2020β2028 (USD MILLION) 71
TABLE 53 SOUTH AMERICA: 3D BIOPRINTING MARKET, BY TECHNOLOGY, 2020β2028 (USD MILLION) 72
TABLE 54 SOUTH AMERICA: 3D BIOPRINTING MARKET, BY MATERIAL, 2020β2028 (USD MILLION) 72
TABLE 55 SOUTH AMERICA: 3D BIOPRINTING MARKET, BY APPLICATION, 2020β2028 (USD MILLION) 73
TABLE 56 SOUTH AMERICA: 3D BIOPRINTING MARKET FOR RESEARCH APPLICATION BY TYPE, 2020β2028 (USD MILLION) 73
TABLE 57 SOUTH AMERICA: 3D BIOPRINTING MARKET FOR CLINICAL APPLICATIONS BY TYPE, 2020β2028 (USD MILLION) 73
TABLE 58 SOUTH AMERICA: 3D BIOPRINTING MARKET, BY END USER, 2020β2028 (USD MILLION) 74
TABLE 59 EUROPE: 3D BIOPRINTING MARKET, BY REGION, 2020β2028 (USD MILLION) 76
TABLE 60 EUROPE: 3D BIOPRINTING MARKET, BY TECHNOLOGY, 2020β2028 (USD MILLION) 76
TABLE 61 EUROPE: 3D BIOPRINTING MARKET, BY MATERIAL, 2020β2028 (USD MILLION) 77
TABLE 62 EUROPE: 3D BIOPRINTING MARKET, BY APPLICATION, 2020β2028 (USD MILLION) 77
TABLE 63 EUROPE: 3D BIOPRINTING MARKET FOR RESEARCH APPLICATION BY TYPE, 2020β2028 (USD MILLION) 77
TABLE 64 EUROPE: 3D BIOPRINTING MARKET FOR CLINICAL APPLICATIONS BY TYPE, 2020β2028 (USD MILLION) 78
TABLE 65 EUROPE: 3D BIOPRINTING MARKET, BY END USER, 2020β2028 (USD MILLION) 78
TABLE 66 WESTERN EUROPE: 3D BIOPRINTING MARKET, BY COUNTRY, 2020β2028 (USD MILLION) 79
TABLE 67 WESTERN EUROPE: 3D BIOPRINTING MARKET, BY TECHNOLOGY, 2020β2028 (USD MILLION) 80
TABLE 68 WESTERN EUROPE: 3D BIOPRINTING MARKET, BY MATERIAL, 2020β2028 (USD MILLION) 80
TABLE 69 WESTERN EUROPE: 3D BIOPRINTING MARKET, BY APPLICATION, 2020β2028 (USD MILLION) 81
TABLE 70 WESTERN EUROPE: 3D BIOPRINTING MARKET FOR RESEARCH APPLICATION BY TYPE, 2020β2028 (USD MILLION) 81
TABLE 71 WESTERN EUROPE: 3D BIOPRINTING MARKET FOR CLINICAL APPLICATIONS BY TYPE, 2020β2028 (USD MILLION) 81
TABLE 72 WESTERN EUROPE: 3D BIOPRINTING MARKET, BY END USER, 2020β2028 (USD MILLION) 82
TABLE 73 GERMANY: 3D BIOPRINTING MARKET, BY TECHNOLOGY, 2020β2028 (USD MILLION) 83
TABLE 74 GERMANY: 3D BIOPRINTING MARKET, BY MATERIAL, 2020β2028 (USD MILLION) 83
TABLE 75 GERMANY: 3D BIOPRINTING MARKET, BY APPLICATION, 2020β2028 (USD MILLION) 84
TABLE 76 GERMANY: 3D BIOPRINTING MARKET FOR RESEARCH APPLICATION BY TYPE, 2020β2028 (USD MILLION) 84
TABLE 77 GERMANY: 3D BIOPRINTING MARKET FOR CLINICAL APPLICATIONS BY TYPE, 2020β2028 (USD MILLION) 84
TABLE 78 GERMANY: 3D BIOPRINTING MARKET, BY END USER, 2020β2028 (USD MILLION) 85
TABLE 79 FRANCE: 3D BIOPRINTING MARKET, BY TECHNOLOGY, 2020β2028 (USD MILLION) 85
TABLE 80 FRANCE: 3D BIOPRINTING MARKET, BY MATERIAL, 2020β2028 (USD MILLION) 86
TABLE 81 FRANCE: 3D BIOPRINTING MARKET, BY APPLICATION, 2020β2028 (USD MILLION) 86
TABLE 82 FRANCE: 3D BIOPRINTING MARKET FOR RESEARCH APPLICATION BY TYPE, 2020β2028 (USD MILLION) 86
TABLE 83 FRANCE: 3D BIOPRINTING MARKET FOR CLINICAL APPLICATIONS BY TYPE, 2020β2028 (USD MILLION) 87
TABLE 84 FRANCE: 3D BIOPRINTING MARKET, BY END USER, 2020β2028 (USD MILLION) 87
TABLE 85 U.K: 3D BIOPRINTING MARKET, BY TECHNOLOGY, 2020β2028 (USD MILLION) 88
TABLE 86 U.K: 3D BIOPRINTING MARKET, BY MATERIAL, 2020β2028 (USD MILLION) 88
TABLE 87 U.K: 3D BIOPRINTING MARKET, BY APPLICATION, 2020β2028 (USD MILLION) 89
TABLE 88 U.K: 3D BIOPRINTING MARKET FOR RESEARCH APPLICATION BY TYPE, 2020β2028 (USD MILLION) 89
TABLE 89 U.K: 3D BIOPRINTING MARKET FOR CLINICAL APPLICATIONS BY TYPE, 2020β2028 (USD MILLION) 89
TABLE 90 U.K: 3D BIOPRINTING MARKET, BY END USER, 2020β2028 (USD MILLION) 90
TABLE 91 ITALY: 3D BIOPRINTING MARKET, BY TECHNOLOGY, 2020β2028 (USD MILLION) 90
TABLE 92 ITALY: 3D BIOPRINTING MARKET, BY MATERIAL, 2020β2028 (USD MILLION) 91
TABLE 93 ITALY: 3D BIOPRINTING MARKET, BY APPLICATION, 2020β2028 (USD MILLION) 91
TABLE 94 ITALY: 3D BIOPRINTING MARKET FOR RESEARCH APPLICATION BY TYPE, 2020β2028 (USD MILLION) 91
TABLE 95 ITALY: 3D BIOPRINTING MARKET FOR CLINICAL APPLICATIONS BY TYPE, 2020β2028 (USD MILLION) 92
TABLE 96 ITALY: 3D BIOPRINTING MARKET, BY END USER, 2020β2028 (USD MILLION) 92
TABLE 97 SPAIN: 3D BIOPRINTING MARKET, BY TECHNOLOGY, 2020β2028 (USD MILLION) 93
TABLE 98 SPAIN: 3D BIOPRINTING MARKET, BY MATERIAL, 2020β2028 (USD MILLION) 93
TABLE 99 SPAIN: 3D BIOPRINTING MARKET, BY APPLICATION, 2020β2028 (USD MILLION) 94
TABLE 100 SPAIN: 3D BIOPRINTING MARKET FOR RESEARCH APPLICATION BY TYPE, 2020β2028 (USD MILLION) 94
TABLE 101 SPAIN: 3D BIOPRINTING MARKET FOR CLINICAL APPLICATIONS BY TYPE, 2020β2028 (USD MILLION) 94
TABLE 102 SPAIN: 3D BIOPRINTING MARKET, BY END USER, 2020β2028 (USD MILLION) 95
TABLE 103 REST OF WESTERN EUROPE: 3D BIOPRINTING MARKET, BY TECHNOLOGY, 2020β2028 (USD MILLION) 95
TABLE 104 REST OF WESTERN EUROPE: 3D BIOPRINTING MARKET, BY MATERIAL, 2020β2028 (USD MILLION) 96
TABLE 105 REST OF WESTERN EUROPE: 3D BIOPRINTING MARKET, BY APPLICATION, 2020β2028 (USD MILLION) 96
TABLE 106 REST OF WESTERN EUROPE: 3D BIOPRINTING MARKET FOR RESEARCH APPLICATION BY TYPE, 2020β2028 (USD MILLION) 97
TABLE 107 REST OF WESTERN EUROPE: 3D BIOPRINTING MARKET FOR CLINICAL APPLICATIONS BY TYPE, 2020β2028 (USD MILLION) 97
TABLE 108 REST OF WESTERN EUROPE: 3D BIOPRINTING MARKET, BY END USER, 2020β2028 (USD MILLION) 98
TABLE 109 EASTERN EUROPE: 3D BIOPRINTING MARKET, BY TECHNOLOGY, 2020β2028 (USD MILLION) 98
TABLE 110 EASTERN EUROPE: 3D BIOPRINTING MARKET, BY MATERIAL, 2020β2028 (USD MILLION) 99
TABLE 111 EASTERN EUROPE: 3D BIOPRINTING MARKET, BY APPLICATION, 2020β2028 (USD MILLION) 99
TABLE 112 EASTERN EUROPE: 3D BIOPRINTING MARKET FOR RESEARCH APPLICATION BY TYPE, 2020β2028 (USD MILLION) 99
TABLE 113 EASTERN EUROPE: 3D BIOPRINTING MARKET FOR CLINICAL APPLICATIONS BY TYPE, 2020β2028 (USD MILLION) 100
TABLE 114 EASTERN EUROPE: 3D BIOPRINTING MARKET, BY END USER, 2020β2028 (USD MILLION) 100
TABLE 115 ASIA-PACIFIC: 3D BIOPRINTING MARKET, BY COUNTRY, 2020β2028 (USD MILLION) 102
TABLE 116 ASIA-PACIFIC: 3D BIOPRINTING MARKET, BY TECHNOLOGY, 2020β2028 (USD MILLION) 102
TABLE 117 ASIA-PACIFIC: 3D BIOPRINTING MARKET, BY MATERIAL, 2020β2028 (USD MILLION) 103
TABLE 118 ASIA-PACIFIC: 3D BIOPRINTING MARKET, BY APPLICATION, 2020β2028 (USD MILLION) 103
TABLE 119 ASIA-PACIFIC: 3D BIOPRINTING MARKET FOR RESEARCH APPLICATION BY TYPE, 2020β2028 (USD MILLION) 103
TABLE 120 ASIA-PACIFIC: 3D BIOPRINTING MARKET FOR CLINICAL APPLICATIONS BY TYPE, 2020β2028 (USD MILLION) 104
TABLE 121 ASIA-PACIFIC: 3D BIOPRINTING MARKET, BY END USER, 2020β2028 (USD MILLION) 104
TABLE 122 JAPAN: 3D BIOPRINTING MARKET, BY TECHNOLOGY, 2020β2028 (USD MILLION) 105
TABLE 123 JAPAN: 3D BIOPRINTING MARKET, BY MATERIAL, 2020β2028 (USD MILLION) 105
TABLE 124 JAPAN: 3D BIOPRINTING MARKET, BY APPLICATION, 2020β2028 (USD MILLION) 106
TABLE 125 JAPAN: 3D BIOPRINTING MARKET FOR RESEARCH APPLICATION BY TYPE, 2020β2028 (USD MILLION) 106
TABLE 126 JAPAN: 3D BIOPRINTING MARKET FOR CLINICAL APPLICATIONS BY TYPE, 2020β2028 (USD MILLION) 106
TABLE 127 JAPAN: 3D BIOPRINTING MARKET, BY END USER, 2020β2028 (USD MILLION) 107
TABLE 128 CHINA: 3D BIOPRINTING MARKET, BY TECHNOLOGY, 2020β2028 (USD MILLION) 108
TABLE 129 CHINA: 3D BIOPRINTING MARKET, BY MATERIAL, 2020β2028 (USD MILLION) 108
TABLE 130 CHINA: 3D BIOPRINTING MARKET, BY APPLICATION, 2020β2028 (USD MILLION) 109
TABLE 131 CHINA: 3D BIOPRINTING MARKET FOR RESEARCH APPLICATION BY TYPE, 2020β2028 (USD MILLION) 109
TABLE 132 CHINA: 3D BIOPRINTING MARKET FOR CLINICAL APPLICATIONS BY TYPE, 2020β2028 (USD MILLION) 109
TABLE 133 CHINA: 3D BIOPRINTING MARKET, BY END USER, 2020β2028 (USD MILLION) 110
TABLE 134 INDIA: 3D BIOPRINTING MARKET, BY TECHNOLOGY, 2020β2028 (USD MILLION) 111
TABLE 135 INDIA: 3D BIOPRINTING MARKET, BY MATERIAL, 2020β2028 (USD MILLION) 111
TABLE 136 INDIA: 3D BIOPRINTING MARKET, BY APPLICATION, 2020β2028 (USD MILLION) 112
TABLE 137 INDIA: 3D BIOPRINTING MARKET FOR RESEARCH APPLICATION BY TYPE, 2020β2028 (USD MILLION) 112
TABLE 138 INDIA: 3D BIOPRINTING MARKET FOR CLINICAL APPLICATIONS BY TYPE, 2020β2028 (USD MILLION) 112
TABLE 139 INDIA: 3D BIOPRINTING MARKET, BY END USER, 2020β2028 (USD MILLION) 113
TABLE 140 AUSTRALIA: 3D BIOPRINTING MARKET, BY TECHNOLOGY, 2020β2028 (USD MILLION) 114
TABLE 141 AUSTRALIA: 3D BIOPRINTING MARKET, BY MATERIAL, 2020β2028 (USD MILLION) 114
TABLE 142 AUSTRALIA: 3D BIOPRINTING MARKET, BY APPLICATION, 2020β2028 (USD MILLION) 115
TABLE 143 AUSTRALIA: 3D BIOPRINTING MARKET FOR RESEARCH APPLICATION BY TYPE, 2020β2028 (USD MILLION) 115
TABLE 144 AUSTRALIA: 3D BIOPRINTING MARKET FOR CLINICAL APPLICATIONS BY TYPE, 2020β2028 (USD MILLION) 115
TABLE 145 AUSTRALIA: 3D BIOPRINTING MARKET, BY END USER, 2020β2028 (USD MILLION) 116
TABLE 146 SOUTH KOREA: 3D BIOPRINTING MARKET, BY TECHNOLOGY, 2020β2028 (USD MILLION) 116
TABLE 147 SOUTH KOREA: 3D BIOPRINTING MARKET, BY MATERIAL, 2020β2028 (USD MILLION) 117
TABLE 148 SOUTH KOREA: 3D BIOPRINTING MARKET, BY APPLICATION, 2020β2028 (USD MILLION) 117
TABLE 149 SOUTH KOREA: 3D BIOPRINTING MARKET FOR RESEARCH APPLICATION BY TYPE, 2020β2028 (USD MILLION) 117
TABLE 150 SOUTH KOREA: 3D BIOPRINTING MARKET FOR CLINICAL APPLICATIONS BY TYPE, 2020β2028 (USD MILLION) 118
TABLE 151 SOUTH KOREA: 3D BIOPRINTING MARKET, BY END USER, 2020β2028 (USD MILLION) 118
TABLE 152 REST OF ASIAβPACIFIC: 3D BIOPRINTING MARKET, BY TECHNOLOGY, 2020β2028 (USD MILLION) 119
TABLE 153 REST OF ASIAβPACIFIC: 3D BIOPRINTING MARKET, BY MATERIAL, 2020β2028 (USD MILLION) 119
TABLE 154 REST OF ASIAβPACIFIC: 3D BIOPRINTING MARKET, BY APPLICATION, 2020β2028 (USD MILLION) 120
TABLE 155 REST OF ASIAβPACIFIC: 3D BIOPRINTING MARKET FOR RESEARCH APPLICATION BY TYPE, 2020β2028 (USD MILLION) 120
TABLE 156 REST OF ASIAβPACIFIC: 3D BIOPRINTING MARKET FOR CLINICAL APPLICATIONS BY TYPE, 2020β2028 (USD MILLION) 120
TABLE 157 REST OF ASIAβPACIFIC: 3D BIOPRINTING MARKET, BY END USER, 2020β2028 (USD MILLION) 121
TABLE 158 MIDDLE EAST AND AFRICA: 3D BIOPRINTING MARKET, BY REGION, 2020β2028 (USD MILLION) 122
TABLE 159 MIDDLE EAST AND AFRICA: 3D BIOPRINTING MARKET, BY TECHNOLOGY, 2020β2028 (USD MILLION) 123
TABLE 160 MIDDLE EAST AND AFRICA: 3D BIOPRINTING MARKET, BY MATERIAL, 2020β2028 (USD MILLION) 123
TABLE 161 MIDDLE EAST AND AFRICA: 3D BIOPRINTING MARKET, BY APPLICATION, 2020β2028 (USD MILLION) 124
TABLE 162 MIDDLE EAST AND AFRICA: 3D BIOPRINTING MARKET FOR RESEARCH APPLICATION BY TYPE, 2020β2028 (USD MILLION) 124
TABLE 163 MIDDLE EAST AND AFRICA: 3D BIOPRINTING MARKET FOR CLINICAL APPLICATIONS BY TYPE, 2020β2028 (USD MILLION) 124
TABLE 164 MIDDLE EAST AND AFRICA: 3D BIOPRINTING MARKET, BY END USER, 2020β2028 (USD MILLION) 125
TABLE 165 MIDDLE EAST: 3D BIOPRINTING MARKET, BY TECHNOLOGY, 2020β2028 (USD MILLION) 126
TABLE 166 MIDDLE EAST: 3D BIOPRINTING MARKET, BY MATERIAL, 2020β2028 (USD MILLION) 126
TABLE 167 MIDDLE EAST: 3D BIOPRINTING MARKET, BY APPLICATION, 2020β2028 (USD MILLION) 127
TABLE 168 MIDDLE EAST: 3D BIOPRINTING MARKET FOR RESEARCH APPLICATION BY TYPE, 2020β2028 (USD MILLION) 127
TABLE 169 MIDDLE EAST: 3D BIOPRINTING MARKET FOR CLINICAL APPLICATIONS BY TYPE, 2020β2028 (USD MILLION) 127
TABLE 170 MIDDLE EAST: 3D BIOPRINTING MARKET, BY END USER, 2020β2028 (USD MILLION) 128
TABLE 171 AFRICA: 3D BIOPRINTING MARKET, BY TECHNOLOGY, 2020β2028 (USD MILLION) 129
TABLE 172 AFRICA: 3D BIOPRINTING MARKET, BY MATERIAL, 2020β2028 (USD MILLION) 129
TABLE 173 AFRICA: 3D BIOPRINTING MARKET, BY APPLICATION, 2020β2028 (USD MILLION) 130
TABLE 174 AFRICA: 3D BIOPRINTING MARKET FOR RESEARCH APPLICATION BY TYPE, 2020β2028 (USD MILLION) 130
TABLE 175 AFRICA: 3D BIOPRINTING MARKET FOR CLINICAL APPLICATIONS BY TYPE, 2020β2028 (USD MILLION) 130
TABLE 176 AFRICA: 3D BIOPRINTING MARKET, BY END USER, 2020β2028 (USD MILLION) 131
16 List of Figures
FIGURE 1 RESEARCH PROCESS 21
FIGURE 2 TOP-DOWN & BOTTOM-UP APPROACH 26
FIGURE 3 MARKET DYNAMICS: ANALYSIS OF THE GLOBAL 3D BIOPRINTING MARKET 28
FIGURE 4 PORTERβS FIVE FORCES ANALYSIS: GLOBAL 3D BIOPRINTING MARKET 32
FIGURE 5 SUPPLY CHAIN: GLOBAL 3D BIOPRINTING MARKET 34
FIGURE 6 GLOBAL 3D BIOPRINTING MARKET SHARE, BY TECHNOLOGY, 2020 (%) 37
FIGURE 7 GLOBAL 3D BIOPRINTING MARKET, BY TECHNOLOGY, 2020 & 2028 (USD MILLION) 37
FIGURE 8 GLOBAL 3D BIOPRINTING MARKET SHARE, BY MATERIAL, 2020 (%) 42
FIGURE 9 GLOBAL 3D BIOPRINTING MARKET, BY MATERIAL, 2020 & 2028 (USD MILLION) 42
FIGURE 10 GLOBAL 3D BIOPRINTING MARKET SHARE, BY APPLICATION, 2020 (%) 47
FIGURE 11 GLOBAL 3D BIOPRINTING MARKET, BY APPLICATION, 2020 & 2028 (USD MILLION) 47
FIGURE 12 GLOBAL 3D BIOPRINTING MARKET SHARE, BY END USER, 2020 (%) 54
FIGURE 13 GLOBAL 3D BIOPRINTING MARKET, BY END USER, 2020 & 2028 (USD MILLION) 54
FIGURE 14 GLOBAL 3D BIOPRINTING MARKET, BY REGION, 2020 & 2028 (USD MILLION) 58
FIGURE 15 GLOBAL 3D BIOPRINTING MARKET SHARE, BY REGION, 2020 (%) 59
FIGURE 16 AMERICAS: 3D BIOPRINTING MARKET SHARE, BY REGION, 2020 (%) 60
FIGURE 17 NORTH AMERICA: 3D BIOPRINTING MARKET SHARE, BY COUNTRY, 2020 (%) 63
FIGURE 18 EUROPE: 3D BIOPRINTING MARKET SHARE, BY REGION, 2020 (%) 75
FIGURE 19 WESTERN EUROPE: 3D BIOPRINTING MARKET SHARE, BY COUNTRY, 2020 (%) 79
FIGURE 20 ASIA-PACIFIC: 3D BIOPRINTING MARKET SHARE, BY COUNTRY, 2020 (%) 101
FIGURE 21 MIDDLE EAST AND AFRICA: 3D BIOPRINTING MARKET SHARE, BY REGION, 2020 (%) 122
$4.3 Billion
15.5%
Asia Pacific
2022-2030
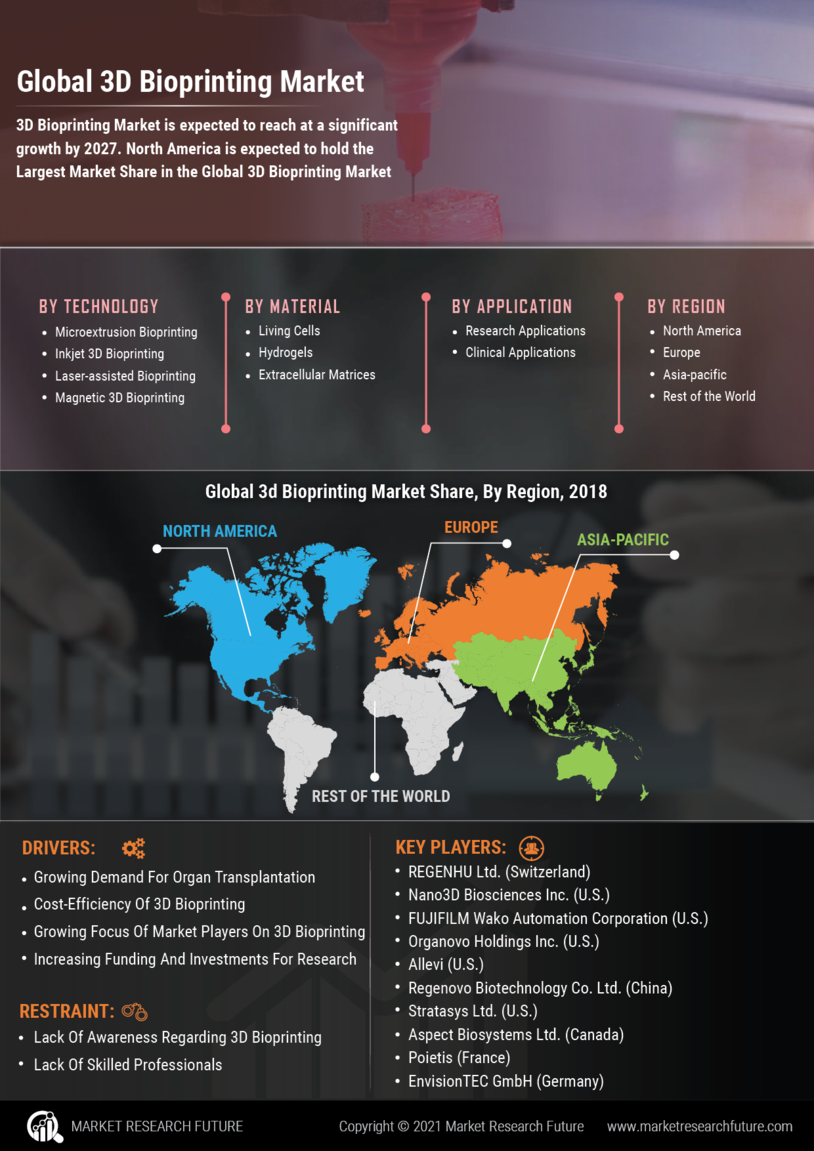
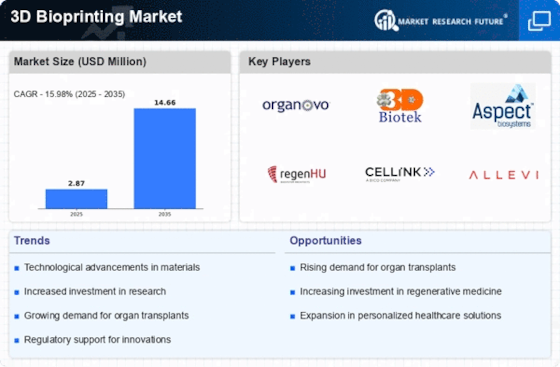
The 3D bioprinting market share is expected to undergo major enhancements for the current forecast period of 2021-2028. Owing to the market development and technological advancements, the market share is expected to reach USD 4.3 Billion by 2028 at a CAGR of 15.5%.
The advancement and degree of digitization in 3D biomaterials and bioprinting is increasing at a high scale in the cosmetology and pharmaceutical industry and this factor is being backed by the rise of the availability of funds for the public and private sector. Also, the rising support for bioprinting research activities is on the roll that promises good growth for the 3D bioprinting during the upcoming years.
COVID 19 Analysis
The novel coronavirus was reported in November 2019 in China and its arrival has changed the face of normal living ever since. The pandemic has introduced new trends for people to continue living their life and also, brought a major change for businesses and their functioning to meet the propelling demand of the target audience that is spread in various global locations. The businesses are witnessing a major issue in meeting the demand of the target audience and hence, the 3D bioprinting market segments in various global regions are struggling, too. This is because there is a lack of the availability of skilled labor and further, there is no or very little raw material available. The absence of these is a major problem in keeping up with the production trends. The pandemic is spreading at an obnoxious rate and hence, the people are changing their preferences that have an effect on their lifestyle, as well.
However, the governments are considering the rate of the spread and also, coming to terms with the fact that deep measures are required for the development of measures that will help in reviving the demand and bringing stability. The market players are considering the rise of the 3D printing market trend and hence, developing, products, services, and solutions that promise positive attributes to the market operations during the forecast period of 2021-2028.
3D Bioprinting Market Dynamics
Drivers
The technology related to 3D bioprinting has been witnessing a huge rate of adoption in the recent past and mainly in the healthcare industry. Bioprinting has witnessed a huge momentum in the form of a promising technology for its relation with the ability of tissue fabrication for artificial tissues and organs. This is all set to revolutionize the world of diagnosis and help in the treatment of many kinds of medical conditions. Companies across the world are soaring high on innovation and creativity that will help in coming up with regenerative medicine along with their concept solutions related to tissue engineering, stem cell therapies, alongside drug therapies.
Restraints
The concept is an emerging field in the healthcare industry and is subject to constant development and advancements. This is generating a huge demand for the deployment of skilled professionals who have the expertise and are efficient enough to operate the 3D printing systems. The effective use of this technology demands a continuous process of monitoring which is only possible with an expert. However, the expert finding is a tedious task that is likely to hamper the growth of the 3D bioprinting market operations during the ongoing forecast period.
Technology Analysis
There has been an increase in the stem cell research activities conducted and the financial support that is pouring from various organizations is one of the major advancements that is pushing for the regenerative medicine demand and the overall industry in various parts across the globe. The developing countries are on their way to making a supportive and regulatory environment available that supports the presence of larger product pipelines and applications related to medicine availability to treat diseases are some of the factors that will benefit the audience and help in expanding the 3D bioprinting market operations.
Study Objectives
3D Bioprinting Market Segment Overview
The 3D bioprinting of tissues and organs is prominent in major regions in the form of market segments. The market segments are as follows:
Based on the components
The 3D bioprinting market components are 3D bioprinters and bioinks which are further divided into inkjet 3d bioprinting, hybrid bioinks, magnetic 3D bioprinting, and synthetic bioinks, amongst others.
Based on the application
The 3D bioprinting market applications are drug research, 3D cell structure, medicine, and clinical application.
Based on material
The 3D bioprinting market materials include extracellular matrices, living cells, hydrogels, and other biomaterials.
3D Bioprinting Market Regional Analysis
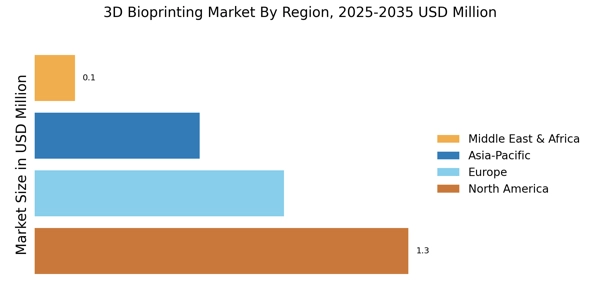
Based on the 3D bioprinting industry analysis, the APAC region is expected to undergo the maximum demand and lead the market operations by attaining a global CAGR of 23.1%. The market is witnessing a high adoption rate of stem cell research in several regional markets that are providing opportunities and growth ideas for the market players. Also, government support is rising that will help the region to take a step forward towards competing in the international market.
3D Bioprinting Market Competitive Landscape
Based on the marketability to meet the rising global demand and the recent developments undertaken at a competitive rate, the market operations include the efforts of the following market players:
Recent Developments
3D Bioprinting Market Report Overview
The global market report aims to develop a deep understanding of the 3D bioprinting market potential and hence, tries to get the market insights and predict the growth rate of the market and the attainable market revenue during the forecast period. The report covers the following aspects in detail:
The global report discusses the potential of the market segments to keep up the demand of the market in various regions like the US, Canada, Mexico, India, Japan, Russia, Thailand, and South Korea, amongst others. The report also highlights the market trends in major global regions that will help the players and the competitive players in those regions dominate the global growth of the market by the end of the forecast period in 2028. Also, the report discusses the attempts undertaken by the market players and regions to enlarge their market size and strive for a better demand quantum.
Report Attribute/Metric | Details |
---|---|
Market Size | 2028: USD 4.3 Billion |
CAGR | 15.5% (2021-2028) |
Base Year | 2019 |
Forecast Period | 2020-2028 |
Historical Data | 2018 |
Forecast Units | Value (USD Billion) |
Report Coverage | Revenue Forecast, Competitive Landscape, Growth Factors, and Trends |
Segments Covered | Technology, Material, Application, and End-user |
Geographies Covered | North America, Europe, Asia-Pacific, and Rest of the World (RoW) |
Key Vendors | REGENHU Ltd. (Switzerland), Nano3D Biosciences Inc. (U.S.), FUJIFILM Wako Automation Corporation (U.S.), Organovo Holdings Inc. (U.S.), Allevi (U.S.), Regenovo Biotechnology Co. Ltd. (China), Stratasys Ltd. (U.S.), Aspect Biosystems Ltd. (Canada), Poietis (France), EnvisionTEC GmbH (Germany), Cellink AB (Sweden), Cyfuse Biomedical K.K. (Japan) |
Key Market Opportunities | Growing Application of 3D Bioprinting in Cosmetic Industry |
Key Market Drivers | Growing Demand for Organ Transplantation |
Frequently Asked Questions (FAQ) :
3D bioprinting encompasses an array of 3D printing methods to combine cells and biomaterials to produce biomedical parts. Although the technology is in high use for research and development purposes, its application in the production of tissues and organs is likely to garner high demand.
The 3D Bioprinting Market is predicted to touch USD 4.3 Billion by 2028.
The 3D Bioprinting Market is projected to grow at a 15.5% CAGR between 2021-2028.
The Americas are projected to have a major share in the 3D Bioprinting Market.
Growing demand for organ transplantation is Boosting Market growth.
Lack of skilled professionals and lack of awareness may limit market growth.