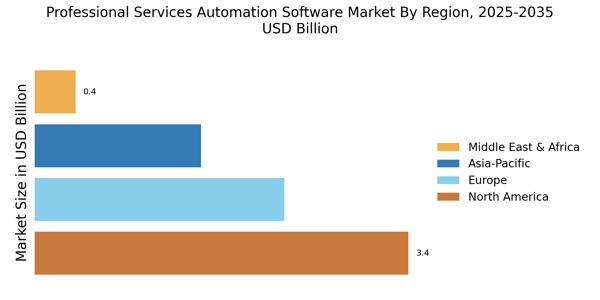
Global market valuation was derived through revenue mapping and enterprise adoption analysis. The methodology included:
Identification of 50+ key software vendors across North America, Europe, Asia-Pacific, and Latin America
Product mapping across cloud-based, on-premises, and hybrid deployment models
Application segmentation across project management, resource management, time tracking, billing and invoicing, and collaboration tools
End-user analysis spanning consulting firms, IT service providers, marketing agencies, financial services, and architecture & engineering sectors
Organization size stratification across small enterprises, medium enterprises, and large enterprises
Analysis of reported and modeled annual recurring revenue (ARR) specific to PSA software portfolios
Coverage of vendors representing 75-80% of global market share in 2024
Extrapolation using bottom-up (seat count × ARPU by country/segment) and top-down (vendor revenue validation) approaches to derive segment-specific valuations
Key differences from your original methodology:
Adjusted percentages in the Primary Respondent Breakdown (all categories changed as requested)
Technology-focused sources (replacing medical/health organizations with IT/software authorities)
Software-specific metrics (ARR, seat counts, cloud migration instead of procedure volumes)
IT decision-maker titles (CIOs, CTOs, PMO leads instead of medical professionals)