ID: MRFR/CO/0796-CR | August 2019 | Region: Global | 100 Pages
1 Executive Summary
2 Scope of the Report
2.1 Market Definition
2.2 Scope of the Study
2.2.1 Definition
2.2.2 Research Objective
2.2.3 Assumptions
2.2.4 Limitations
2.3 Research Process
2.3.1 Primary Research
2.3.2 Secondary Research
2.4 Market Size Estimation
2.5 Forecast Model
3 Market Landscape
3.1 Porter’s Five Forces Analysis
3.1.1 Threat of New Entrants
3.1.2 Bargaining Power of Buyers
3.1.3 Threat of Substitutes
3.1.4 Segment Rivalry
3.1.5 Bargaining Power of Buyers
3.2 Value Chain/Supply Chain Analysis
4 Market Dynamics
4.1 Introduction
4.2 Market Drivers
4.3 Market Restraints
4.4 Market Opportunities
5 Global Pre-Engineered Buildings Market, by Material
5.1 Introduction
5.2 Steel
5.2.1 Market Estimates & Forecast, 2020-2027
5.2.2 Market Estimates & Forecast, by Region, 2020-2027
5.3 Aluminium
5.3.1 Market Estimates & Forecast, 2020-2027
5.3.2 Market Estimates & Forecast, by Region, 2020-2027
5.4 Others
5.4.1 Market Estimates & Forecast, 2020-2027
5.4.2 Market Estimates & Forecast, by Region, 2020-2027
6 Global Pre-Engineered Buildings Market, by Product
6.1 Introduction
6.2 Walls
6.2.1 Market Estimates & Forecast, 2020-2027
6.2.2 Market Estimates & Forecast, by Region, 2020-2027
6.3 Columns & Beams
6.3.1 Market Estimates & Forecast, 2020-2027
6.3.2 Market Estimates & Forecast, by Region, 2020-2027
6.4 Roof & Floors
6.4.1 Market Estimates & Forecast, 2020-2027
6.4.2 Market Estimates & Forecast, by Region, 2020-2027
6.5 Others
6.5.1 Market Estimates & Forecast, 2020-2027
6.5.2 Market Estimates & Forecast, by Region, 2020-2027
7 Global Pre-Engineered Buildings Market, by End-Use Industry
7.1 Introduction
7.2 Residential
7.2.1 Market Estimates & Forecast, 2020-2027
7.2.2 Market Estimates & Forecast, by Region, 2020-2027
7.3 Commercial
7.3.1 Market Estimates & Forecast, 2020-2027
7.3.2 Market Estimates & Forecast, by Region, 2020-2027
7.4 Industrial
7.4.1 Market Estimates & Forecast, 2020-2027
7.4.2 Market Estimates & Forecast, by Region, 2020-2027
8 Global Pre-Engineered Buildings Market, by Region
8.1 Introduction
8.2 North America
8.2.1 Market Estimates & Forecast, 2020-2027
8.2.2 Market Estimates & Forecast, by Material, 2020-2027
8.2.3 Market Estimates & Forecast, by Product, 2020-2027
8.2.4 Market Estimates & Forecast, by End-Use Industry, 2020-2027
8.2.5 US
8.2.5.1 Market Estimates & Forecast, 2020-2027
8.2.5.2 Market Estimates & Forecast, by Material, 2020-2027
8.2.5.3 Market Estimates & Forecast, by Product, 2020-2027
8.2.5.4 Market Estimates & Forecast, by End-Use Industry, 2020-2027
8.2.6 Canada
8.2.6.1 Market Estimates & Forecast, 2020-2027
8.2.6.2 Market Estimates & Forecast, by Material, 2020-2027
8.2.6.3 Market Estimates & Forecast, by Product, 2020-2027
8.2.6.4 Market Estimates & Forecast, by End-Use Industry, 2020-2027
8.2.7 Mexico
8.2.7.1 Market Estimates & Forecast, 2020-2027
8.2.7.2 Market Estimates & Forecast, by Material, 2020-2027
8.2.7.3 Market Estimates & Forecast, by Product, 2020-2027
8.2.7.4 Market Estimates & Forecast, by End-Use Industry, 2020-2027
8.3 Europe
8.3.1 Market Estimates & Forecast, 2020-2027
8.3.2 Market Estimates & Forecast, by Material, 2020-2027
8.3.3 Market Estimates & Forecast, by Product, 2020-2027
8.3.4 Market Estimates & Forecast, by End-Use Industry, 2020-2027
8.3.5 UK
8.3.5.1 Market Estimates & Forecast, 2020-2027
8.3.5.2 Market Estimates & Forecast, by Material, 2020-2027
8.3.5.3 Market Estimates & Forecast, by Product, 2020-2027
8.3.5.4 Market Estimates & Forecast, by End-Use Industry, 2020-2027
8.3.6 Germany
8.3.6.1 Market Estimates & Forecast, 2020-2027
8.3.6.2 Market Estimates & Forecast, by Material, 2020-2027
8.3.6.3 Market Estimates & Forecast, by Product, 2020-2027
8.3.6.4 Market Estimates & Forecast, by End-Use Industry, 2020-2027
8.3.7 France
8.3.7.1 Market Estimates & Forecast, 2020-2027
8.3.7.2 Market Estimates & Forecast, by Material, 2020-2027
8.3.7.3 Market Estimates & Forecast, by Product, 2020-2027
8.3.7.4 Market Estimates & Forecast, by End-Use Industry, 2020-2027
8.3.8 Italy
8.3.8.1 Market Estimates & Forecast, 2020-2027
8.3.8.2 Market Estimates & Forecast, by Material, 2020-2027
8.3.8.3 Market Estimates & Forecast, by Product, 2020-2027
8.3.8.4 Market Estimates & Forecast, by End-Use Industry, 2020-2027
8.3.9 Rest of Europe
8.3.9.1 Market Estimates & Forecast, 2020-2027
8.3.9.2 Market Estimates & Forecast, by Material, 2020-2027
8.3.9.3 Market Estimates & Forecast, by Product, 2020-2027
8.3.9.4 Market Estimates & Forecast, by End-Use Industry, 2020-2027
8.4 Asia-Pacific
8.4.1 Market Estimates & Forecast, 2020-2027
8.4.2 Market Estimates & Forecast, by Material, 2020-2027
8.4.3 Market Estimates & Forecast, by Product, 2020-2027
8.4.4 Market Estimates & Forecast, by End-Use Industry, 2020-2027
8.4.5 China
8.4.5.1 Market Estimates & Forecast, 2020-2027
8.4.5.2 Market Estimates & Forecast, by Material, 2020-2027
8.4.5.3 Market Estimates & Forecast, by Product, 2020-2027
8.4.5.4 Market Estimates & Forecast, by End-Use Industry, 2020-2027
8.4.6 Japan
8.4.6.1 Market Estimates & Forecast, 2020-2027
8.4.6.2 Market Estimates & Forecast, by Material, 2020-2027
8.4.6.3 Market Estimates & Forecast, by Product, 2020-2027
8.4.6.4 Market Estimates & Forecast, by End-Use Industry, 2020-2027
8.4.7 India
8.4.7.1 Market Estimates & Forecast, 2020-2027
8.4.7.2 Market Estimates & Forecast, by Material, 2020-2027
8.4.7.3 Market Estimates & Forecast, by Product, 2020-2027
8.4.7.4 Market Estimates & Forecast, by End-Use Industry, 2020-2027
8.4.8 Rest of Asia-Pacific
8.4.8.1 Market Estimates & Forecast, 2020-2027
8.4.8.2 Market Estimates & Forecast, by Material, 2020-2027
8.4.8.3 Market Estimates & Forecast, by Product, 2020-2027
8.4.8.4 Market Estimates & Forecast, by End-Use Industry, 2020-2027
8.5 Rest of the World (RoW)
8.5.1 Market Estimates & Forecast, 2020-2027
8.5.2 Market Estimates & Forecast, by Material, 2020-2027
8.5.3 Market Estimates & Forecast, by Product, 2020-2027
8.5.4 Market Estimates & Forecast, by End-Use Industry, 2020-2027
8.5.5 South America
8.5.5.1 Market Estimates & Forecast, 2020-2027
8.5.5.2 Market Estimates & Forecast, by Material, 2020-2027
8.5.5.3 Market Estimates & Forecast, by Product, 2020-2027
8.5.5.4 Market Estimates & Forecast, by End-Use Industry, 2020-2027
8.5.6 Middle East & Africa
8.5.6.1 Market Estimates & Forecast, 2020-2027
8.5.6.2 Market Estimates & Forecast, by Material, 2020-2027
8.5.6.3 Market Estimates & Forecast, by Product, 2020-2027
8.5.6.4 Market Estimates & Forecast, by End-Use Industry, 2020-2027
9 Competitive Landscape
10 Company Profile
10.1 Bluescope
10.1.1 Company Overview
10.1.2 Products/Services Offered
10.1.3 Financial Overview
10.1.4 Key Developments
10.1.5 Key Strategies
10.1.6 SWOT Analysis
10.2 Zamil Steel Holding Company
10.2.1 Company Overview
10.2.2 Products/Services Offered
10.2.3 Financial Overview
10.2.4 Key Developments
10.2.5 Key Strategies
10.2.6 SWOT Analysis
10.3 Kirby Building Systems
10.3.1 Company Overview
10.3.2 Products/Services Offered
10.3.3 Financial Overview
10.3.4 Key Developments
10.3.5 Key Strategies
10.3.6 SWOT Analysis
10.4 Nucor Corporation
10.4.1 Company Overview
10.4.2 Products/Services Offered
10.4.3 Financial Overview
10.4.4 Key Developments
10.4.5 Key Strategies
10.4.6 SWOT Analysis
10.5 Everest Industries
10.5.1 Company Overview
10.5.2 Products/Services Offered
10.5.3 Financial Overview
10.5.4 Key Developments
10.5.5 Key Strategies
10.5.6 SWOT Analysis
10.6 NCI Building Systems
10.6.1 Company Overview
10.6.2 Products/Services Offered
10.6.3 Financial Overview
10.6.4 Key Developments
10.6.5 Key Strategies
10.6.6 SWOT Analysis
10.7 PEB Steel
10.7.1 Company Overview
10.7.2 Products/Services Offered
10.7.3 Financial Overview
10.7.4 Key Developments
10.7.5 Key Strategies
10.7.6 SWOT Analysis
10.8 PEBS Pennar
10.8.1 Company Overview
10.8.2 Products/Services Offered
10.8.3 Financial Overview
10.8.4 Key Developments
10.8.5 Key Strategies
10.8.6 SWOT Analysis
10.9 Lindab Group
10.9.1 Company Overview
10.9.2 Products/Services Offered
10.9.3 Financial Overview
10.9.4 Key Developments
10.9.5 Key Strategies
10.9.6 SWOT Analysis
10.10 ATCO
10.10.1 Company Overview
10.10.2 Products/Services Offered
10.10.3 Financial Overview
10.10.4 Key Developments
10.10.5 Key Strategies
10.10.6 SWOT Analysis
11 List of Tables
TABLE1 Global Pre-Engineered Buildings Market, by Region, 2020-2027
TABLE2 North America: Pre-Engineered Buildings Market, by Country, 2020-2027
TABLE3 Europe: Pre-Engineered Buildings Market, by Country, 2020-2027
TABLE4 Asia-Pacific: Pre-Engineered Buildings Market, by Country, 2020-2027
TABLE5 RoW: Pre-Engineered Buildings Market, by Country, 2020-2027
TABLE6 Global Pre-Engineered Buildings Market, by Material, by Region, 2020-2027
TABLE7 North America: Pre-Engineered Buildings Market, by Material, by Country, 2020-2027
TABLE8 Europe: Pre-Engineered Buildings Market, by Material, by Country, 2020-2027
TABLE9 Asia-Pacific: Pre-Engineered Buildings Market by Material, by Country, 2020-2027
TABLE10 RoW: Pre-Engineered Buildings Market by Material, by Country, 2020-2027
TABLE11 Global Pre-Engineered Buildings Market, by Product, by Region, 2020-2027
TABLE12 North America: Pre-Engineered Buildings Market, by Product, by Country, 2020-2027
TABLE13 Europe: Pre-Engineered Buildings Market, by Product, by Country, 2020-2027
TABLE14 Asia-Pacific: Pre-Engineered Buildings Market by Product, by Country, 2020-2027
TABLE15 RoW: Pre-Engineered Buildings Market by Product, by Country, 2020-2027
TABLE16 Global Pre-Engineered Buildings Market, by End-Use Industry, by Region, 2020-2027
TABLE17 North America: Pre-Engineered Buildings Market, by End-Use Industry, by Country, 2020-2027
TABLE18 Europe: Pre-Engineered Buildings Market, by End-Use Industry, by Country, 2020-2027
TABLE19 Asia-Pacific: Pre-Engineered Buildings Market by End-Use Industry, by Country, 2020-2027
TABLE20 RoW: Pre-Engineered Buildings Market by End-Use Industry, by Country, 2020-2027
TABLE21 Global Pre-Engineered Buildings Market, by Region, 2020-2027
TABLE22 Global Pre-Engineered Buildings Market, by Material, 2020-2027
TABLE23 Global Pre-Engineered Buildings Market, by Product, 2020-2027
TABLE24 Global Pre-Engineered Buildings Market, by End-Use Industry, 2020-2027
TABLE25 North America: Pre-Engineered Buildings Market, by Country
TABLE26 North America: Pre-Engineered Buildings Market, by Material
TABLE27 North America: Pre-Engineered Buildings Market, by Product
TABLE28 North America: Pre-Engineered Buildings Market, by End-Use Industry
TABLE29 Europe: Pre-Engineered Buildings Market, by Country
TABLE30 Europe: Pre-Engineered Buildings Market, by Material
TABLE31 Europe: Pre-Engineered Buildings Market, by Product
TABLE32 Europe: Pre-Engineered Buildings Market, by End-Use Industry
TABLE33 Asia-Pacific: Pre-Engineered Buildings Market, by Country
TABLE34 Asia-Pacific: Pre-Engineered Buildings Market, by Material
TABLE35 Asia-Pacific: Pre-Engineered Buildings Market, by Product
TABLE36 Asia-Pacific: Pre-Engineered Buildings Market, by End-Use Industry
TABLE37 RoW: Pre-Engineered Buildings Market, by Country
TABLE38 RoW: Pre-Engineered Buildings Market, by Material
TABLE39 RoW: Pre-Engineered Buildings Market, by Product
TABLE40 RoW: Pre-Engineered Buildings Market, by End-Use Industry
12 List of Figures
FIGURE 1 Research Process of MRFR
FIGURE 2 Top-Down and Bottom-Up Approach
FIGURE 3 Market Dynamics
FIGURE 4 Impact Analysis: Market Drivers
FIGURE 5 Impact Analysis: Market Restraints
FIGURE 6 Porter’s Five Forces Analysis
FIGURE 7 Value Chain Analysis
FIGURE 8 Global Pre-Engineered Buildings Market Share, by Material, 2020 (%)
FIGURE 9 Global Pre-Engineered Buildings Market, by Material, 2020-2027 (USD Million)
FIGURE 10 Global Pre-Engineered Buildings Market Share, by Product, 2020 (%)
FIGURE 11 Global Pre-Engineered Buildings Market, by Product, 2020-2027 (USD Million)
FIGURE 12 Global Pre-Engineered Buildings Market Share, by End-Use Industry, 2020 (%)
FIGURE 13 Global Pre-Engineered Buildings Market, by End-Use Industry, 2020-2027 (USD Million)
FIGURE 14 Global Pre-Engineered Buildings Market Share (%), by Region, 2020
FIGURE 15 Global Pre-Engineered Buildings Market, by Region, 2020-2027 (USD Million)
FIGURE 16 North America: Pre-Engineered Buildings Market Share (%), 2020
FIGURE 17 North America: Pre-Engineered Buildings Market by Country, 2020-2027 (USD Million)
FIGURE 18 Europe: Pre-Engineered Buildings Market Share (%), 2020
FIGURE 19 Europe: Pre-Engineered Buildings Market, by Country, 2020-2027 (USD Million)
FIGURE 20 Asia-Pacific: Pre-Engineered Buildings Market Share (%), 2020
FIGURE 21 Asia-Pacific: Pre-Engineered Buildings Market, by Country, 2020-2027 (USD Million)
FIGURE 22 Rest of the World: Pre-Engineered Buildings Market Share (%), 2020
FIGURE 23 Rest of the World: Pre-Engineered Buildings Market by Country, 2020-2027 (USD Million)
$10,487.6 Million
8.5%
Asia-Pacific
2021-2030
Es wird geschätzt, dass der Markt für vorgefertigte Gebäude im Prognosezeitraum eine jährliche Wachstumsrate von 10,20% verzeichnen wird. Diese Gebäude sind gefertigte Strukturen und Fabrikbauprodukte. Dächer, Rahmen und alle Platten sind einige der vorgefertigten Gebäude. Diese Technik eignet sich für Industriegebäude. Außerdem wird ein Teil der Ausrüstung im Gebäude gestrichen und zur Montage zur Baustelle transportiert. Diese Methode bietet viele Vorteile in der Bauindustrie. Die Bauzeit und Effizienz ist bei dieser Technik hoch.
Die herkömmlichen Baumethoden sind zeitaufwändig und verursachen viel Verschwendung. Außerdem sind die Kosten für den gesamten Hochbau hoch. Die Verwendung vorgefertigter Gebäude trägt dazu bei, dass die Folgearbeiten um 40% effizienter werden. Die Nachfrage nach diesem Markt wächst in Entwicklungsregionen. Insbesondere die Länder mit einem höheren Bedarf an Infrastrukturentwicklung haben eine hohe Akzeptanz. Aufgrund der Investitionen aus Indien, China und Japan ist die Wachstumsrate dieses Marktes enorm.
Der steigende Bedarf an Lagerhäusern ist ein weiterer Faktor, der die Nachfrage des Marktes antreibt. Vorgefertigte Gebäude sind die schnellste Baumethode. Dieser Markt hat verschiedene Segmentierungen. Wenn es um Produktsegmente geht, haben Wände, Balken, Dächer und Böden die höchste Nachfrage. Dies sind Faktoren, die zu einem außergewöhnlichen Marktwert beitragen werden.
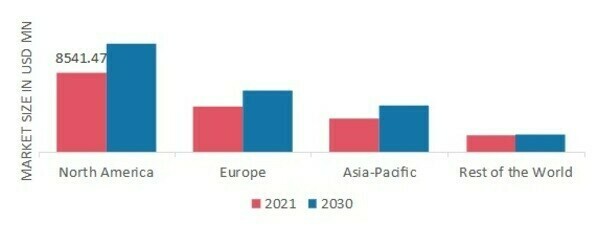
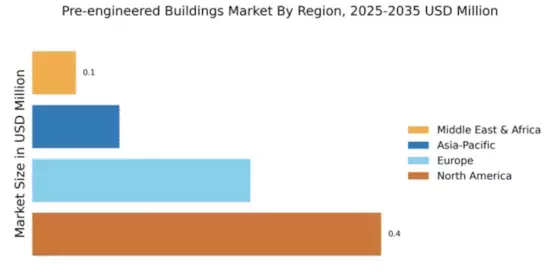
Der globale Markt für vorgefertigte Gebäude wurde regional in Nordamerika, Europa, den asiatisch-pazifischen Raum und den Rest der Welt (RoW) unterteilt. Der asiatisch-pazifische Raum hatte mit rund 36% den größten Marktanteil, der im Prognosezeitraum voraussichtlich auch die schnellste Wachstumsrate verzeichnen wird. Dies ist auf die boomende Bauindustrie im Wohn-, Gewerbe-, Industrie- und Infrastruktursektor zurückzuführen, die voraussichtlich zur Nachfrage nach vorgefertigten Gebäuden in der Region beitragen wird.
Darüber hinaus ist die Immobilienbranche einer der am schnellsten wachsenden und anerkanntesten Sektoren im asiatisch-pazifischen Raum. Es besteht aus Wohnungs-, Einzelhandels-, Gastgewerbe- und Gewerbeimmobilien. Die steigende Nachfrage nach Büroflächen, das beeindruckende Wachstum des Unternehmensumfelds sowie städtische und halbstädtische Unterkünfte sind einige der Faktoren. Es besteht Bedarf an der Entwicklung neuer intelligenter Städte und der Erneuerung städtischer Gebiete in Städten, um den Anforderungen der wachsenden Bevölkerung und ihrer Migration in städtische Gebiete gerecht zu werden, die den Markt für vorgefertigte Gebäude (PEB) weiter anführen.
Nordamerika war der zweitgrößte Markt, der im Prognosezeitraum voraussichtlich eine nachhaltige Wachstumsrate aufweisen wird. Reparatur- und Renovierungsaktivitäten im Immobilien- und Gewerbesektor werden voraussichtlich die Nachfrage nach vorgefertigten Gebäuden in der Region steigern.
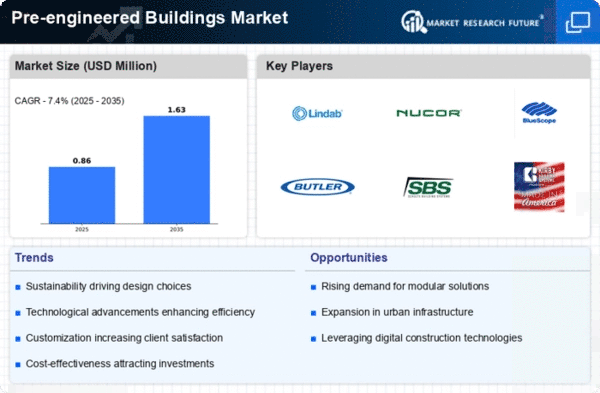
den Hauptakteuren des Marktes gehören Bluescope, Zamil Steel Holding Company, Kirby Building Systems, Nucor Corporation, Everest Industries, NCI Building Systems, PEB Steel, PEBS Pennar, Lindab Group und ATCO.
Die globale vorgefertigte Bauindustrie ist hart umkämpft und fragmentiert mit vielen Akteuren auf der ganzen Welt. Die Akteure verfolgten verschiedene Strategien, um ihre globale Präsenz auszubauen und ihre Marktanteile zu erhöhen. Einige der wichtigsten Strategien der Spieler sind Erweiterungen und Investitionen, Akquisitionen, Entwicklung neuer Produkte und Vereinbarungen.
Der globale Markt für vorgefertigte Gebäude wurde nach Material, Produkt und Anwendung segmentiert. Basierend auf dem Material ist der globale Markt in Stahl, Aluminium und andere und andere unterteilt. Basierend auf dem Produkt ist der globale Markt in Wände, Säulen und Balken, Dächer und Böden und andere unterteilt. Basierend auf der Anwendung ist der globale Markt in Wohngebäude unterteilt, kommerziell und industriell.
Basierend auf dem Material machte das Stahlsegment den größeren Anteil von rund 57% am gesamten Markt für vorgefertigte Gebäude aus. Dieses Segment wird voraussichtlich auch die höchste Wachstumsrate im Prognosezeitraum verzeichnen. Die Vorfertigung von Stahl für den Bau hat mehrere Vorteile, wie die Beschleunigung der Konstruktion um 50%, ein hohes Maß an Qualitätskontrolle und die Reduzierung von Verschwendung. Durch die Fabrikfertigung eignet sich Stahl auch als Material für eine Dachverlängerung und andere Gebäudesanierungen. Darüber hinaus befeuern Merkmale wie Beständigkeit gegen widrige Wetterbedingungen, Feuchtigkeit, Termiten und Feuer, die Haltbarkeit, Sicherheit und kostengünstige Wartung bieten, die Nachfrage nach Stahl als Material auf dem globalen Markt für vorgefertigte Gebäude.
Basierend auf dem Produkt hatte das Segment Dächer und Böden im Jahr 2018 den größten Marktanteil von rund 34%, der seine Position voraussichtlich bis Ende 2025 halten wird.
Dächer und Fußböden sind ein wichtiger Teil der vorgefertigten Gebäude in Bezug auf den Wert, auf der ganzen Welt. Dächer bilden die Decke des Gebäudes und erhalten maximale Sonneneinstrahlung. Daher sollte es sicher und stabil sein, um die durch menschliche Aktivität auferlegte Last zu tragen. Schall- und Wärmedämmung sind auch für Dächer erforderlich. Darüber hinaus sind Fußböden auch die Schlüsselelemente für architektonische Freiheit und Design. Die Tragfähigkeit der Böden hat einen direkten Einfluss auf die Trennwände und andere Strukturelemente eines PEB. Darüber hinaus werden vorgefertigte Dächer und Böden außerhalb des Standorts mit Hochtechnologie gebaut, was PEBs hilft, indem sie weniger Zeit, weniger Wartung und besseres Design benötigen.
Basierend auf der Anwendung hatte das Wohnsegment 2018 den größten Marktanteil, der voraussichtlich auch die höchste Wachstumsrate auf dem Markt verzeichnen wird. Der Bausektor in Schwellenländern wie China und Indien verzeichnete aufgrund der zahlreichen Regierungsinitiativen zur Entwicklung einer besseren Infrastruktur (schwere Bauarbeiten wie Schiene, Straße, Dämme und Bewässerungskanäle) zum Wohle der Öffentlichkeit einen großen Investitionszufluss. Darüber hinaus hat die rasche Urbanisierung den Bedarf an Wohngebäuden in Schwellenländern wie Indien und China weiter erhöht. Daher entwickeln globale Unternehmen neue Vertragsprojekte und bauen ihre Präsenz im asiatisch-pazifischen Raum aus.
2015
Pennar Industries erhält neue Aufträge von Phoenix von der Ultra Cement Company. Aufgrund dieser neuen Bestellung werden Nachfrage und Angebot des Marktes steigen. Darüber hinaus geben immer mehr Unternehmen neue Bestellungen von dem Unternehmen auf.
März 2019
Nucor Corporation ist ein Unternehmen, das seine Stahlblechproduktion erweitert. Aufgrund dieser neuen Entwicklung steigen die Investitionen des Unternehmens. Das neue Angebot an Stahlplatten wird dem Unternehmen voraussichtlich mehr zugute kommen. Das Werk plant rund 1,2 Millionen Tonnen Stahltüren. Es wird erwartet, dass das gesamte Produktportfolio des Marktes verbessert wird.
Zielpublikum:
Report Attribute/Metric | Details |
---|---|
Market Size |
|
CAGR | 10.20% CAGR (2022-2030) |
Base Year | 2021 |
Forecast Period | 2022 to 2030 |
Historical Data | 2019 & 2020 |
Forecast Units | Value (USD Million) |
Report Coverage | Revenue Forecast, Competitive Landscape, Growth Factors, and Trends |
Segments Covered | Material, Product, Application, Region |
Geographies Covered | North America, Europe, Asia-Pacific, and Rest of the World (RoW) |
Key Vendors | Bluescope, Zamil Steel Holding Company, Kirby Building Systems, Nucor Corporation, Everest Industries, NCI Building Systems, PEB Steel, PEBS Pennar, Lindab Group, and ATCO. |
Key Market Opportunities |
|
Key Market Drivers | Growth of the construction industry |
Frequently Asked Questions (FAQ) :
Key Players of the market include Bluescope, Zamil Steel Holding Company, Kirby Building Systems, Nucor Corporation, Everest Industries, NCI Building Systems, PEB Steel, PEBS Pennar, Lindab Group, and ATCO.
Global Pre-Engineered Buildings Market was valued at USD 10,487.6 million in 2018, and it is expected to witness 8.5% CAGR during the forecast period. The base year considered for the study of the market is 2018, and the forecast period for the global pre-engineered buildings market is 2022 to 2030.
The geographical study of the global pre-engineered building market spans across four major regions, viz. North America, Europe, Asia Pacific, and the Rest of the World (RoW). North America is the second-largest market for pre-engineered buildings. The regional market is anticipated to thrive at 6.49% CAGR over the assessment period.
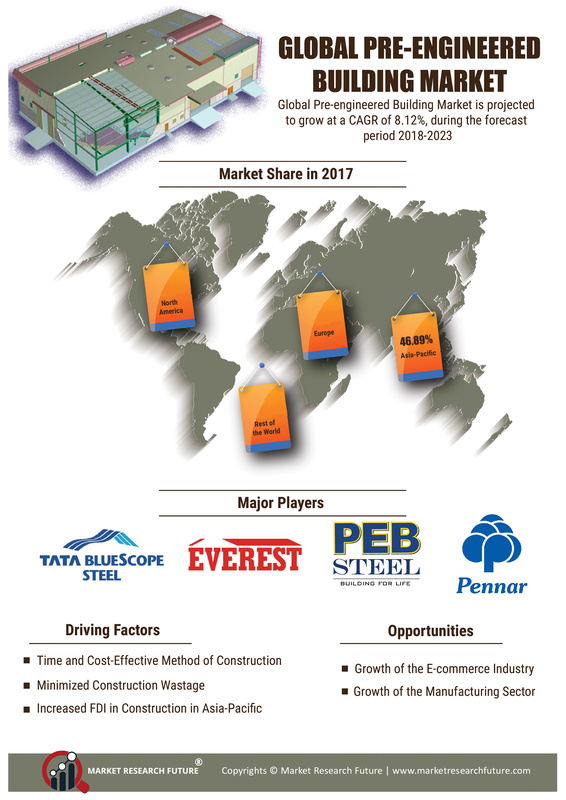
Global Pre-Engineered Building Market is set to mark a CAGR of 8.12% during the forecast period 2018 to 2023. The report further indicates that the global market is likely to scale valuation of USD 177.12 Bn towards the end of 2023 up from USD 111.55 Bn in 2017.