Request Free Sample ×

Kindly complete the form below to receive a free sample of this Report

* Please use a valid business email

Leading companies partner with us for data-driven Insights

clients tt-cursor
Hero Background

Specialty Chemicals Market

ID: MRFR/CnM/1494-CR
232 Pages
Priya Nagrale
Last Updated: May 11, 2026

Taille du marché des produits chimiques de spécialité, part et analyse de l’industrie Informations sur le rapport de recherche par source (pétrole brut, naphta, éthane, propane, butane, bois, autres) et par type (produits agrochimiques, ingrédients d’arômes, ingrédients de parfums, colorants et pigments, ingrédients actifs de soins personnels, produits chimiques de traitement de l’eau, produits chimiques de construction, tensioactifs, produits chimiques textiles, additifs polymères, produits chimiques d’origine biologique, autres), et par région (Amérique du Nord, Europe, Asie-Pacifique et Reste du monde) – Prévisions de marché jusqu’à 2035.

Partager
Download PDF ×

We do not share your information with anyone. However, we may send you emails based on your report interest from time to time. You may contact us at any time to opt-out.

Specialty Chemicals Market Infographic
Purchase Options
  1. SECTION I: RÉSUMÉ ET PRINCIPAUX FAITS SAILLANTS |
    1. 1.1 RÉSUMÉ EXÉCUTIF | |
      1. 1.1.1 Aperçu du marché | |
      2. 1.1.2 Principales conclusions | |
      3. 1.1.3 Segmentation du marché | |
      4. 1.1.4 Paysage concurrentiel | |
      5. 1.1.5 Défis et opportunités | |
      6. 1.1.6 Perspectives futures 2
  2. SECTION II: CADRE, MÉTHODOLOGIE ET ​​STRUCTURE DU MARCHÉ |
    1. 2.1 PRÉSENTATION DU MARCHÉ | |
      1. 2.1.1 Définition | |
      2. 2.1.2 Portée de l'étude | | |
        1. 2.1.2.1 Objectif de recherche | | |
        2. 2.1.2.2 Hypothèse | | |
        3. 2.1.2.3 Limites |
    2. 2.2 MÉTHODOLOGIE DE RECHERCHE | |
      1. 2.2.1 Aperçu | |
      2. 2.2.2 Exploration de données | |
      3. 2.2.3 Recherche secondaire | |
      4. 2.2.4 Recherche primaire | | |
        1. 2.2.4.1 Entretiens primaires et processus de collecte d'informations | | |
        2. 2.2.4.2 Répartition des répondants principaux | |
      5. 2.2.5 Modèle de prévision | |
      6. 2.2.6 Estimation de la taille du marché | | |
        1. 2.2.6.1 Approche ascendante | | |
        2. 2.2.6.2 Approche descendante | |
      7. 2.2.7 Triangulation des données | |
      8. 2.2.8 Validation 3
  3. SECTION III: ANALYSE QUALITATIVE |
    1. 3.1 DYNAMIQUE DU MARCHÉ | |
      1. 3.1.1 Présentation | | Pilotes
      2. 3.1.2 | |
      3. 3.1.3 Contraintes | |
      4. 3.1.4 Opportunités |
    2. 3.2 ANALYSE DES FACTEURS DE MARCHÉ | |
      1. 3.2.1 Analyse de la chaîne de valeur | |
      2. 3.2.2 Analyse des cinq forces de Porter | | |
        1. 3.2.2.1 Pouvoir de négociation des fournisseurs | | |
        2. 3.2.2.2 Pouvoir de négociation des acheteurs | | |
        3. 3.2.2.3 Menace des nouveaux entrants | | |
        4. 3.2.2.4 Menace de remplacement | | |
        5. 3.2.2.5 Intensité de la rivalité | |
      3. 3.2.3 COVID-19 Analyse d'impact | | |
        1. 3.2.3.1 Analyse d’impact sur le marché | | |
        2. 3.2.3.2 Impact régional | | |
        3. 3.2.3.3 Analyse des opportunités et des menaces 4
  4. SECTION IV: ANALYSE QUANTITATIVE |
    1. 4.1 Produits chimiques et matériaux, par source (USD milliards) | |
      1. 4.1.1 Pétrole brut | |
      2. 4.1.2 Naphta | |
      3. 4.1.3 Éthane | |
      4. 4.1.4 Propane | |
      5. 4.1.5 Butane | |
      6. 4.1.6 Bois | |
      7. 4.1.7 Autres |
    2. 4.2 Produits chimiques et matériaux, par type (USD milliards) | |
      1. 4.2.1 Produits agrochimiques | |
      2. 4.2.2 Arômes Ingrédients | |
      3. 4.2.3 Ingrédients de parfums | |
      4. 4.2.4 Colorants et pigments | |
      5. 4.2.5 Ingrédients actifs de soins personnels | |
      6. 4.2.6 Produits chimiques pour le traitement de l'eau | |
      7. 4.2.7 Produits chimiques de construction | |
      8. 4.2.8 Tensioactifs | |
      9. 4.2.9 Produits chimiques textiles | |
      10. 4.2.10 Additifs polymères | |
      11. 4.2.11 Produits chimiques d'origine biologique | |
      12. 4.2.12 Autres |
    3. 4.3 Produits chimiques et matériaux, par région (USD milliards) | |
      1. 4.3.1 Amérique du Nord | | |
        1. 4.3.1.1 US | | |
        2. 4.3.1.2 Canada | |
      2. 4.3.2 Europe | | |
        1. 4.3.2.1 Allemagne | | |
        2. 4.3.2.2 UK | | |
        3. 4.3.2.3 France | | |
        4. 4.3.2.4 Russie | | |
        5. 4.3.2.5 Italie | | |
        6. 4.3.2.6 Espagne | | |
        7. 4.3.2.7 Reste de l'Europe | |
      3. 4.3.3 APAC | | |
        1. 4.3.3.1 Chine | | |
        2. 4.3.3.2 Inde | | |
        3. 4.3.3.3 Japon | | |
        4. 4.3.3.4 Corée du Sud | | |
        5. 4.3.3.5 Malaisie | | |
        6. 4.3.3.6 Thaïlande | | |
        7. 4.3.3.7 Indonésie | | |
        8. 4.3.3.8 Reste de APAC | |
      4. 4.3.4 Amérique du Sud | | |
        1. 4.3.4.1 Brésil | | |
        2. 4.3.4.2 Mexique | | |
        3. 4.3.4.3 Argentine | | |
        4. 4.3.4.4 Reste de l'Amérique du Sud | |
      5. 4.3.5 MEA | | |
        1. 4.3.5.1 Pays du CCG | | |
        2. 4.3.5.2 Afrique du Sud | | |
        3. 4.3.5.3 Reste de MEA 5
  5. SECTION V: ANALYSE CONCURRENTIELLE |
    1. 5.1 Paysage concurrentiel | |
      1. 5.1.1 Présentation | |
      2. 5.1.2 Analyse concurrentielle | |
      3. 5.1.3 Analyse de la part de marché | |
      4. 5.1.4 Stratégie de croissance majeure in Produits chimiques et matériaux | |
      5. 5.1.5 Analyse comparative concurrentielle | |
      6. 5.1.6 Acteurs de premier plan in Conditions de nombre de développements dans les produits chimiques et les matériaux | |
      7. 5.1.7 Développements clés et stratégies de croissance | | |
        1. 5.1.7.1 Lancement de nouveaux produits/déploiement de services | | |
        2. 5.1.7.2 Fusions et acquisitions | | |
        3. 5.1.7.3 Coentreprises | |
      8. 5.1.8 Matrice financière des principaux acteurs | | |
        1. 5.1.8.1 Ventes et résultat d'exploitation | | |
        2. 5.1.8.2 Dépenses de R&D des principaux acteurs. 2023 |
    2. 5.2 Profils d'entreprise | |
      1. 5.2.1 BASF (DE) | | |
        1. 5.2.1.1 Aperçu financier | | |
        2. 5.2.1.2 Produits offerts | | |
        3. 5.2.1.3 Développements clés | | |
        4. 5.2.1.4 Analyse SWOT | | |
        5. 5.2.1.5 Stratégies clés | |
      2. 5.2.2 Dow (US) | | |
        1. 5.2.2.1 Aperçu financier | | |
        2. 5.2.2.2 Produits offerts | | |
        3. 5.2.2.3 Développements clés | | |
        4. 5.2.2.4 Analyse SWOT | | |
        5. 5.2.2.5 Stratégies clés | |
      3. 5.2.3 SABIC (SA) | | |
        1. 5.2.3.1 Aperçu financier | | |
        2. 5.2.3.2 Produits offerts | | |
        3. 5.2.3.3 Développements clés | | |
        4. 5.2.3.4 Analyse SWOT | | |
        5. 5.2.3.5 Stratégies clés | |
      4. 5.2.4 Evonik Industries (DE) | | |
        1. 5.2.4.1 Aperçu financier | | |
        2. 5.2.4.2 Produits offerts | | |
        3. 5.2.4.3 Développements clés | | |
        4. 5.2.4.4 Analyse SWOT | | |
        5. 5.2.4.5 Stratégies clés | |
      5. 5.2.5 Huntsman Corporation (US) | | |
        1. 5.2.5.1 Aperçu financier | | |
        2. 5.2.5.2 Produits offerts | | |
        3. 5.2.5.3 Développements clés | | |
        4. 5.2.5.4 Analyse SWOT | | |
        5. 5.2.5.5 Stratégies clés | |
      6. 5.2.6 Lanxess (DE) | | |
        1. 5.2.6.1 Aperçu financier | | |
        2. 5.2.6.2 Produits offerts | | |
        3. 5.2.6.3 Développements clés | | |
        4. 5.2.6.4 Analyse SWOT | | |
        5. 5.2.6.5 Stratégies clés | |
      7. 5.2.7 Solvay (BE) | | |
        1. 5.2.7.1 Aperçu financier | | |
        2. 5.2.7.2 Produits offerts | | |
        3. 5.2.7.3 Développements clés | | |
        4. 5.2.7.4 Analyse SWOT | | |
        5. 5.2.7.5 Stratégies clés | |
      8. 5.2.8 Mitsubishi Chemical (JP) | | |
        1. 5.2.8.1 Aperçu financier | | |
        2. 5.2.8.2 Produits offerts | | |
        3. 5.2.8.3 Développements clés | | |
        4. 5.2.8.4 Analyse SWOT | | |
        5. 5.2.8.5 Stratégies clés | |
      9. 5.2.9 Eastman Chemical Company (US) | | |
        1. 5.2.9.1 Aperçu financier | | |
        2. 5.2.9.2 Produits offerts | | |
        3. 5.2.9.3 Développements clés | | |
        4. 5.2.9.4 Analyse SWOT | | |
        5. 5.2.9.5 Stratégies clés |
    3. 5.3 Annexe | |
      1. 5.3.1 Références | |
      2. 5.3.2 Rapports connexes 6 LISTE DES FIGURES |
    4. 6.1 SYNOPSIS DU MARCHÉ |
    5. 6.2 ANALYSE DU MARCHÉ DE L'AMÉRIQUE DU NORD |
    6. 6.3 US ANALYSE DU MARCHÉ PAR SOURCE |
    7. 6.4 US ANALYSE DU MARCHÉ PAR TYPE |
    8. 6.5 ANALYSE DU MARCHÉ CANADIEN PAR SOURCE |
    9. 6.6 ANALYSE DU MARCHÉ CANADIEN PAR TYPE |
    10. 6.7 ANALYSE DU MARCHÉ EUROPE |
    11. 6.8 ANALYSE DU MARCHÉ ALLEMAGNE PAR SOURCE |
    12. 6.9 ANALYSE DU MARCHÉ ALLEMAGNE PAR TYPE |
    13. 6.10 UK ANALYSE DU MARCHÉ PAR SOURCE |
    14. 6.11 UK ANALYSE DU MARCHÉ PAR TYPE |
    15. 6.12 ANALYSE DU MARCHÉ FRANCE PAR SOURCE |
    16. 6.13 ANALYSE DU MARCHÉ FRANCE PAR TYPE |
    17. 6.14 ANALYSE DU MARCHÉ RUSSE PAR SOURCE |
    18. 6.15 ANALYSE DU MARCHÉ RUSSE PAR TYPE |
    19. 6.16 ANALYSE DU MARCHÉ ITALIE PAR SOURCE |
    20. 6.17 ANALYSE DU MARCHÉ ITALIE PAR TYPE |
    21. 6.18 ANALYSE DU MARCHÉ ESPAGNOL PAR SOURCE |
    22. 6.19 ANALYSE DU MARCHÉ ESPAGNOL PAR TYPE |
    23. 6.20 ANALYSE DU MARCHÉ RESTE DE L'EUROPE PAR SOURCE |
    24. 6.21 ANALYSE DU MARCHÉ RESTE DE L'EUROPE PAR TYPE |
    25. 6.22 APAC ANALYSE DE MARCHÉ |
    26. 6.23 ANALYSE DU MARCHÉ CHINOISE PAR SOURCE |
    27. 6.24 ANALYSE DU MARCHÉ CHINOISE PAR TYPE |
    28. 6.25 ANALYSE DU MARCHÉ INDE PAR SOURCE |
    29. 6.26 ANALYSE DU MARCHÉ INDE PAR TYPE |
    30. 6.27 ANALYSE DU MARCHÉ JAPON PAR SOURCE |
    31. 6.28 ANALYSE DU MARCHÉ JAPON PAR TYPE |
    32. 6.29 ANALYSE DU MARCHÉ DE LA CORÉE DU SUD PAR SOURCE |
    33. 6.30 ANALYSE DU MARCHÉ DE LA CORÉE DU SUD PAR TYPE |
    34. 6.31 ANALYSE DU MARCHÉ EN MALAISIE PAR SOURCE |
    35. 6.32 ANALYSE DU MARCHÉ EN MALAISIE PAR TYPE |
    36. 6.33 ANALYSE DU MARCHÉ THAÏLANDAIS PAR SOURCE |
    37. 6.34 ANALYSE DU MARCHÉ THAÏLANDAIS PAR TYPE |
    38. 6.35 ANALYSE DU MARCHÉ INDONÉSIEN PAR SOURCE |
    39. 6.36 ANALYSE DU MARCHÉ INDONÉSIEN PAR TYPE |
    40. 6.37 RESTE DE APAC ANALYSE DU MARCHÉ PAR SOURCE |
    41. 6.38 RESTE DE APAC ANALYSE DU MARCHÉ PAR TYPE |
    42. 6.39 ANALYSE DU MARCHÉ DE L'AMÉRIQUE DU SUD |
    43. 6.40 ANALYSE DU MARCHÉ BRÉSIL PAR SOURCE |
    44. 6.41 ANALYSE DU MARCHÉ BRÉSIL PAR TYPE |
    45. 6.42 ANALYSE DU MARCHÉ DU MEXIQUE PAR SOURCE |
    46. 6.43 ANALYSE DU MARCHÉ DU MEXIQUE PAR TYPE |
    47. 6.44 ANALYSE DU MARCHÉ ARGENTIN PAR SOURCE |
    48. 6.45 ANALYSE DU MARCHÉ ARGENTINE PAR TYPE |
    49. 6.46 ANALYSE DU MARCHÉ DU RESTE DE L'AMÉRIQUE DU SUD PAR SOURCE |
    50. 6.47 ANALYSE DU MARCHÉ DU RESTE DE L'AMÉRIQUE DU SUD PAR TYPE |
    51. 6.48 MEA ANALYSE DE MARCHÉ |
    52. 6.49 ANALYSE DU MARCHÉ DES PAYS DU CCG PAR SOURCE |
    53. 6.50 ANALYSE DU MARCHÉ DES PAYS DU CCG PAR TYPE |
    54. 6.51 ANALYSE DU MARCHÉ D'AFRIQUE DU SUD PAR SOURCE |
    55. 6.52 ANALYSE DU MARCHÉ SUD-AFRIQUE PAR TYPE |
    56. 6.53 RESTE DE MEA ANALYSE DU MARCHÉ PAR SOURCE |
    57. 6.54 RESTE DE MEA ANALYSE DU MARCHÉ PAR TYPE |
    58. 6.55 CRITÈRES CLÉS D'ACHAT DE PRODUITS CHIMIQUES ET MATÉRIAUX |
    59. 6.56 PROCESSUS DE RECHERCHE DU MRFR |
    60. 6.57 ANALYSE DRO DE PRODUITS CHIMIQUES ET DE MATÉRIAUX |
    61. 6.58 ANALYSE D'IMPACT DES FACTEURS: PRODUITS CHIMIQUES ET MATÉRIAUX |
    62. 6.59 ANALYSE D'IMPACT DES RETENUES: PRODUITS CHIMIQUES ET MATÉRIAUX |
    63. 6.60 CHAÎNE D'APPROVISIONNEMENT/VALEUR: PRODUITS CHIMIQUES ET MATÉRIAUX |
    64. 6.61 PRODUITS CHIMIQUES ET MATÉRIAUX, PAR SOURCE, 2024 (PARTAGE EN%) |
    65. 6.62 PRODUITS CHIMIQUES ET MATÉRIAUX, PAR SOURCE, 2024 À 2035 (USD Billion) |
    66. 6.63 PRODUITS CHIMIQUES ET MATÉRIAUX, PAR TYPE, 2024 (% PART) |
    67. 6.64 PRODUITS CHIMIQUES ET MATÉRIAUX, PAR TYPE, 2024 À 2035 (USD Billion) |
    68. 6.65 BENCHMARKING DES PRINCIPAUX CONCURRENTS 7 LISTE DES TABLEAUX |
    69. 7.1 LISTE DES HYPOTHÈSES | |
      1. 7.1.1 |
    70. 7.2 ESTIMATIONS DE LA TAILLE DU MARCHÉ en Amérique du Nord; PRÉVISION | |
      1. 7.2.1 PAR SOURCE, 2025-2035 (USD milliards) | |
      2. 7.2.2 PAR TYPE, 2025-2035 (USD milliards) |
    71. 7.3 US ESTIMATIONS DE LA TAILLE DU MARCHÉ; PRÉVISION | |
      1. 7.3.1 PAR SOURCE, 2025-2035 (USD milliards) | |
      2. 7.3.2 PAR TYPE, 2025-2035 (USD milliards) |
    72. 7.4 ESTIMATIONS DE LA TAILLE DU MARCHÉ canadien; PRÉVISION | |
      1. 7.4.1 PAR SOURCE, 2025-2035 (USD milliards) | |
      2. 7.4.2 PAR TYPE, 2025-2035 (USD milliards) |
    73. 7.5 ESTIMATIONS DE LA TAILLE DU MARCHÉ européen; PRÉVISION | |
      1. 7.5.1 PAR SOURCE, 2025-2035 (USD milliards) | |
      2. 7.5.2 PAR TYPE, 2025-2035 (USD milliards) |
    74. 7.6 ESTIMATIONS DE LA TAILLE DU MARCHÉ allemand; PRÉVISION | |
      1. 7.6.1 PAR SOURCE, 2025-2035 (USD milliards) | |
      2. 7.6.2 PAR TYPE, 2025-2035 (USD milliards) |
    75. 7.7 UK ESTIMATIONS DE LA TAILLE DU MARCHÉ; PRÉVISION | |
      1. 7.7.1 PAR SOURCE, 2025-2035 (USD milliards) | |
      2. 7.7.2 PAR TYPE, 2025-2035 (USD milliards) |
    76. 7.8 ESTIMATIONS DE LA TAILLE DU MARCHÉ en France; PRÉVISION | |
      1. 7.8.1 PAR SOURCE, 2025-2035 (USD milliards) | |
      2. 7.8.2 PAR TYPE, 2025-2035 (USD milliards) |
    77. 7.9 ESTIMATIONS DE LA TAILLE DU MARCHÉ en Russie; PRÉVISION | |
      1. 7.9.1 PAR SOURCE, 2025-2035 (USD milliards) | |
      2. 7.9.2 PAR TYPE, 2025-2035 (USD milliards) |
    78. 7.10 ESTIMATIONS DE LA TAILLE DU MARCHÉ italien; PRÉVISION | |
      1. 7.10.1 PAR SOURCE, 2025-2035 (USD milliards) | |
      2. 7.10.2 PAR TYPE, 2025-2035 (USD milliards) |
    79. 7.11 ESTIMATIONS DE LA TAILLE DU MARCHÉ espagnol; PRÉVISION | |
      1. 7.11.1 PAR SOURCE, 2025-2035 (USD milliards) | |
      2. 7.11.2 PAR TYPE, 2025-2035 (USD milliards) |
    80. 7.12 ESTIMATIONS DE LA TAILLE DU MARCHÉ pour le reste de l’Europe; PRÉVISION | |
      1. 7.12.1 PAR SOURCE, 2025-2035 (USD milliards) | |
      2. 7.12.2 PAR TYPE, 2025-2035 (USD milliards) |
    81. 7.13 APAC ESTIMATIONS DE LA TAILLE DU MARCHÉ; PRÉVISION | |
      1. 7.13.1 PAR SOURCE, 2025-2035 (USD milliards) | |
      2. 7.13.2 PAR TYPE, 2025-2035 (USD milliards) |
    82. 7.14 ESTIMATIONS DE LA TAILLE DU MARCHÉ chinois; PRÉVISION | |
      1. 7.14.1 PAR SOURCE, 2025-2035 (USD milliards) | |
      2. 7.14.2 PAR TYPE, 2025-2035 (USD milliards) |
    83. 7.15 ESTIMATIONS DE LA TAILLE DU MARCHÉ indien; PRÉVISION | |
      1. 7.15.1 PAR SOURCE, 2025-2035 (USD milliards) | |
      2. 7.15.2 PAR TYPE, 2025-2035 (USD milliards) |
    84. 7.16 ESTIMATIONS DE LA TAILLE DU MARCHÉ japonais; PRÉVISION | |
      1. 7.16.1 PAR SOURCE, 2025-2035 (USD milliards) | |
      2. 7.16.2 PAR TYPE, 2025-2035 (USD milliards) |
    85. 7.17 ESTIMATIONS DE LA TAILLE DU MARCHÉ en Corée du Sud; PRÉVISION | |
      1. 7.17.1 PAR SOURCE, 2025-2035 (USD milliards) | |
      2. 7.17.2 PAR TYPE, 2025-2035 (USD milliards) |
    86. 7.18 ESTIMATIONS DE LA TAILLE DU MARCHÉ en Malaisie; PRÉVISION | |
      1. 7.18.1 PAR SOURCE, 2025-2035 (USD milliards) | |
      2. 7.18.2 PAR TYPE, 2025-2035 (USD milliards) |
    87. 7.19 ESTIMATIONS DE LA TAILLE DU MARCHÉ thaïlandais; PRÉVISION | |
      1. 7.19.1 PAR SOURCE, 2025-2035 (USD milliards) | |
      2. 7.19.2 PAR TYPE, 2025-2035 (USD milliards) |
    88. 7.20 ESTIMATIONS DE LA TAILLE DU MARCHÉ indonésien; PRÉVISION | |
      1. 7.20.1 PAR SOURCE, 2025-2035 (USD milliards) | |
      2. 7.20.2 PAR TYPE, 2025-2035 (USD milliards) |
    89. 7.21 Reste des ESTIMATIONS DE LA TAILLE DU MARCHÉ APAC; PRÉVISION | |
      1. 7.21.1 PAR SOURCE, 2025-2035 (USD milliards) | |
      2. 7.21.2 PAR TYPE, 2025-2035 (USD milliards) |
    90. 7.22 ESTIMATIONS DE LA TAILLE DU MARCHÉ en Amérique du Sud; PRÉVISION | |
      1. 7.22.1 PAR SOURCE, 2025-2035 (USD milliards) | |
      2. 7.22.2 PAR TYPE, 2025-2035 (USD milliards) |
    91. 7.23 ESTIMATIONS DE LA TAILLE DU MARCHÉ du Brésil; PRÉVISION | |
      1. 7.23.1 PAR SOURCE, 2025-2035 (USD milliards) | |
      2. 7.23.2 PAR TYPE, 2025-2035 (USD milliards) |
    92. 7.24 ESTIMATIONS DE LA TAILLE DU MARCHÉ DU Mexique; PRÉVISION | |
      1. 7.24.1 PAR SOURCE, 2025-2035 (USD milliards) | |
      2. 7.24.2 PAR TYPE, 2025-2035 (USD milliards) |
    93. 7.25 ESTIMATIONS DE LA TAILLE DU MARCHÉ Argentine; PRÉVISION | |
      1. 7.25.1 PAR SOURCE, 2025-2035 (USD milliards) | |
      2. 7.25.2 PAR TYPE, 2025-2035 (USD milliards) |
    94. 7.26 ESTIMATIONS DE LA TAILLE DU MARCHÉ pour le reste de l’Amérique du Sud; PRÉVISION | |
      1. 7.26.1 PAR SOURCE, 2025-2035 (USD milliards) | |
      2. 7.26.2 PAR TYPE, 2025-2035 (USD milliards) |
    95. 7.27 MEA ESTIMATIONS DE LA TAILLE DU MARCHÉ; PRÉVISION | |
      1. 7.27.1 PAR SOURCE, 2025-2035 (USD milliards) | |
      2. 7.27.2 PAR TYPE, 2025-2035 (USD milliards) |
    96. 7.28 ESTIMATIONS DE LA TAILLE DU MARCHÉ des pays du CCG; PRÉVISION | |
      1. 7.28.1 PAR SOURCE, 2025-2035 (USD milliards) | |
      2. 7.28.2 PAR TYPE, 2025-2035 (USD milliards) |
    97. 7.29 ESTIMATIONS DE LA TAILLE DU MARCHÉ en Afrique du Sud; PRÉVISION | |
      1. 7.29.1 PAR SOURCE, 2025-2035 (USD milliards) | |
      2. 7.29.2 PAR TYPE, 2025-2035 (USD milliards) |
    98. 7.30 Reste des ESTIMATIONS DE LA TAILLE DU MARCHÉ MEA; PRÉVISION | |
      1. 7.30.1 PAR SOURCE, 2025-2035 (USD milliards) | |
      2. 7.30.2 PAR TYPE, 2025-2035 (USD milliards) |
    99. 7.31 LANCEMENT DE PRODUIT/DÉVELOPPEMENT DE PRODUIT/APPROBATION | |
      1. 7.31.1 |
    100. 7.32 ACQUISITION/PARTENARIAT | |

Segmentation du marché des produits chimiques et des matériaux

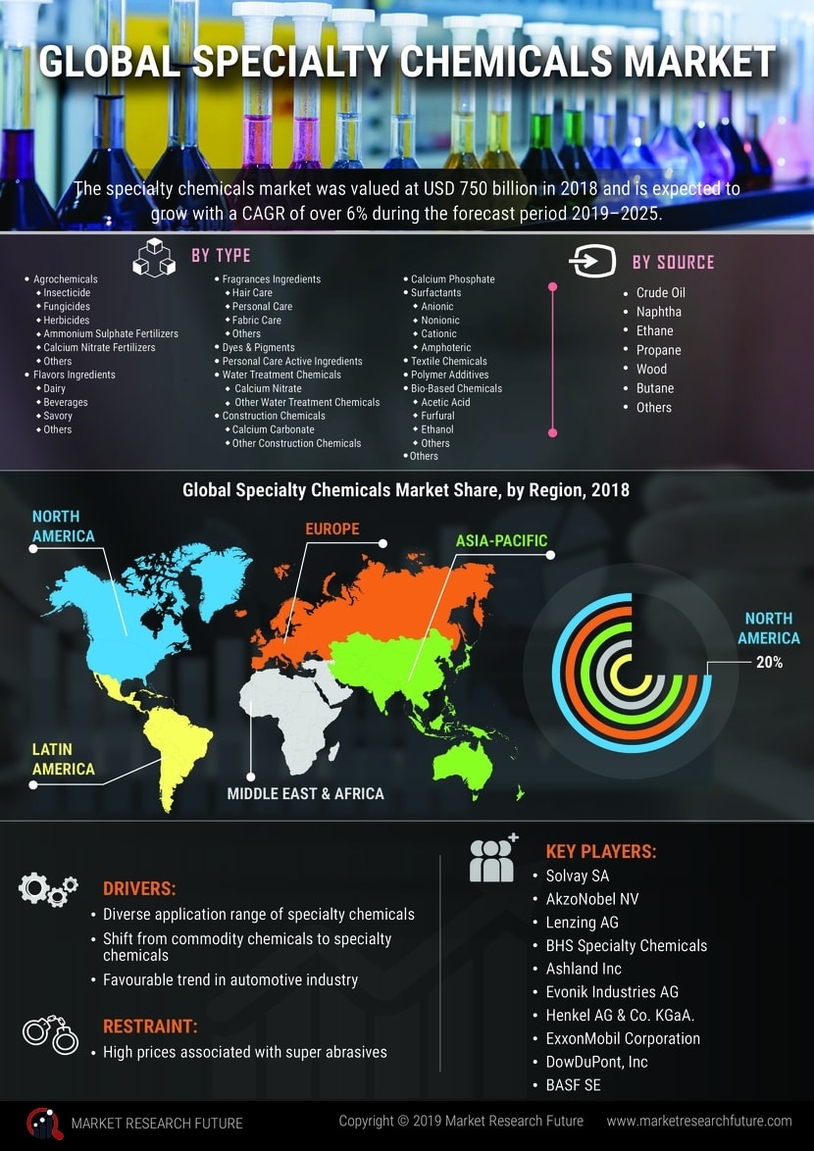
Produits chimiques et matériaux par source (USD milliards, 2025-2035)

  • Huile brute
  • Naphte
  • Éthane
  • Propane
  • Butane
  • Bois
  • Autres

Produits chimiques et matériaux par type (USD milliards, 2025-2035)

  • Produits agrochimiques
  • Ingrédients des saveurs
  • Ingrédients des parfums
  • Colorants et pigments
  • Ingrédients actifs de soins personnels
  • Produits chimiques pour le traitement de l'eau
  • Produits chimiques de construction
  • Tensioactifs
  • Produits chimiques textiles
  • Additifs polymères
  • Produits chimiques d'origine biologique
  • Autres

Compare Licence

×
Features License Type
Single User Multiuser License Enterprise User
Price $4,950 $5,950 $7,250
Maximum User Access Limit 1 User Upto 10 Users Unrestricted Access Throughout the Organization
Free Customization
Direct Access to Analyst
Deliverable Format
Platform Access
Discount on Next Purchase 10% 15% 15%
Printable Versions