Request Free Sample ×

Kindly complete the form below to receive a free sample of this Report

* Please use a valid business email

Leading companies partner with us for data-driven Insights

clients tt-cursor
Hero Background

Marché des protecteurs d'écran pour smartphones

ID: MRFR/CnM/1569-CR
185 Pages
Anshula Mandaokar
Last Updated: April 21, 2026

Rapport de recherche sur le marché des protecteurs d'écran pour smartphones Informations par type de matériau (Verre, Polyéthylène Téréphtalate et Polyuréthane Thermoplastique), par type de produit (2D, 2,5D, 3D et Verre Trempé 9H), par taille (0,21 mm, 0,26 mm, 0,33 mm et 0,48 mm), par application (Smartphones et Tablettes) et par région (Amérique du Nord, Europe, Asie-Pacifique et Reste du Monde) – Prévisions du marché jusqu'en 2035

Partager
Download PDF ×

We do not share your information with anyone. However, we may send you emails based on your report interest from time to time. You may contact us at any time to opt-out.

Smartphone screen protector Market Infographic
Purchase Options
  1. 1 SECTION I : RÉSUMÉ EXÉCUTIF ET POINTS CLÉS

    1. 1.1 RÉSUMÉ EXÉCUTIF
      1. 1.1.1 Vue d'ensemble du marché
      2. 1.1.2 Conclusions clés
      3. 1.1.3 Segmentation du marché
      4. 1.1.4 Paysage concurrentiel
      5. 1.1.5 Défis et opportunités
      6. 1.1.6 Perspectives futures 2 SECTION II : DÉLIMITATION, MÉTHODOLOGIE ET STRUCTURE DU MARCHÉ
    2. 2.1 INTRODUCTION AU MARCHÉ
      1. 2.1.1 Définition
      2. 2.1.2 Portée de l'étude
        1. 2.1.2.1 Objectif de recherche
        2. 2.1.2.2 Hypothèse
        3. 2.1.2.3 Limitations
    3. 2.2 MÉTHODOLOGIE DE RECHERCHE
      1. 2.2.1 Vue d'ensemble
      2. 2.2.2 Exploration de données
      3. 2.2.3 Recherche secondaire
      4. 2.2.4 Recherche primaire
        1. 2.2.4.1 Interviews primaires et processus de collecte d'informations
        2. 2.2.4.2 Répartition des répondants principaux
      5. 2.2.5 Modèle de prévision
      6. 2.2.6 Estimation de la taille du marché
        1. 2.2.6.1 Approche ascendante
        2. 2.2.6.2 Approche descendante
      7. 2.2.7 Triangulation des données
      8. 2.2.8 Validation 3 SECTION III : ANALYSE QUALITATIVE
    4. 3.1 DYNAMIQUE DU MARCHÉ
      1. 3.1.1 Vue d'ensemble
      2. 3.1.2 Facteurs moteurs
      3. 3.1.3 Contraintes
      4. 3.1.4 Opportunités
    5. 3.2 ANALYSE DES FACTEURS DU MARCHÉ
      1. 3.2.1 Analyse de la chaîne de valeur
      2. 3.2.2 Analyse des cinq forces de Porter
        1. 3.2.2.1 Pouvoir de négociation des fournisseurs
        2. 3.2.2.2 Pouvoir de négociation des acheteurs
        3. 3.2.2.3 Menace des nouveaux entrants
        4. 3.2.2.4 Menace des substituts
        5. 3.2.2.5 Intensité de la rivalité
      3. 3.2.3 Analyse de l'impact du COVID-19
        1. 3.2.3.1 Analyse de l'impact sur le marché
        2. 3.2.3.2 Impact régional
        3. 3.2.3.3 Analyse des opportunités et des menaces 4 SECTION IV : ANALYSE QUANTITATIVE
    6. 4.1 Produits chimiques et matériaux, PAR TYPE DE MATÉRIAU (milliards USD)
      1. 4.1.1 Verre
      2. 4.1.2 Téréphtalate de polyéthylène
      3. 4.1.3 Polyuréthane thermoplastique
    7. 4.2 Produits chimiques et matériaux, PAR TYPE DE PRODUIT (milliards USD)
      1. 4.2.1 2D
      2. 4.2.2 2,5D
      3. 4.2.3 3D
      4. 4.2.4 Verre trempé 9H
    8. 4.3 Produits chimiques et matériaux, PAR TAILLE (milliards USD)
      1. 4.3.1 0,21 Mm
      2. 4.3.2 0,26 Mm
      3. 4.3.3 0,33 Mm
      4. 4.3.4 0,48 Mm
    9. 4.4 Produits chimiques et matériaux, PAR APPLICATION (milliards USD)
      1. 4.4.1 Smartphones
      2. 4.4.2 Tablettes
    10. 4.5 Produits chimiques et matériaux, PAR RÉGION (milliards USD)
      1. 4.5.1 Amérique du Nord
        1. 4.5.1.1 États-Unis
        2. 4.5.1.2 Canada
      2. 4.5.2 Europe
        1. 4.5.2.1 Allemagne
        2. 4.5.2.2 Royaume-Uni
        3. 4.5.2.3 France
        4. 4.5.2.4 Russie
        5. 4.5.2.5 Italie
        6. 4.5.2.6 Espagne
        7. 4.5.2.7 Reste de l'Europe
      3. 4.5.3 APAC
        1. 4.5.3.1 Chine
        2. 4.5.3.2 Inde
        3. 4.5.3.3 Japon
        4. 4.5.3.4 Corée du Sud
        5. 4.5.3.5 Malaisie
        6. 4.5.3.6 Thaïlande
        7. 4.5.3.7 Indonésie
        8. 4.5.3.8 Reste de l'APAC
      4. 4.5.4 Amérique du Sud
        1. 4.5.4.1 Brésil
        2. 4.5.4.2 Mexique
        3. 4.5.4.3 Argentine
        4. 4.5.4.4 Reste de l'Amérique du Sud
      5. 4.5.5 MEA
        1. 4.5.5.1 Pays du CCG
        2. 4.5.5.2 Afrique du Sud
        3. 4.5.5.3 Reste de la MEA
  2. 5 SECTION V : ANALYSE CONCURRENTIELLE
    1. 5.1 Paysage concurrentiel
      1. 5.1.1 Vue d'ensemble
      2. 5.1.2 Analyse concurrentielle
      3. 5.1.3 Analyse de la part de marché
      4. 5.1.4 Stratégie de croissance majeure dans les produits chimiques et matériaux
      5. 5.1.5 Évaluation comparative
      6. 5.1.6 Acteurs principaux en termes de nombre de développements dans les produits chimiques et matériaux
      7. 5.1.7 Développements clés et stratégies de croissance
        1. 5.1.7.1 Lancement de nouveaux produits / Déploiement de services
        2. 5.1.7.2 Fusions & Acquisitions
        3. 5.1.7.3 Coentreprises
      8. 5.1.8 Matrice financière des principaux acteurs
        1. 5.1.8.1 Ventes et revenu d'exploitation
        2. 5.1.8.2 Dépenses de R&D des principaux acteurs. 2023
    2. 5.2 Profils d'entreprise
      1. 5.2.1 ZAGG Inc (États-Unis)
        1. 5.2.1.1 Vue d'ensemble financière
        2. 5.2.1.2 Produits offerts
        3. 5.2.1.3 Développements clés
        4. 5.2.1.4 Analyse SWOT
        5. 5.2.1.5 Stratégies clés
      2. 5.2.2 Belkin International Inc (États-Unis)
        1. 5.2.2.1 Vue d'ensemble financière
        2. 5.2.2.2 Produits offerts
        3. 5.2.2.3 Développements clés
        4. 5.2.2.4 Analyse SWOT
        5. 5.2.2.5 Stratégies clés
      3. 5.2.3 Tech21 (Royaume-Uni)
        1. 5.2.3.1 Vue d'ensemble financière
        2. 5.2.3.2 Produits offerts
        3. 5.2.3.3 Développements clés
        4. 5.2.3.4 Analyse SWOT
        5. 5.2.3.5 Stratégies clés
      4. 5.2.4 OtterBox (États-Unis)
        1. 5.2.4.1 Vue d'ensemble financière
        2. 5.2.4.2 Produits offerts
        3. 5.2.4.3 Développements clés
        4. 5.2.4.4 Analyse SWOT
        5. 5.2.4.5 Stratégies clés
      5. 5.2.5 Spigen Inc (Corée du Sud)
        1. 5.2.5.1 Vue d'ensemble financière
        2. 5.2.5.2 Produits offerts
        3. 5.2.5.3 Développements clés
        4. 5.2.5.4 Analyse SWOT
        5. 5.2.5.5 Stratégies clés
      6. 5.2.6 InvisibleShield (États-Unis)
        1. 5.2.6.1 Vue d'ensemble financière
        2. 5.2.6.2 Produits offerts
        3. 5.2.6.3 Développements clés
        4. 5.2.6.4 Analyse SWOT
        5. 5.2.6.5 Stratégies clés
      7. 5.2.7 BodyGuardz (États-Unis)
        1. 5.2.7.1 Vue d'ensemble financière
        2. 5.2.7.2 Produits offerts
        3. 5.2.7.3 Développements clés
        4. 5.2.7.4 Analyse SWOT
        5. 5.2.7.5 Stratégies clés
      8. 5.2.8 Moshi (États-Unis)
        1. 5.2.8.1 Vue d'ensemble financière
        2. 5.2.8.2 Produits offerts
        3. 5.2.8.3 Développements clés
        4. 5.2.8.4 Analyse SWOT
        5. 5.2.8.5 Stratégies clés
    3. 5.3 Annexe
      1. 5.3.1 Références
      2. 5.3.2 Rapports connexes 6 LISTE DES FIGURES
    4. 6.1 SYNOPSIS DU MARCHÉ
    5. 6.2 ANALYSE DU MARCHÉ EN AMÉRIQUE DU NORD
    6. 6.3 ANALYSE DU MARCHÉ AMÉRICAIN PAR TYPE DE MATÉRIAU
    7. 6.4 ANALYSE DU MARCHÉ AMÉRICAIN PAR TYPE DE PRODUIT
    8. 6.5 ANALYSE DU MARCHÉ AMÉRICAIN PAR TAILLE
    9. 6.6 ANALYSE DU MARCHÉ AMÉRICAIN PAR APPLICATION
    10. 6.7 ANALYSE DU MARCHÉ CANADIEN PAR TYPE DE MATÉRIAU
    11. 6.8 ANALYSE DU MARCHÉ CANADIEN PAR TYPE DE PRODUIT
    12. 6.9 ANALYSE DU MARCHÉ CANADIEN PAR TAILLE
    13. 6.10 ANALYSE DU MARCHÉ CANADIEN PAR APPLICATION
    14. 6.11 ANALYSE DU MARCHÉ EN EUROPE
    15. 6.12 ANALYSE DU MARCHÉ ALLEMAND PAR TYPE DE MATÉRIAU
    16. 6.13 ANALYSE DU MARCHÉ ALLEMAND PAR TYPE DE PRODUIT
    17. 6.14 ANALYSE DU MARCHÉ ALLEMAND PAR TAILLE
    18. 6.15 ANALYSE DU MARCHÉ ALLEMAND PAR APPLICATION
    19. 6.16 ANALYSE DU MARCHÉ ROYAUMOIS PAR TYPE DE MATÉRIAU
    20. 6.17 ANALYSE DU MARCHÉ ROYAUMOIS PAR TYPE DE PRODUIT
    21. 6.18 ANALYSE DU MARCHÉ ROYAUMOIS PAR TAILLE
    22. 6.19 ANALYSE DU MARCHÉ ROYAUMOIS PAR APPLICATION
    23. 6.20 ANALYSE DU MARCHÉ FRANÇAIS PAR TYPE DE MATÉRIAU
    24. 6.21 ANALYSE DU MARCHÉ FRANÇAIS PAR TYPE DE PRODUIT
    25. 6.22 ANALYSE DU MARCHÉ FRANÇAIS PAR TAILLE
    26. 6.23 ANALYSE DU MARCHÉ FRANÇAIS PAR APPLICATION
    27. 6.24 ANALYSE DU MARCHÉ RUSSE PAR TYPE DE MATÉRIAU
    28. 6.25 ANALYSE DU MARCHÉ RUSSE PAR TYPE DE PRODUIT
    29. 6.26 ANALYSE DU MARCHÉ RUSSE PAR TAILLE
    30. 6.27 ANALYSE DU MARCHÉ RUSSE PAR APPLICATION
    31. 6.28 ANALYSE DU MARCHÉ ITALIEN PAR TYPE DE MATÉRIAU
    32. 6.29 ANALYSE DU MARCHÉ ITALIEN PAR TYPE DE PRODUIT
    33. 6.30 ANALYSE DU MARCHÉ ITALIEN PAR TAILLE
    34. 6.31 ANALYSE DU MARCHÉ ITALIEN PAR APPLICATION
    35. 6.32 ANALYSE DU MARCHÉ ESPAGNOL PAR TYPE DE MATÉRIAU
    36. 6.33 ANALYSE DU MARCHÉ ESPAGNOL PAR TYPE DE PRODUIT
    37. 6.34 ANALYSE DU MARCHÉ ESPAGNOL PAR TAILLE
    38. 6.35 ANALYSE DU MARCHÉ ESPAGNOL PAR APPLICATION
    39. 6.36 ANALYSE DU MARCHÉ RESTE DE L'EUROPE PAR TYPE DE MATÉRIAU
    40. 6.37 ANALYSE DU MARCHÉ RESTE DE L'EUROPE PAR TYPE DE PRODUIT
    41. 6.38 ANALYSE DU MARCHÉ RESTE DE L'EUROPE PAR TAILLE
    42. 6.39 ANALYSE DU MARCHÉ RESTE DE L'EUROPE PAR APPLICATION
    43. 6.40 ANALYSE DU MARCHÉ APAC
    44. 6.41 ANALYSE DU MARCHÉ CHINOIS PAR TYPE DE MATÉRIAU
    45. 6.42 ANALYSE DU MARCHÉ CHINOIS PAR TYPE DE PRODUIT
    46. 6.43 ANALYSE DU MARCHÉ CHINOIS PAR TAILLE
    47. 6.44 ANALYSE DU MARCHÉ CHINOIS PAR APPLICATION
    48. 6.45 ANALYSE DU MARCHÉ INDIEN PAR TYPE DE MATÉRIAU
    49. 6.46 ANALYSE DU MARCHÉ INDIEN PAR TYPE DE PRODUIT
    50. 6.47 ANALYSE DU MARCHÉ INDIEN PAR TAILLE
    51. 6.48 ANALYSE DU MARCHÉ INDIEN PAR APPLICATION
    52. 6.49 ANALYSE DU MARCHÉ JAPONAIS PAR TYPE DE MATÉRIAU
    53. 6.50 ANALYSE DU MARCHÉ JAPONAIS PAR TYPE DE PRODUIT
    54. 6.51 ANALYSE DU MARCHÉ JAPONAIS PAR TAILLE
    55. 6.52 ANALYSE DU MARCHÉ JAPONAIS PAR APPLICATION
    56. 6.53 ANALYSE DU MARCHÉ CORÉEN DU SUD PAR TYPE DE MATÉRIAU
    57. 6.54 ANALYSE DU MARCHÉ CORÉEN DU SUD PAR TYPE DE PRODUIT
    58. 6.55 ANALYSE DU MARCHÉ CORÉEN DU SUD PAR TAILLE
    59. 6.56 ANALYSE DU MARCHÉ CORÉEN DU SUD PAR APPLICATION
    60. 6.57 ANALYSE DU MARCHÉ MALAYSIEN PAR TYPE DE MATÉRIAU
    61. 6.58 ANALYSE DU MARCHÉ MALAYSIEN PAR TYPE DE PRODUIT
    62. 6.59 ANALYSE DU MARCHÉ MALAYSIEN PAR TAILLE
    63. 6.60 ANALYSE DU MARCHÉ MALAYSIEN PAR APPLICATION
    64. 6.61 ANALYSE DU MARCHÉ THAÏLAIS PAR TYPE DE MATÉRIAU
    65. 6.62 ANALYSE DU MARCHÉ THAÏLAIS PAR TYPE DE PRODUIT
    66. 6.63 ANALYSE DU MARCHÉ THAÏLAIS PAR TAILLE
    67. 6.64 ANALYSE DU MARCHÉ THAÏLAIS PAR APPLICATION
    68. 6.65 ANALYSE DU MARCHÉ INDONÉSIEN PAR TYPE DE MATÉRIAU
    69. 6.66 ANALYSE DU MARCHÉ INDONÉSIEN PAR TYPE DE PRODUIT
    70. 6.67 ANALYSE DU MARCHÉ INDONÉSIEN PAR TAILLE
    71. 6.68 ANALYSE DU MARCHÉ INDONÉSIEN PAR APPLICATION
    72. 6.69 ANALYSE DU MARCHÉ RESTE DE L'APAC PAR TYPE DE MATÉRIAU
    73. 6.70 ANALYSE DU MARCHÉ RESTE DE L'APAC PAR TYPE DE PRODUIT
    74. 6.71 ANALYSE DU MARCHÉ RESTE DE L'APAC PAR TAILLE
    75. 6.72 ANALYSE DU MARCHÉ RESTE DE L'APAC PAR APPLICATION
    76. 6.73 ANALYSE DU MARCHÉ EN AMÉRIQUE DU SUD
    77. 6.74 ANALYSE DU MARCHÉ BRÉSILIEN PAR TYPE DE MATÉRIAU
    78. 6.75 ANALYSE DU MARCHÉ BRÉSILIEN PAR TYPE DE PRODUIT
    79. 6.76 ANALYSE DU MARCHÉ BRÉSILIEN PAR TAILLE
    80. 6.77 ANALYSE DU MARCHÉ BRÉSILIEN PAR APPLICATION
    81. 6.78 ANALYSE DU MARCHÉ MEXICAIN PAR TYPE DE MATÉRIAU
    82. 6.79 ANALYSE DU MARCHÉ MEXICAIN PAR TYPE DE PRODUIT
    83. 6.80 ANALYSE DU MARCHÉ MEXICAIN PAR TAILLE
    84. 6.81 ANALYSE DU MARCHÉ MEXICAIN PAR APPLICATION
    85. 6.82 ANALYSE DU MARCHÉ ARGENTIN PAR TYPE DE MATÉRIAU
    86. 6.83 ANALYSE DU MARCHÉ ARGENTIN PAR TYPE DE PRODUIT
    87. 6.84 ANALYSE DU MARCHÉ ARGENTIN PAR TAILLE
    88. 6.85 ANALYSE DU MARCHÉ ARGENTIN PAR APPLICATION
    89. 6.86 ANALYSE DU MARCHÉ RESTE DE L'AMÉRIQUE DU SUD PAR TYPE DE MATÉRIAU
    90. 6.87 ANALYSE DU MARCHÉ RESTE DE L'AMÉRIQUE DU SUD PAR TYPE DE PRODUIT
    91. 6.88 ANALYSE DU MARCHÉ RESTE DE L'AMÉRIQUE DU SUD PAR TAILLE
    92. 6.89 ANALYSE DU MARCHÉ RESTE DE L'AMÉRIQUE DU SUD PAR APPLICATION
    93. 6.90 ANALYSE DU MARCHÉ MEA
    94. 6.91 ANALYSE DU MARCHÉ DES PAYS DU CCG PAR TYPE DE MATÉRIAU
    95. 6.92 ANALYSE DU MARCHÉ DES PAYS DU CCG PAR TYPE DE PRODUIT
    96. 6.93 ANALYSE DU MARCHÉ DES PAYS DU CCG PAR TAILLE
    97. 6.94 ANALYSE DU MARCHÉ DES PAYS DU CCG PAR APPLICATION
    98. 6.95 ANALYSE DU MARCHÉ EN AFRIQUE DU SUD PAR TYPE DE MATÉRIAU
    99. 6.96 ANALYSE DU MARCHÉ EN AFRIQUE DU SUD PAR TYPE DE PRODUIT
    100. 6.97 ANALYSE DU MARCHÉ EN AFRIQUE DU SUD PAR TAILLE
    101. 6.98 ANALYSE DU MARCHÉ EN AFRIQUE DU SUD PAR APPLICATION
    102. 6.99 ANALYSE DU MARCHÉ RESTE DE LA MEA PAR TYPE DE MATÉRIAU
    103. 6.100 ANALYSE DU MARCHÉ RESTE DE LA MEA PAR TYPE DE PRODUIT
    104. 6.101 ANALYSE DU MARCHÉ RESTE DE LA MEA PAR TAILLE
    105. 6.102 ANALYSE DU MARCHÉ RESTE DE LA MEA PAR APPLICATION
    106. 6.103 CRITÈRES D'ACHAT CLÉS DES PRODUITS CHIMIQUES ET MATÉRIAUX
    107. 6.104 PROCESSUS DE RECHERCHE DE MRFR
    108. 6.105 ANALYSE DRO DE PRODUITS CHIMIQUES ET MATÉRIAUX
    109. 6.106 ANALYSE D'IMPACT DES FACTEURS MOTRICES : PRODUITS CHIMIQUES ET MATÉRIAUX
    110. 6.107 ANALYSE D'IMPACT DES CONTRAINTES : PRODUITS CHIMIQUES ET MATÉRIAUX
    111. 6.108 CHAÎNE D'APPROVISIONNEMENT / DE VALEUR : PRODUITS CHIMIQUES ET MATÉRIAUX
    112. 6.109 PRODUITS CHIMIQUES ET MATÉRIAUX, PAR TYPE DE MATÉRIAU, 2024 (% PART)
    113. 6.110 PRODUITS CHIMIQUES ET MATÉRIAUX, PAR TYPE DE MATÉRIAU, 2024 À 2035 (milliards USD)
    114. 6.111 PRODUITS CHIMIQUES ET MATÉRIAUX, PAR TYPE DE PRODUIT, 2024 (% PART)
    115. 6.112 PRODUITS CHIMIQUES ET MATÉRIAUX, PAR TYPE DE PRODUIT, 2024 À 2035 (milliards USD)
    116. 6.113 PRODUITS CHIMIQUES ET MATÉRIAUX, PAR TAILLE, 2024 (% PART)
    117. 6.114 PRODUITS CHIMIQUES ET MATÉRIAUX, PAR TAILLE, 2024 À 2035 (milliards USD)
    118. 6.115 PRODUITS CHIMIQUES ET MATÉRIAUX, PAR APPLICATION, 2024 (% PART)
    119. 6.116 PRODUITS CHIMIQUES ET MATÉRIAUX, PAR APPLICATION, 2024 À 2035 (milliards USD)
    120. 6.117 ÉVALUATION COMPARATIVE DES PRINCIPAUX CONCURRENTS 7 LISTE DES TABLEAUX
    121. 7.1 LISTE DES HYPOTHÈSES
  3. 7.1.1
    1. 7.2 ESTIMATIONS DE LA TAILLE DU MARCHÉ EN AMÉRIQUE DU NORD ; PRÉVISION
      1. 7.2.1 PAR TYPE DE MATÉRIAU, 2025-2035 (milliards USD)
      2. 7.2.2 PAR TYPE DE PRODUIT, 2025-2035 (milliards USD)
      3. 7.2.3 PAR TAILLE, 2025-2035 (milliards USD)
      4. 7.2.4 PAR APPLICATION, 2025-2035 (milliards USD)
    2. 7.3 ESTIMATIONS DE LA TAILLE DU MARCHÉ AMÉRICAIN ; PRÉVISION
      1. 7.3.1 PAR TYPE DE MATÉRIAU, 2025-2035 (milliards USD)
      2. 7.3.2 PAR TYPE DE PRODUIT, 2025-2035 (milliards USD)
      3. 7.3.3 PAR TAILLE, 2025-2035 (milliards USD)
      4. 7.3.4 PAR APPLICATION, 2025-2035 (milliards USD)
    3. 7.4 ESTIMATIONS DE LA TAILLE DU MARCHÉ CANADIEN ; PRÉVISION
      1. 7.4.1 PAR TYPE DE MATÉRIAU, 2025-2035 (milliards USD)
      2. 7.4.2 PAR TYPE DE PRODUIT, 2025-2035 (milliards USD)
      3. 7.4.3 PAR TAILLE, 2025-2035 (milliards USD)
      4. 7.4.4 PAR APPLICATION, 2025-2035 (milliards USD)
    4. 7.5 ESTIMATIONS DE LA TAILLE DU MARCHÉ EN EUROPE ; PRÉVISION
      1. 7.5.1 PAR TYPE DE MATÉRIAU, 2025-2035 (milliards USD)
      2. 7.5.2 PAR TYPE DE PRODUIT, 2025-2035 (milliards USD)
      3. 7.5.3 PAR TAILLE, 2025-2035 (milliards USD)
      4. 7.5.4 PAR APPLICATION, 2025-2035 (milliards USD)
    5. 7.6 ESTIMATIONS DE LA TAILLE DU MARCHÉ ALLEMAND ; PRÉVISION
      1. 7.6.1 PAR TYPE DE MATÉRIAU, 2025-2035 (milliards USD)
      2. 7.6.2 PAR TYPE DE PRODUIT, 2025-2035 (milliards USD)
      3. 7.6.3 PAR TAILLE, 2025-2035 (milliards USD)
      4. 7.6.4 PAR APPLICATION, 2025-2035 (milliards USD)
    6. 7.7 ESTIMATIONS DE LA TAILLE DU MARCHÉ ROYAUMOIS ; PRÉVISION
      1. 7.7.1 PAR TYPE DE MATÉRIAU, 2025-2035 (milliards USD)
      2. 7.7.2 PAR TYPE DE PRODUIT, 2025-2035 (milliards USD)
      3. 7.7.3 PAR TAILLE, 2025-2035 (milliards USD)
      4. 7.7.4 PAR APPLICATION, 2025-2035 (milliards USD)
    7. 7.8 ESTIMATIONS DE LA TAILLE DU MARCHÉ FRANÇAIS ; PRÉVISION
      1. 7.8.1 PAR TYPE DE MATÉRIAU, 2025-2035 (milliards USD)
      2. 7.8.2 PAR TYPE DE PRODUIT, 2025-2035 (milliards USD)
      3. 7.8.3 PAR TAILLE, 2025-2035 (milliards USD)
      4. 7.8.4 PAR APPLICATION, 2025-2035 (milliards USD)
    8. 7.9 ESTIMATIONS DE LA TAILLE DU MARCHÉ RUSSE ; PRÉVISION
      1. 7.9.1 PAR TYPE DE MATÉRIAU, 2025-2035 (milliards USD)
      2. 7.9.2 PAR TYPE DE PRODUIT, 2025-2035 (milliards USD)
      3. 7.9.3 PAR TAILLE, 2025-2035 (milliards USD)
      4. 7.9.4 PAR APPLICATION, 2025-2035 (milliards USD)
    9. 7.10 ESTIMATIONS DE LA TAILLE DU MARCHÉ ITALIEN ; PRÉVISION
      1. 7.10.1 PAR TYPE DE MATÉRIAU, 2025-2035 (milliards USD)
      2. 7.10.2 PAR TYPE DE PRODUIT, 2025-2035 (milliards USD)
      3. 7.10.3 PAR TAILLE, 2025-2035 (milliards USD)
      4. 7.10.4 PAR APPLICATION, 2025-2035 (milliards USD)
    10. 7.11 ESTIMATIONS DE LA TAILLE DU MARCHÉ ESPAGNOL ; PRÉVISION
      1. 7.11.1 PAR TYPE DE MATÉRIAU, 2025-2035 (milliards USD)
      2. 7.11.2 PAR TYPE DE PRODUIT, 2025-2035 (milliards USD)
      3. 7.11.3 PAR TAILLE, 2025-2035 (milliards USD)
      4. 7.11.4 PAR APPLICATION, 2025-2035 (milliards USD)
    11. 7.12 ESTIMATIONS DE LA TAILLE DU MARCHÉ RESTE DE L'EUROPE ; PRÉVISION
      1. 7.12.1 PAR TYPE DE MATÉRIAU, 2025-2035 (milliards USD)
      2. 7.12.2 PAR TYPE DE PRODUIT, 2025-2035 (milliards USD)
      3. 7.12.3 PAR TAILLE, 2025-2035 (milliards USD)
      4. 7.12.4 PAR APPLICATION, 2025-2035 (milliards USD)
    12. 7.13 ESTIMATIONS DE LA TAILLE DU MARCHÉ APAC ; PRÉVISION
      1. 7.13.1 PAR TYPE DE MATÉRIAU, 2025-2035 (milliards USD)
      2. 7.13.2 PAR TYPE DE PRODUIT, 2025-2035 (milliards USD)
      3. 7.13.3 PAR TAILLE, 2025-2035 (milliards USD)
      4. 7.13.4 PAR APPLICATION, 2025-2035 (milliards USD)
    13. 7.14 ESTIMATIONS DE LA TAILLE DU MARCHÉ CHINOIS ; PRÉVISION
      1. 7.14.1 PAR TYPE DE MATÉRIAU, 2025-2035 (milliards USD)
      2. 7.14.2 PAR TYPE DE PRODUIT, 2025-2035 (milliards USD)
      3. 7.14.3 PAR TAILLE, 2025-2035 (milliards USD)
      4. 7.14.4 PAR APPLICATION, 2025-2035 (milliards USD)
    14. 7.15 ESTIMATIONS DE LA TAILLE DU MARCHÉ INDIEN ; PRÉVISION
      1. 7.15.1 PAR TYPE DE MATÉRIAU, 2025-2035 (milliards USD)
      2. 7.15.2 PAR TYPE DE PRODUIT, 2025-2035 (milliards USD)
      3. 7.15.3 PAR TAILLE, 2025-2035 (milliards USD)
      4. 7.15.4 PAR APPLICATION, 2025-2035 (milliards USD)
    15. 7.16 ESTIMATIONS DE LA TAILLE DU MARCHÉ JAPONAIS ; PRÉVISION
      1. 7.16.1 PAR TYPE DE MATÉRIAU, 2025-2035 (milliards USD)
      2. 7.16.2 PAR TYPE DE PRODUIT, 2025-2035 (milliards USD)
      3. 7.16.3 PAR TAILLE, 2025-2035 (milliards USD)
      4. 7.16.4 PAR APPLICATION, 2025-2035 (milliards USD)
    16. 7.17 ESTIMATIONS DE LA TAILLE DU MARCHÉ CORÉEN DU SUD ; PRÉVISION
      1. 7.17.1 PAR TYPE DE MATÉRIAU, 2025-2035 (milliards USD)
      2. 7.17.2 PAR TYPE DE PRODUIT, 2025-2035 (milliards USD)
      3. 7.17.3 PAR TAILLE, 2025-2035 (milliards USD)
      4. 7.17.4 PAR APPLICATION, 2025-2035 (milliards USD)
    17. 7.18 ESTIMATIONS DE LA TAILLE DU MARCHÉ MALAYSIEN ; PRÉVISION
      1. 7.18.1 PAR TYPE DE MATÉRIAU, 2025-2035 (milliards USD)
      2. 7.18.2 PAR TYPE DE PRODUIT, 2025-2035 (milliards USD)
      3. 7.18.3 PAR TAILLE, 2025-2035 (milliards USD)
      4. 7.18.4 PAR APPLICATION, 2025-2035 (milliards USD)
    18. 7.19 ESTIMATIONS DE LA TAILLE DU MARCHÉ THAÏLAIS ; PRÉVISION
      1. 7.19.1 PAR TYPE DE MATÉRIAU, 2025-2035 (milliards USD)
      2. 7.19.2 PAR TYPE DE PRODUIT, 2025-2035 (milliards USD)
      3. 7.19.3 PAR TAILLE, 2025-2035 (milliards USD)
      4. 7.19.4 PAR APPLICATION, 2025-2035 (milliards USD)
    19. 7.20 ESTIMATIONS DE LA TAILLE DU MARCHÉ INDONÉSIEN ; PRÉVISION
      1. 7.20.1 PAR TYPE DE MATÉRIAU, 2025-2035 (milliards USD)
      2. 7.20.2 PAR TYPE DE PRODUIT, 2025-2035 (milliards USD)
      3. 7.20.3 PAR TAILLE, 2025-2035 (milliards USD)
      4. 7.20.4 PAR APPLICATION, 2025-2035 (milliards USD)
    20. 7.21 ESTIMATIONS DE LA TAILLE DU MARCHÉ RESTE DE L'APAC ; PRÉVISION
      1. 7.21.1 PAR TYPE DE MATÉRIAU, 2025-2035 (milliards USD)
      2. 7.21.2 PAR TYPE DE PRODUIT, 2025-2035 (milliards USD)
      3. 7.21.3 PAR TAILLE, 2025-2035 (milliards USD)
      4. 7.21.4 PAR APPLICATION, 2025-2035 (milliards USD)
    21. 7.22 ESTIMATIONS DE LA TAILLE DU MARCHÉ EN AMÉRIQUE DU SUD ; PRÉVISION
      1. 7.22.1 PAR TYPE DE MATÉRIAU, 2025-2035 (milliards USD)
      2. 7.22.2 PAR TYPE DE PRODUIT, 2025-2035 (milliards USD)
      3. 7.22.3 PAR TAILLE, 2025-2035 (milliards USD)
      4. 7.22.4 PAR APPLICATION, 2025-2035 (milliards USD)
    22. 7.23 ESTIMATIONS DE LA TAILLE DU MARCHÉ BRÉSILIEN ; PRÉVISION
      1. 7.23.1 PAR TYPE DE MATÉRIAU, 2025-2035 (milliards USD)
      2. 7.23.2 PAR TYPE DE PRODUIT, 2025-2035 (milliards USD)
      3. 7.23.3 PAR TAILLE, 2025-2035 (milliards USD)
      4. 7.23.4 PAR APPLICATION, 2025-2035 (milliards USD)
    23. 7.24 ESTIMATIONS DE LA TAILLE DU MARCHÉ MEXICAIN ; PRÉVISION
      1. 7.24.1 PAR TYPE DE MATÉRIAU, 2025-2035 (milliards USD)
      2. 7.24.2 PAR TYPE DE PRODUIT, 2025-2035 (milliards USD)
      3. 7.24.3 PAR TAILLE, 2025-2035 (milliards USD)
      4. 7.24.4 PAR APPLICATION, 2025-2035 (milliards USD)
    24. 7.25 ESTIMATIONS DE LA TAILLE DU MARCHÉ ARGENTIN ; PRÉVISION
      1. 7.25.1 PAR TYPE DE MATÉRIAU, 2025-2035 (milliards USD)
      2. 7.25.2 PAR TYPE DE PRODUIT, 2025-2035 (milliards USD)
      3. 7.25.3 PAR TAILLE, 2025-2035 (milliards USD)
      4. 7.25.4 PAR APPLICATION, 2025-2035 (milliards USD)
    25. 7.26 ESTIMATIONS DE LA TAILLE DU MARCHÉ RESTE DE L'AMÉRIQUE DU SUD ; PRÉVISION
      1. 7.26.1 PAR TYPE DE MATÉRIAU, 2025-2035 (milliards USD)
      2. 7.26.2 PAR TYPE DE PRODUIT, 2025-2035 (milliards USD)
      3. 7.26.3 PAR TAILLE, 2025-2035 (milliards USD)
      4. 7.26.4 PAR APPLICATION, 2025-2035 (milliards USD)
    26. 7.27 ESTIMATIONS DE LA TAILLE DU MARCHÉ MEA ; PRÉVISION
      1. 7.27.1 PAR TYPE DE MATÉRIAU, 2025-2035 (milliards USD)
      2. 7.27.2 PAR TYPE DE PRODUIT, 2025-2035 (milliards USD)
      3. 7.27.3 PAR TAILLE, 2025-2035 (milliards USD)
      4. 7.27.4 PAR APPLICATION, 2025-2035 (milliards USD)
    27. 7.28 ESTIMATIONS DE LA TAILLE DU MARCHÉ DES PAYS DU CCG ; PRÉVISION
      1. 7.28.1 PAR TYPE DE MATÉRIAU, 2025-2035 (milliards USD)
      2. 7.28.2 PAR TYPE DE PRODUIT, 2025-2035 (milliards USD)
      3. 7.28.3 PAR TAILLE, 2025-2035 (milliards USD)
      4. 7.28.4 PAR APPLICATION, 2025-2035 (milliards USD)
    28. 7.29 ESTIMATIONS DE LA TAILLE DU MARCHÉ EN AFRIQUE DU SUD ; PRÉVISION
      1. 7.29.1 PAR TYPE DE MATÉRIAU, 2025-2035 (milliards USD)
      2. 7.29.2 PAR TYPE DE PRODUIT, 2025-2035 (milliards USD)
      3. 7.29.3 PAR TAILLE, 2025-2035 (milliards USD)
      4. 7.29.4 PAR APPLICATION, 2025-2035 (milliards USD)
    29. 7.30 ESTIMATIONS DE LA TAILLE DU MARCHÉ RESTE DE LA MEA ; PRÉVISION
      1. 7.30.1 PAR TYPE DE MATÉRIAU, 2025-2035 (milliards USD)
      2. 7.30.2 PAR TYPE DE PRODUIT, 2025-2035 (milliards USD)
      3. 7.30.3 PAR TAILLE, 2025-2035 (milliards USD)
      4. 7.30.4 PAR APPLICATION, 2025-2035 (milliards USD)
    30. 7.31 LANCEMENT DE PRODUIT / DÉVELOPPEMENT / APPROBATION
  4. 7.31.1
    1. 7.32 ACQUISITION / PARTENARIAT
  5. 7.32.1

Type de matériau de protection d'écran de smartphone Outlook (milliards USD, 2018-2032)
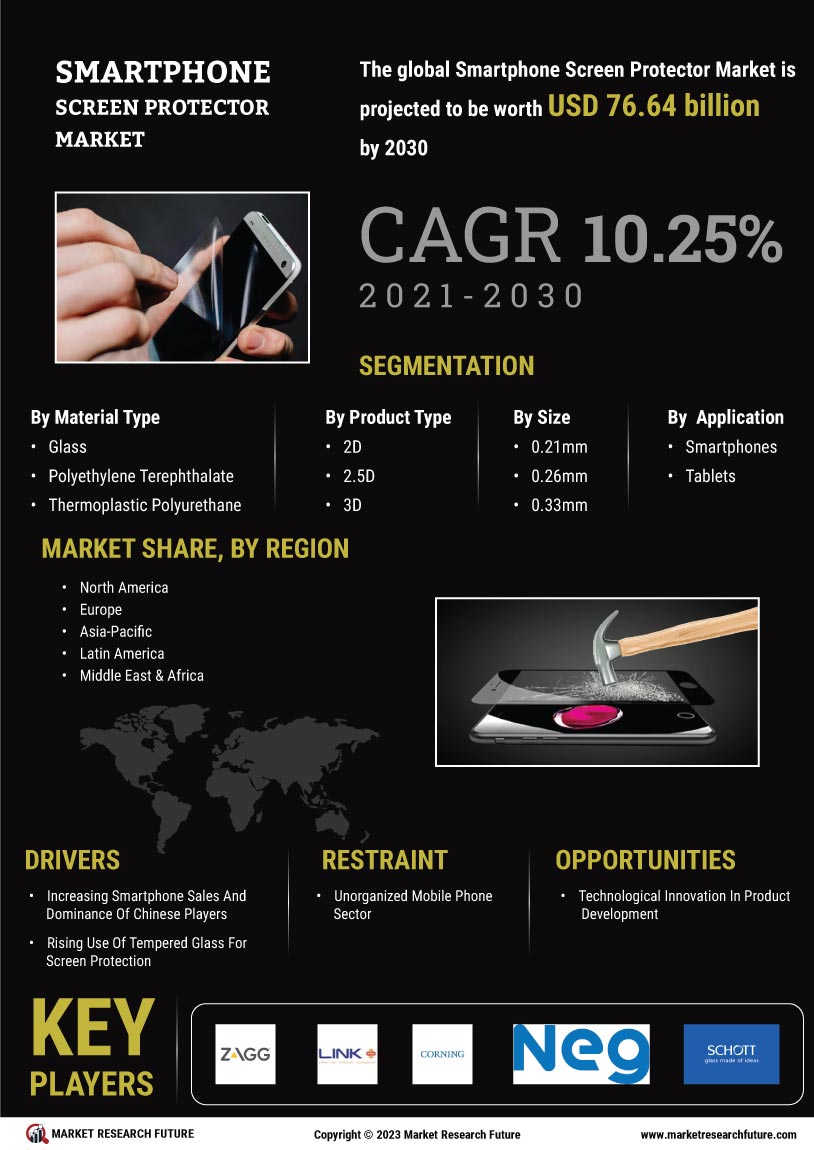
Verre

Polyéthylène Téréphtalate

Polyuréthane Thermoplastique

Type de produit de protection d'écran de smartphone Outlook (milliards USD, 2018-2032)

2D

2,5D

3D

Verre Trempé 9H

Taille de protection d'écran de smartphone Outlook (milliards USD, 2018-2032)

0,21 mm

0,26 mm

0,33 mm

0,48 mm

Application de protection d'écran de smartphone Outlook (milliards USD, 2018-2032)

Smartphones

Tablettes

Outlook régional de protection d'écran de smartphone (milliards USD, 2018-2032)

Outlook Amérique du Nord (milliards USD, 2018-2032)

Protection d'écran de smartphone par type de matériau

Verre

Polyéthylène Téréphtalate

Polyuréthane Thermoplastique

Protection d'écran de smartphone par type de produit

2D

2,5D

3D

Verre Trempé 9H

Protection d'écran de smartphone par taille

0,21 mm

0,26 mm

0,33 mm

0,48 mm

Protection d'écran de smartphone par application

Smartphones

Tablettes

Outlook États-Unis (milliards USD, 2018-2032)

Protection d'écran de smartphone par type de matériau

Verre

Polyéthylène Téréphtalate

Polyuréthane Thermoplastique

Protection d'écran de smartphone par type de produit

2D

2,5D

3D

Verre Trempé 9H

Protection d'écran de smartphone par taille

0,21 mm

0,26 mm

0,33 mm

0,48 mm

Protection d'écran de smartphone par application

Smartphones

Tablettes

Outlook Canada (milliards USD, 2018-2032)

Protection d'écran de smartphone par type de matériau

Verre

Polyéthylène Téréphtalate

Polyuréthane Thermoplastique

Protection d'écran de smartphone par type de produit

2D

2,5D

3D

Verre Trempé 9H

Protection d'écran de smartphone par taille

0,21 mm

0,26 mm

0,33 mm

0,48 mm

Protection d'écran de smartphone par application

Smartphones

Tablettes

Outlook Europe (milliards USD, 2018-2032)

Protection d'écran de smartphone par type de matériau

Verre

Polyéthylène Téréphtalate

Polyuréthane Thermoplastique

Protection d'écran de smartphone par type de produit

2D

2,5D

3D

Verre Trempé 9H

Protection d'écran de smartphone par taille

0,21 mm

0,26 mm

0,33 mm

0,48 mm

Protection d'écran de smartphone par application

Smartphones

Tablettes

Outlook Allemagne (milliards USD, 2018-2032)

Protection d'écran de smartphone par type de matériau

Verre

Polyéthylène Téréphtalate

Polyuréthane Thermoplastique

Protection d'écran de smartphone par type de produit

2D

2,5D

3D

Verre Trempé 9H

Protection d'écran de smartphone par taille

0,21 mm

0,26 mm

0,33 mm

0,48 mm

Protection d'écran de smartphone par application

Smartphones

Tablettes

Outlook France (milliards USD, 2018-2032)

Protection d'écran de smartphone par type de matériau

Verre

Polyéthylène Téréphtalate

Polyuréthane Thermoplastique

Protection d'écran de smartphone par type de produit

2D

2,5D

3D

Verre Trempé 9H

Protection d'écran de smartphone par taille

0,21 mm

0,26 mm

0,33 mm

0,48 mm

Protection d'écran de smartphone par application

Smartphones

Tablettes

Outlook Royaume-Uni (milliards USD, 2018-2032)

Protection d'écran de smartphone par type de matériau

Verre

Polyéthylène Téréphtalate

Polyuréthane Thermoplastique

Protection d'écran de smartphone par type de produit

2D

2,5D

3D

Verre Trempé 9H

Protection d'écran de smartphone par taille

0,21 mm

0,26 mm

0,33 mm

0,48 mm

Protection d'écran de smartphone par application

Smartphones

Tablettes

Outlook Italie (milliards USD, 2018-2032)

Protection d'écran de smartphone par type de matériau

Verre

Polyéthylène Téréphtalate

Polyuréthane Thermoplastique

Protection d'écran de smartphone par type de produit

2D

2,5D

3D

Verre Trempé 9H

Protection d'écran de smartphone par taille

0,21 mm

0,26 mm

0,33 mm

0,48 mm

Protection d'écran de smartphone par application

Smartphones

Tablettes

Outlook Espagne (milliards USD, 2018-2032)

Protection d'écran de smartphone par type de matériau

Verre

Polyéthylène Téréphtalate

Polyuréthane Thermoplastique

Protection d'écran de smartphone par type de produit

2D

2,5D

3D

Verre Trempé 9H

Protection d'écran de smartphone par taille

0,21 mm

0,26 mm

0,33 mm

0,48 mm

Protection d'écran de smartphone par application

Smartphones

Tablettes

Outlook Reste de l'Europe (milliards USD, 2018-2032)

Protection d'écran de smartphone par type de matériau

Verre

Polyéthylène Téréphtalate

Polyuréthane Thermoplastique

Protection d'écran de smartphone par type de produit

2D

2,5D

3D

Verre Trempé 9H

Protection d'écran de smartphone par taille

0,21 mm

0,26 mm

0,33 mm

0,48 mm

Protection d'écran de smartphone par application

Smartphones

Tablettes

Outlook Asie-Pacifique (milliards USD, 2018-2032)

Protection d'écran de smartphone par type de matériau

Verre

Polyéthylène Téréphtalate

Polyuréthane Thermoplastique

Protection d'écran de smartphone par type de produit

2D

2,5D

3D

Verre Trempé 9H

Protection d'écran de smartphone par taille

0,21 mm

0,26 mm

0,33 mm

0,48 mm

Protection d'écran de smartphone par application

Smartphones

Tablettes

Outlook Chine (milliards USD, 2018-2032)

Protection d'écran de smartphone par type de matériau

Verre

Polyéthylène Téréphtalate

Polyuréthane Thermoplastique

Protection d'écran de smartphone par type de produit

2D

2,5D

3D

Verre Trempé 9H

Protection d'écran de smartphone par taille

0,21 mm

0,26 mm

0,33 mm

0,48 mm

Protection d'écran de smartphone par application

Smartphones

Tablettes

Outlook Japon (milliards USD, 2018-2032)

Protection d'écran de smartphone par type de matériau

Verre

Polyéthylène Téréphtalate

Polyuréthane Thermoplastique

Protection d'écran de smartphone par type de produit

2D

2,5D

3D

Verre Trempé 9H

Protection d'écran de smartphone par taille

0,21 mm

0,26 mm

0,33 mm

0,48 mm

Protection d'écran de smartphone par application

Smartphones

Tablettes

Outlook Inde (milliards USD, 2018-2032)

Protection d'écran de smartphone par type de matériau

Verre

Polyéthylène Téréphtalate

Polyuréthane Thermoplastique

Protection d'écran de smartphone par type de produit

2D

2,5D

3D

Verre Trempé 9H

Protection d'écran de smartphone par taille

0,21 mm

0,26 mm

0,33 mm

0,48 mm

Protection d'écran de smartphone par application

Smartphones

Tablettes

Outlook Australie (milliards USD, 2018-2032)

Protection d'écran de smartphone par type de matériau

Verre

Polyéthylène Téréphtalate

Polyuréthane Thermoplastique

Protection d'écran de smartphone par type de produit

2D

2,5D

3D

Verre Trempé 9H

Protection d'écran de smartphone par taille

0,21 mm

0,26 mm

0,33 mm

0,48 mm

Protection d'écran de smartphone par application

Smartphones

Tablettes

Outlook Reste de l'Asie-Pacifique (milliards USD, 2018-2032)

Protection d'écran de smartphone par type de matériau

Verre

Polyéthylène Téréphtalate

Polyuréthane Thermoplastique

Protection d'écran de smartphone par type de produit

2D

2,5D

3D

Verre Trempé 9H

Protection d'écran de smartphone par taille

0,21 mm

0,26 mm

0,33 mm

0,48 mm

Protection d'écran de smartphone par application

Smartphones

Tablettes

Outlook Reste du monde (milliards USD, 2018-2032)

Protection d'écran de smartphone par type de matériau

Verre

Polyéthylène Téréphtalate

Polyuréthane Thermoplastique

Protection d'écran de smartphone par type de produit

2D

2,5D

3D

Verre Trempé 9H

Protection d'écran de smartphone par taille

0,21 mm

0,26 mm

0,33 mm

0,48 mm

Protection d'écran de smartphone par application

Smartphones

Tablettes

Outlook Moyen-Orient (milliards USD, 2018-2032)

Protection d'écran de smartphone par type de matériau

Verre

Polyéthylène Téréphtalate

Polyuréthane Thermoplastique

Protection d'écran de smartphone par type de produit

2D

2,5D

3D

Verre Trempé 9H

Protection d'écran de smartphone par taille

0,21 mm

0,26 mm

0,33 mm

0,48 mm

Protection d'écran de smartphone par application

Smartphones

Tablettes

Outlook Afrique (milliards USD, 2018-2032)

Protection d'écran de smartphone par type de matériau

Verre

Polyéthylène Téréphtalate

Polyuréthane Thermoplastique

Protection d'écran de smartphone par type de produit

2D

2,5D

3D

Verre Trempé 9H

Protection d'écran de smartphone par taille

0,21 mm

0,26 mm

0,33 mm

0,48 mm

Protection d'écran de smartphone par application

Smartphones

Tablettes

Outlook Amérique Latine (milliards USD, 2018-2032)

Protection d'écran de smartphone par type de matériau

Verre

Polyéthylène Téréphtalate

Polyuréthane Thermoplastique

Protection d'écran de smartphone par type de produit

2D

2,5D

3D

Verre Trempé 9H

Protection d'écran de smartphone par taille

0,21 mm

0,26 mm

0,33 mm

0,48 mm

Protection d'écran de smartphone par application

Smartphones

Tablettes

Compare Licence

×
Features License Type
Single User Multiuser License Enterprise User
Price $4,950 $5,950 $7,250
Maximum User Access Limit 1 User Upto 10 Users Unrestricted Access Throughout the Organization
Free Customization
Direct Access to Analyst
Deliverable Format
Platform Access
Discount on Next Purchase 10% 15% 15%
Printable Versions