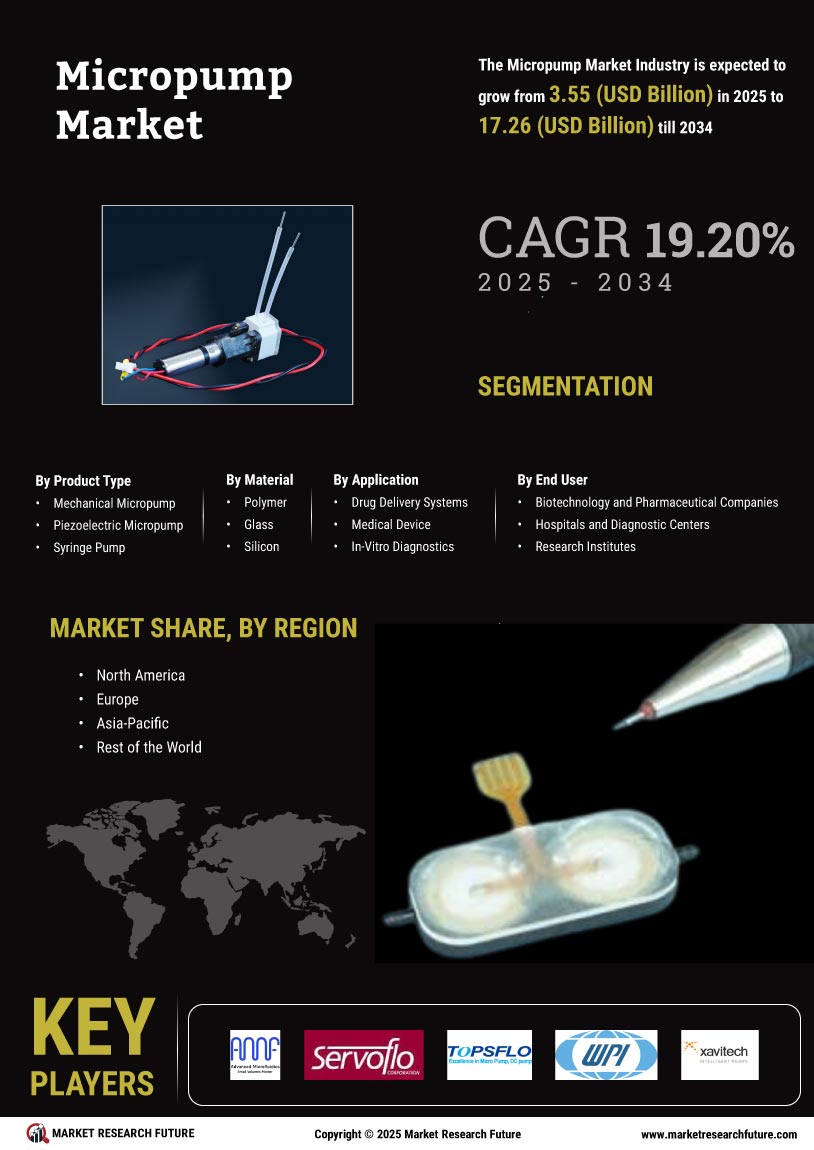
Marché des micro pompes
-
1 Introduction
- 1.1 Définition 11
- 1.2 Portée de l'étude 11
- 1.3 Objectif de recherche 11
-
1.4 Hypothèses et limitations 12
- 1.4.1 Hypothèses 12
- 1.4.2 Limitations 12
- 1.5 Structure du marché 12
-
2 Méthodologie de recherche
- 2.1 Processus de recherche 13
- 2.2 Recherche primaire 14
- 2.3 Recherche secondaire 14
-
3 Dynamique du marché
- 3.1 Introduction 15
-
3.2 Facteurs moteurs 15
- 3.2.1 Changements dans le mélange de matériaux offrant des opportunités pour de nouveaux acteurs 16
- 3.2.2 Augmentation de la demande mondiale pour les tests au point de soins 16
- 3.2.3 Sensibilisation croissante à l'importance de la délivrance contrôlée de médicaments 17
-
3.3 Contraintes 17
- 3.3.1 Problèmes géométriques et de chimie de surface 17
- 3.3.2 Adhésion à des exigences réglementaires strictes 18
-
3.4 Opportunités 19
- 3.4.1 Nouvelles innovations de produits 19
- 3.4.2 Augmentation des partenariats et collaborations 19
-
4 Analyse des facteurs du marché
-
4.1 Modèle des cinq forces de Porter 20
- 4.1.1 Pouvoir de négociation des fournisseurs 21
- 4.1.2 Pouvoir de négociation des acheteurs 21
- 4.1.3 Menace des nouveaux entrants 21
- 4.1.4 Menace des substituts 21
- 4.1.5 Intensité de la rivalité 21
-
4.1 Modèle des cinq forces de Porter 20
-
5 Marché des micro-pompes, par type
- 5.1 Introduction 23
-
5.2 Micro-pompe mécanique 24
- 5.2.1 Micro-pompe piézoélectrique 25
- 5.2.2 Pompe à seringue 25
- 5.2.3 Pompe péristaltique 25
- 5.3 Micro-pompe non mécanique 26
-
6 Marché des micro-pompes, par industrie
- 6.1 Industrie pharmaceutique 29
- 6.2 Dispositifs médicaux 31
- 6.3 Diagnostics in vitro 32
-
7 Marché mondial des micro-pompes, par région
- 7.1 Introduction 34
- 7.2 Amérique du Nord 35
- Marché des micro-pompes, par type
- Marché des micro-pompes, par industrie
- 7.3 Europe 41
- Marché des micro-pompes, par type
- Marché des micro-pompes, par industrie
- 7.4 Asie-Pacifique 52
- Marché des micro-pompes, par type
- Marché des micro-pompes, par industrie
- 7.5 Moyen-Orient et Afrique 62
- Marché des micro-pompes, par type
- Marché des micro-pompes, par industrie
- 8 Analyse de la part des entreprises
-
9 Profil de l'entreprise
-
9.1 Advanced Microfluidics SA 69
- 9.1.1 Présentation de l'entreprise 69
- 9.1.2 Aperçu financier 69
- 9.1.3 Analyse SWOT 70
- 9.1.4 Analyse MRFR 70
-
9.2 Alldoo Micropump 71
- 9.2.1 Présentation de l'entreprise 71
- 9.2.2 Aperçu des segments de produits/activités 71
- 9.2.3 Aperçu financier 71
- 9.2.4 Analyse SWOT 72
- 9.2.5 Analyse MRFR 72
-
9.3 Bio-Chem Fluidics 73
- 9.3.1 Présentation de l'entreprise 73
- 9.3.2 Aperçu des segments de produits/activités 73
- 9.3.3 Aperçu financier 73
- 9.3.4 Développement clé 74
- 9.3.5 Analyse SWOT 75
- 9.3.6 Analyse MRFR 75
-
9.4 Cole-Parmer Instrument Company, LLC. 76
- 9.4.1 Présentation de l'entreprise 76
- 9.4.1 Aperçu des segments de produits/activités 76
- 9.4.2 Aperçu financier 76
- 9.4.3 Développement clé 76
- 9.4.4 Analyse SWOT 77
- 9.4.5 Analyse MRFR 77
-
9.5 Dolomite Centre Ltd 78
- 9.5.1 Présentation de l'entreprise 78
- 9.5.2 Aperçu des segments de produits/activités 78
- 9.5.3 Aperçu financier 79
- 9.5.4 Développement clé 79
- 9.5.5 Analyse SWOT 80
- 9.5.6 Analyse MRFR 80
-
9.6 IDEX Corporation 81
- 9.6.1 Présentation de l'entreprise 81
- 9.6.2 Aperçu des segments de produits/activités 81
- 9.6.3 Aperçu financier 82
- 9.6.4 Développement clé 83
- 9.6.5 Analyse SWOT 84
- 9.6.6 Analyse MRFR 84
-
9.7 KNF Neuberger Inc. 85
- 9.7.1 Présentation de l'entreprise 85
- 9.7.2 Aperçu des produits 85
- 9.7.3 Aperçu financier 86
- 9.7.4 Développement clé 86
- 9.7.5 Analyse SWOT 86
- 9.7.6 Analyse MRFR 87
-
9.8 Microfluidica, LLC 88
- 9.8.1 Présentation de l'entreprise 88
- 9.8.2 Aperçu des segments de produits/activités 88
- 9.8.3 Aperçu financier 88
- 9.8.4 Analyse SWOT 89
- 9.8.5 Analyse MRFR 89
-
9.9 Servoflo Corporation 90
- 9.9.1 Présentation de l'entreprise 90
- 9.9.2 Aperçu des segments de produits/activités 90
- 9.9.3 Aperçu financier 90
- 9.9.4 Développement clé 91
- 9.9.5 Analyse SWOT 91
- 9.9.6 Analyse MRFR 92
-
9.10 Takasago Electric, Inc. 93
- 9.10.1 Présentation de l'entreprise 93
- 9.10.2 Aperçu des segments de produits/activités 93
- 9.10.3 Aperçu financier 93
- 9.10.4 Analyse SWOT 94
- 9.10.5 Analyse MRFR 94
-
9.11 TOPS Industry & Technology Co. Ltd. 95
- 9.11.1 Présentation de l'entreprise 95
- 9.11.2 Aperçu des segments de produits/activités 95
- 9.11.3 Aperçu financier 95
- 9.11.4 Développement clé 95
- 9.11.5 Analyse SWOT 96
- 9.11.6 Analyse MRFR 96
-
9.12 World Precision Instruments 97
- 9.12.1 Présentation de l'entreprise 97
- 9.12.2 Aperçu des segments de produits/activités 97
- 9.12.3 Aperçu financier 97
- 9.12.4 Développement clé 97
- 9.12.5 Analyse SWOT 98
- 9.12.6 Analyse MRFR 98
-
9.13 Xavitech 99
- 9.13.1 Présentation de l'entreprise 99
- 9.13.2 Aperçu des segments de produits/activités 99
- 9.13.3 Aperçu financier 99
- 9.13.4 Développement clé 99
- 9.13.5 Analyse SWOT 100
- 9.13.6 Analyse MRFR 100
-
9.1 Advanced Microfluidics SA 69
-
10 Liste des tableaux
- TABLEAU 1 MARCHÉ MONDIAL DES MICRO-POMPES, PAR TYPE, 2023-2032 (MILLIONS USD) 24
- TABLEAU 2 MARCHÉ MONDIAL DES MICRO-POMPES MÉCANIQUES, PAR RÉGION, 2023-2032 (MILLIONS USD) 26
- TABLEAU 3 MARCHÉ MONDIAL DES MICRO-POMPES NON MÉCANIQUES, PAR RÉGION, 2023-2032 (MILLIONS USD) 27
- TABLEAU 4 MARCHÉ MONDIAL DES MICRO-POMPES, PAR INDUSTRIE, 2023-2032 (MILLIONS USD) 30
- TABLEAU 5 MARCHÉ MONDIAL DES MICRO-POMPES POUR L'INDUSTRIE PHARMACEUTIQUE PAR RÉGION, 2023-2032 (MILLIONS USD) 30
- TABLEAU 6 MARCHÉ MONDIAL DES MICRO-POMPES POUR L'INDUSTRIE DES DISPOSITIFS MÉDICAUX PAR RÉGION, 2023-2032 (MILLIONS USD) 31
- TABLEAU 7 MARCHÉ MONDIAL DES MICRO-POMPES POUR L'INDUSTRIE IVD PAR RÉGION, 2023-2032 (MILLIONS USD) 33
- TABLEAU 8 MARCHÉ MONDIAL DES MICRO-POMPES, PAR RÉGION, 2023-2032 (MILLIONS USD) 35
- TABLEAU 9 MARCHÉ DES MICRO-POMPES EN AMÉRIQUE DU NORD, PAR PAYS, 2023-2032 (MILLIONS USD) 36
- TABLEAU 10 MARCHÉ DES MICRO-POMPES EN AMÉRIQUE DU NORD, PAR TYPE, 2023-2032 (MILLIONS USD) 37
- TABLEAU 11 MARCHÉ DES MICRO-POMPES EN AMÉRIQUE DU NORD, PAR INDUSTRIE, 2023-2032 (MILLIONS USD) 38
- TABLEAU 12 MARCHÉ DES MICRO-POMPES AUX ÉTATS-UNIS, PAR TYPE, 2023-2032 (MILLIONS USD) 39
- TABLEAU 13 MARCHÉ DES MICRO-POMPES AUX ÉTATS-UNIS, PAR INDUSTRIE, 2023-2032 (MILLIONS USD) 39
- TABLEAU 14 MARCHÉ DES MICRO-POMPES AU CANADA, PAR TYPE, 2023-2032 (MILLIONS USD) 40
- TABLEAU 15 MARCHÉ DES MICRO-POMPES AU CANADA, PAR INDUSTRIE, 2023-2032 (MILLIONS USD) 40
- TABLEAU 16 MARCHÉ DES MICRO-POMPES EN EUROPE, PAR PAYS, 2023-2032 (MILLIONS USD) 42
- TABLEAU 17 MARCHÉ DES MICRO-POMPES EN EUROPE, PAR TYPE, 2023-2032 (MILLIONS USD) 43
- TABLEAU 18 MARCHÉ DES MICRO-POMPES EN EUROPE, PAR INDUSTRIE, 2023-2032 (MILLIONS USD) 44
- TABLEAU 19 MARCHÉ DES MICRO-POMPES EN ALLEMAGNE, PAR TYPE, 2023-2032 (MILLIONS USD) 45
- TABLEAU 20 MARCHÉ DES MICRO-POMPES EN ALLEMAGNE, PAR INDUSTRIE, 2023-2032 (MILLIONS USD) 45
- TABLEAU 21 MARCHÉ DES MICRO-POMPES EN FRANCE, PAR TYPE, 2023-2032 (MILLIONS USD) 46
- TABLEAU 22 MARCHÉ DES MICRO-POMPES EN FRANCE, PAR INDUSTRIE, 2023-2032 (MILLIONS USD) 46
- TABLEAU 23 MARCHÉ DES MICRO-POMPES AU ROYAUME-UNI, PAR TYPE, 2023-2032 (MILLIONS USD) 47
- TABLEAU 24 MARCHÉ DES MICRO-POMPES AU ROYAUME-UNI, PAR INDUSTRIE, 2023-2032 (MILLIONS USD) 47
- TABLEAU 25 MARCHÉ DES MICRO-POMPES EN ITALIE, PAR TYPE, 2023-2032 (MILLIONS USD) 48
- TABLEAU 26 MARCHÉ DES MICRO-POMPES EN ITALIE, PAR INDUSTRIE, 2023-2032 (MILLIONS USD) 48
- TABLEAU 27 MARCHÉ DES MICRO-POMPES EN ESPAGNE, PAR TYPE, 2023-2032 (MILLIONS USD) 49
- TABLEAU 28 MARCHÉ DES MICRO-POMPES EN ESPAGNE, PAR INDUSTRIE, 2023-2032 (MILLIONS USD) 49
- TABLEAU 29 MARCHÉ DES MICRO-POMPES DANS LE RESTE DE L'EUROPE DE L'OUEST, PAR TYPE, 2023-2032 (MILLIONS USD) 50
- TABLEAU 30 MARCHÉ DES MICRO-POMPES DANS LE RESTE DE L'EUROPE DE L'OUEST, PAR INDUSTRIE, 2023-2032 (MILLIONS USD) 50
- TABLEAU 31 MARCHÉ DES MICRO-POMPES EN EUROPE DE L'EST, PAR TYPE, 2023-2032 (MILLIONS USD) 51
- TABLEAU 32 MARCHÉ DES MICRO-POMPES EN EUROPE DE L'EST, PAR INDUSTRIE, 2023-2032 (MILLIONS USD) 51
- TABLEAU 33 MARCHÉ DES MICRO-POMPES EN ASIE-PACIFIQUE, PAR PAYS, 2023-2032 (MILLIONS USD) 53
- TABLEAU 34 MARCHÉ DES MICRO-POMPES EN ASIE-PACIFIQUE, PAR TYPE, 2023-2032 (MILLIONS USD) 54
- TABLEAU 35 MARCHÉ DES MICRO-POMPES EN ASIE-PACIFIQUE, PAR INDUSTRIE, 2023-2032 (MILLIONS USD) 55
- TABLEAU 36 MARCHÉ DES MICRO-POMPES AU JAPON, PAR TYPE, 2023-2032 (MILLIONS USD) 55
- TABLEAU 37 MARCHÉ DES MICRO-POMPES AU JAPON, PAR INDUSTRIE, 2023-2032 (MILLIONS USD) 56
- TABLEAU 38 MARCHÉ DES MICRO-POMPES EN CHINE, PAR TYPE, 2023-2032 (MILLIONS USD) 56
- TABLEAU 39 MARCHÉ DES MICRO-POMPES EN CHINE, PAR INDUSTRIE, 2023-2032 (MILLIONS USD) 57
- TABLEAU 40 MARCHÉ DES MICRO-POMPES EN INDE, PAR TYPE, 2023-2032 (MILLIONS USD) 57
- TABLEAU 41 MARCHÉ DES MICRO-POMPES EN INDE, PAR INDUSTRIE, 2023-2032 (MILLIONS USD) 58
- TABLEAU 42 MARCHÉ DES MICRO-POMPES EN CORÉE DU SUD, PAR TYPE, 2023-2032 (MILLIONS USD) 58
- TABLEAU 43 MARCHÉ DES MICRO-POMPES EN CORÉE DU SUD, PAR INDUSTRIE, 2023-2032 (MILLIONS USD) 59
- TABLEAU 44 MARCHÉ DES MICRO-POMPES EN AUSTRALIE, PAR TYPE, 2023-2032 (MILLIONS USD) 59
- TABLEAU 45 MARCHÉ DES MICRO-POMPES EN AUSTRALIE, PAR INDUSTRIE, 2023-2032 (MILLIONS USD) 60
- TABLEAU 46 MARCHÉ DES MICRO-POMPES DANS LE RESTE DE L'ASIE-PACIFIQUE, PAR TYPE, 2023-2032 (MILLIONS USD) 60
- TABLEAU 47 MARCHÉ DES MICRO-POMPES DANS LE RESTE DE L'ASIE-PACIFIQUE, PAR INDUSTRIE, 2023-2032 (MILLIONS USD) 61
- TABLEAU 48 MARCHÉ DES MICRO-POMPES AU MOYEN-ORIENT ET EN AFRIQUE, PAR RÉGION, 2023-2032 (MILLIONS USD) 63
- TABLEAU 49 MARCHÉ DES MICRO-POMPES AU MOYEN-ORIENT ET EN AFRIQUE, PAR TYPE, 2023-2032 (MILLIONS USD) 63
- TABLEAU 50 MARCHÉ DES MICRO-POMPES AU MOYEN-ORIENT ET EN AFRIQUE, PAR INDUSTRIE, 2023-2032 (MILLIONS USD) 64
- TABLEAU 51 MARCHÉ DES MICRO-POMPES AU MOYEN-ORIENT, PAR TYPE, 2023-2032 (MILLIONS USD) 65
- TABLEAU 52 MARCHÉ DES MICRO-POMPES AU MOYEN-ORIENT, PAR INDUSTRIE, 2023-2032 (MILLIONS USD) 65
- TABLEAU 53 MARCHÉ DES MICRO-POMPES EN AFRIQUE, PAR TYPE, 2023-2032 (MILLIONS USD) 66
- TABLEAU 54 MARCHÉ DES MICRO-POMPES EN AFRIQUE, PAR INDUSTRIE, 2023-2032 (MILLIONS USD) 66
- TABLEAU 55 BIO-CHEM FLUIDICS : DÉVELOPPEMENT CLÉ 74
- TABLEAU 56 COLE-PARMER INSTRUMENT COMPANY, LLC. : DÉVELOPPEMENT CLÉ 76
- TABLEAU 57 DOLOMITE CENTRE LTD : DÉVELOPPEMENT CLÉ 79
- TABLEAU 58 IDEX CORPORATION : DÉVELOPPEMENT CLÉ 83
- TABLEAU 59 KNF NEUBERGER INC : DÉVELOPPEMENT CLÉ 86
- TABLEAU 60 SERVOFLO CORPORATION : DÉVELOPPEMENT CLÉ 91
- TABLEAU 61 TOPS INDUSTRY & TECHNOLOGY CO. LTD. : DÉVELOPPEMENT CLÉ 95
- TABLEAU 62 WORLD PRECISION INSTRUMENT : DÉVELOPPEMENT CLÉ 97
- TABLEAU 63 XAVITECH : DÉVELOPPEMENT CLÉ 99
- 11 Liste des figures
- FIGURE 1 PROCESSUS DE RECHERCHE DE MRFR 13
- FIGURE 2 DYNAMIQUE DU MARCHÉ 15
- FIGURE 3 ANALYSE D'IMPACT DES FACTEURS MOTEURS SUR LA CROISSANCE GLOBALE DU MARCHÉ 17
- FIGURE 4 ANALYSE D'IMPACT DES CONTRAINTES SUR LA CROISSANCE GLOBALE DU MARCHÉ 18
- FIGURE 5 MODÈLE DES CINQ FORCES DE PORTER 20
- FIGURE 6 MARCHÉ MONDIAL DES MICRO-POMPES, PAR TYPE, 2023-2032 (MILLIONS USD) 24
- FIGURE 7 MARCHÉ MONDIAL DES MICRO-POMPES, PAR INDUSTRIE, 2023-2032 (MILLIONS USD) 29
- FIGURE 8 MARCHÉ MONDIAL DES MICRO-POMPES, PAR RÉGION, 2020 (%) 34
- FIGURE 9 PART DE MARCHÉ DES MICRO-POMPES EN AMÉRIQUE DU NORD, 2020 (%) 36
- FIGURE 10 MARCHÉ DES MICRO-POMPES EN AMÉRIQUE DU NORD, PAR TYPE, 2023-2032 (MILLIONS USD) 37
- FIGURE 11 MARCHÉ DES MICRO-POMPES EN AMÉRIQUE DU NORD, PAR INDUSTRIE, 2023-2032 (MILLIONS USD) 38
- FIGURE 12 PART DE MARCHÉ DES MICRO-POMPES EN EUROPE, 2020 (%) 42
- FIGURE 13 MARCHÉ DES MICRO-POMPES EN EUROPE, PAR TYPE, 2023-2032 (MILLIONS USD) 43
- FIGURE 14 MARCHÉ DES MICRO-POMPES EN EUROPE, PAR INDUSTRIE, 2023-2032 (MILLIONS USD) 44
- FIGURE 15 PART DE MARCHÉ DES MICRO-POMPES EN ASIE-PACIFIQUE, 2020 (%) 52
- FIGURE 16 MARCHÉ DES MICRO-POMPES EN ASIE-PACIFIQUE, PAR TYPE, 2023-2032 (MILLIONS USD) 53
- FIGURE 17 MARCHÉ DES MICRO-POMPES EN ASIE-PACIFIQUE, PAR INDUSTRIE, 2023-2032 (MILLIONS USD) 54
- FIGURE 18 PART DE MARCHÉ DES MICRO-POMPES EN ASIE-PACIFIQUE, 2020 (%) 62
- FIGURE 19 MARCHÉ DES MICRO-POMPES AU MOYEN-ORIENT ET EN AFRIQUE, PAR TYPE, 2023-2032 (MILLIONS USD) 63
- FIGURE 20 MARCHÉ DES MICRO-POMPES AU MOYEN-ORIENT ET EN AFRIQUE, PAR INDUSTRIE, 2023-2032 (MILLIONS USD) 64
- FIGURE 21 ANALYSE DE LA PART DES ENTREPRISES 67
- FIGURE 22 ADVANCED MICROFLUIDICS SA : ANALYSE SWOT 70
- FIGURE 23 ADVANCED MICROFLUIDICS SA : ANALYSE SWOT 72
- FIGURE 24 BIO-CHEM FLUIDICS : RÉSULTATS FINANCIERS RÉCENTS 73
- FIGURE 25 BIO-CHEM FLUIDICS : SEGMENTS D'ACTIVITÉ 74
- FIGURE 26 BIO-CHEM FLUIDICS : ANALYSE SWOT 75
- FIGURE 27 COLE-PARMER INSTRUMENT COMPANY, LLC. : ANALYSE SWOT 77
- FIGURE 28 DOLOMITE CENTRE LTD : ANALYSE SWOT 80
- FIGURE 29 IDEX CORPORATION : RÉSULTATS FINANCIERS RÉCENTS 82
- FIGURE 30 IDEX CORPORATION : MIX DE REVENUS D'ACTIVITÉ (2020) 82
- FIGURE 31 IDEX CORPORATION : MIX DE REVENUS GÉOGRAPHIQUE 83
- FIGURE 32 IDEX CORPORATION : ANALYSE SWOT 84
- FIGURE 33 KNF NEUBERGER INC : ANALYSE SWOT 86
- FIGURE 34 MICROFLUIDICA LLC : ANALYSE SWOT 89
- FIGURE 35 SERVOFLO CORPORATION : ANALYSE SWOT 91
- FIGURE 36 TAKASAGO ELECTRIC, INC. : ANALYSE SWOT 94
- FIGURE 37 TOPS INDUSTRY & TECHNOLOGY CO. LTD. : ANALYSE SWOT 96
- FIGURE 38 WORLD PRECISION INSTRUMENT : ANALYSE SWOT 98
- FIGURE 39 XAVITECH : ANALYSE SWOT 100
Customer Stories

“This is really good guys. Excellent work on a tight deadline. I will continue to use you going forward and recommend you to others. Nice job”

“Thanks. It’s been a pleasure working with you, please use me as reference with any other Intel employees.”

“Thanks for sending the report it gives us a good global view of the Betaïne market.”

“Thank you, this will be very helpful for OQS.”

“We found the report very insightful! we found your research firm very helpful. I'm sending this email to secure our future business.”

“I am very pleased with how market segments have been defined in a relevant way for my purposes (such as "Portable Freezers & refrigerators" and "last-mile"). In general the report is well structured. Thanks very much for your efforts.”

“I have been reading the first document or the study, ,the Global HVAC and FP market report 2021 till 2026. Must say, good info! I have not gone in depth at all parts, but got a good indication of the data inside!”

“We got the report in time, we really thank you for your support in this process. I also thank to all of your team as they did a great job.”