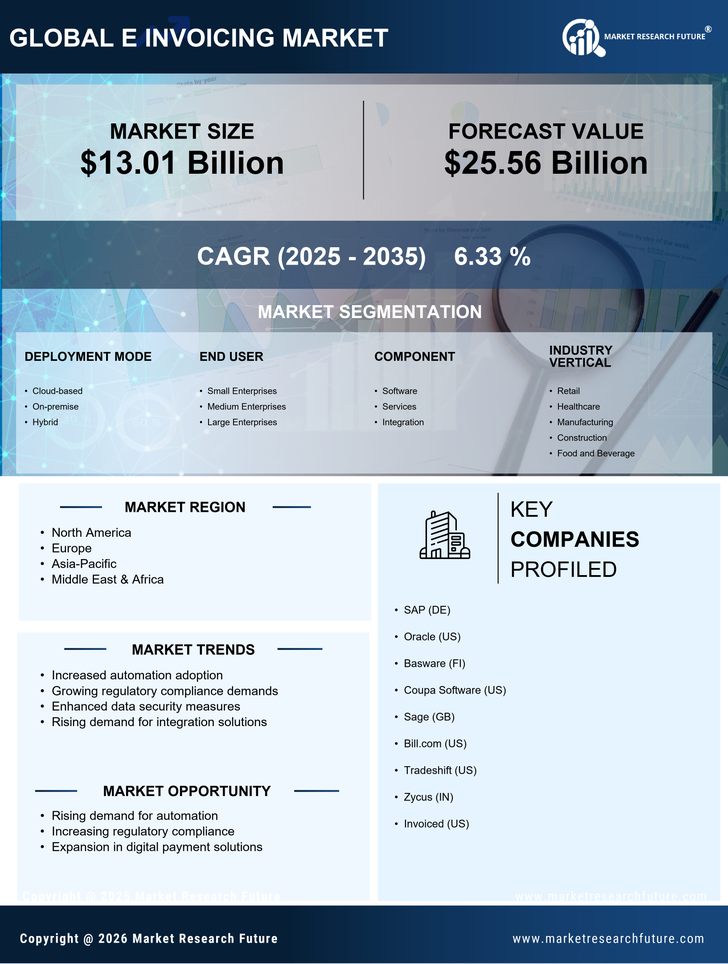
Request Free Sample ×

Kindly complete the form below to receive a free sample of this Report

* Please use a valid business email

Leading companies partner with us for data-driven Insights

clients tt-cursor
Hero Background

E Invoicing Market

ID: MRFR/ICT/34124-HCR
100 Pages
Aarti Dhapte
Last Updated: April 06, 2026

Rapport d’étude de marché sur la facturation électronique : par mode de déploiement (basé sur le cloud, sur site, hybride), par utilisateur final (petites entreprises, moyennes entreprises, grandes entreprises), par composant (logiciels, services, intégration), par secteur vertical (vente au détail, soins de santé, fabrication, construction, alimentation et boissons) et par région (Amérique du Nord, Europe, Amérique du Sud, Asie-Pacifique, Moyen-Orient et Afrique) – Prévisions jusqu’en 2034

Partager
Download PDF ×

We do not share your information with anyone. However, we may send you emails based on your report interest from time to time. You may contact us at any time to opt-out.

E Invoicing Market Infographic
Purchase Options
  1. 1 RÉSUMÉ EXÉCUTIF
    1. 1.1 Aperçu du marché
    2. 1.2 Principales conclusions
    3. 1.3 Segmentation du marché
    4. 1.4 Paysage concurrentiel
    5. 1.5 Défis et opportunités
    6. 1.6 Perspectives d'avenir
  2. 2 INTRODUCTION AU MARCHÉ
    1. 2.1 Définition
    2. 2.2 Périmètre de l'étude
      1. 2.2.1 Objectif de recherche
      2. 2.2.2 Hypothèse
      3. 2.2.3 Limites
  3. 3 METHODOLOGIE DE RECHERCHE
    1. 3.1 Présentation
    2. 3.2 Exploration de données
    3. 3.3 Recherche secondaire
    4. 3.4 Recherche primaire
      1. 3.4.1 Entretiens primaires et processus de collecte d'informations
      2. 3.4.2 Répartition des principaux répondants
    5. 3.5 Modèle de prévision
    6. 3.6 Estimation de la taille du marché
      1. 3.6.1 Approche ascendante
      2. 3.6.2 Approche descendante
    7. 3.7 Triangulation des données
    8. 3.8 Validation
  4. 4 DYNAMIQUE DU MARCHÉ
    1. 4.1 Présentation
    2. 4.2 Pilotes
    3. 4.3 Contraintes
    4. 4.4 Opportunités
  5. 5 ANALYSE DES FACTEURS DE MARCHÉ
    1. 5.1 Analyse de la chaîne de valeur
    2. 5.2 Analyse des cinq forces de Porter
      1. 5.2.1 Pouvoir de négociation des fournisseurs
      2. 5.2.2 Pouvoir de négociation des acheteurs
      3. 5.2.3 Menace des nouveaux entrants
      4. 5.2.4 Menace des remplaçants
      5. 5.2.5 Intensité de la rivalité
    3. 5.3 Analyse d'impact du COVID-19
      1. 5.3.1 Analyse d'impact sur le marché
      2. 5.3.2 Impact régional
      3. 5.3.3 Analyse des opportunités et des menaces
  6. 6 E MARCHÉ DE LA FACTURATION, PAR MODE DE DÉPLOIEMENT (MILLIARDS USD)
    1. 6.1 Basé sur le cloud
    2. 6.2 Sur site
    3. 6.3 Hybride
  7. 7 E MARCHÉ DE LA FACTURATION, PAR UTILISATEUR FINAL (MILLIARDS USD)
    1. 7.1 Petites entreprises
    2. 7.2 Moyennes entreprises
    3. 7.3 Grandes entreprises
  8. 8 E MARCHÉ DE LA FACTURATION, PAR COMPOSANTE (MILLIARDS USD)
    1. 8.1 Logiciel
    2. 8.2 Prestations
    3. 8.3 Intégration
  9. 9 E MARCHÉ DE LA FACTURATION, PAR INDUSTRIE VERTICALE (MILLIARDS USD)
    1. 9.1 Vente au détail
    2. 9.2 Santé
    3. 9.3 Fabrication
    4. 9.4 Construction
    5. 9.5 Aliments et boissons
  10. 10 E MARCHÉ DE LA FACTURATION, PAR RÉGION (MILLIARDS USD)
    1. 10.1 Amérique du Nord
      1. 10.1.1 États-Unis
      2. 10.1.2 Canada
    2. 10.2 Europe
      1. 10.2.1 Allemagne
      2. 10.2.2 Royaume-Uni
      3. 10.2.3 France
      4. 10.2.4 Russie
      5. 10.2.5 Italie
      6. 10.2.6 Espagne
      7. 10.2.7 Reste de l'Europe
    3. 10.3 APAC
      1. 10.3.1 Chine
      2. 10.3.2 Inde
      3. 10.3.3 Japon
      4. 10.3.4 Corée du Sud
      5. 10.3.5 Malaisie
      6. 10.3.6 Thaïlande
      7. 10.3.7 Indonésie
      8. 10.3.8 Reste de l'APAC
    4. 10.4 Amérique du Sud
      1. 10.4.1 Brésil
      2. 10.4.2 Mexique
      3. 10.4.3 Argentine
      4. 10.4.4 Reste de l'Amérique du Sud
    5. 10.5 AME
      1. 10.5.1 Pays du CCG
      2. 10.5.2 Afrique du Sud
      3. 10.5.3 Reste du MEA
  11. 11 PAYSAGE CONCURRENTIEL
    1. 11.1 Présentation
    2. 11.2 Analyse concurrentielle
    3. 11.3 Analyse des parts de marché
    4. 11.4 Stratégie de croissance majeure sur le MARCHÉ DE LA FACTURATION ELECTRIQUE
    5. 11.5 Analyse comparative concurrentielle
    6. 11.6 Acteurs leaders en nombre d'évolutions sur le MARCHÉ DE LA FACTURATION E
    7. 11.7 Développements clés et stratégies de croissance
      1. 11.7.1 Lancement de nouveaux produits/déploiement de services
      2. 11.7.2 Fusion & Acquisitions
      3. 11.7.3 Coentreprises
    8. 11.8 Matrice financière des principaux acteurs
      1. 11.8.1 Chiffre d'affaires et résultat opérationnel
      2. 11.8.2 Dépenses de R&D des principaux acteurs. 2023
  12. 12 PROFILS D'ENTREPRISE
    1. 12.1 Oracle
      1. 12.1.1 Aperçu financier
      2. 12.1.2 Produits proposés
      3. 12.1.3 Développements clés
      4. 12.1.4 Analyse SWOT
      5. 12.1.5 Stratégies clés
    2. 12.2 Bill.com
      1. 12.2.1 Aperçu financier
      2. 12.2.2 Produits proposés
      3. 12.2.3 Développements clés
      4. 12.2.4 Analyse SWOT
      5. 12.2.5 Stratégies clés
    3. 12.3 Invoice2go
      1. 12.3.1 Aperçu financier
      2. 12.3.2 Produits proposés
      3. 12.3.3 Développements clés
      4. 12.3.4 Analyse SWOT
      5. 12.3.5 Stratégies clés
    4. 12.4 PwC
      1. 12.4.1 Aperçu financier
      2. 12.4.2 Produits proposés
      3. 12.4.3 Développements clés
      4. 12.4.4 Analyse SWOT
      5. 12.4.5 Stratégies clés
    5. 12.5 Zahara
      1. 12.5.1 Aperçu financier
      2. 12.5.2 Produits proposés
      3. 12.5.3 Développements clés
      4. 12.5.4 Analyse SWOT
      5. 12.5.5 Stratégies clés
    6. 12.6 SAP
      1. 12.6.1 Aperçu financier
      2. 12.6.2 Produits proposés
      3. 12.6.3 Développements clés
      4. 12.6.4 Analyse SWOT
      5. 12.6.5 Stratégies clés
    7. 12.7 FinancialForce
      1. 12.7.1 Aperçu financier
      2. 12.7.2 Produits proposés
      3. 12.7.3 Développements clés
      4. 12.7.4 Analyse SWOT
      5. 12.7.5 Stratégies clés
    8. 12.8 Coupa
      1. 12.8.1 Aperçu financier
      2. 12.8.2 Produits proposés
      3. 12.8.3 Développements clés
      4. 12.8.4 Analyse SWOT
      5. 12.8.5 Stratégies clés
    9. 12.9 eBillity
      1. 12.9.1 Aperçu financier
      2. 12.9.2 Produits proposés
      3. 12.9.3 Développements clés
      4. 12.9.4 Analyse SWOT
      5. 12.9.5 Stratégies clés
    10. 12.10 Sauge
      1. 12.10.1 Aperçu financier
      2. 12.10.2 Produits offerts
      3. 12.10.3 Développements clés
      4. 12.10.4 Analyse SWOT
      5. 12.10.5 Stratégies clés
    11. 12.11 EY
      1. 12.11.1 Aperçu financier
      2. 12.11.2 Produits offerts
      3. 12.11.3 Développements clés
      4. 12.11.4 Analyse SWOT
      5. 12.11.5 Stratégies clés
    12. 12.12 Xéro
      1. 12.12.1 Aperçu financier
      2. 12.12.2 Produits offerts
      3. 12.12.3 Développements clés
      4. 12.12.4 Analyse SWOT
      5. 12.12.5 Stratégies clés
    13. 12.13 Deloitte
      1. 12.13.1 Aperçu financier
      2. 12.13.2 Produits offerts
      3. 12.13.3 Développements clés
      4. 12.13.4 Analyse SWOT
      5. 12.13.5 Stratégies clés
    14. 12.14 Basware
      1. 12.14.1 Aperçu financier
      2. 12.14.2 Produits offerts
      3. 12.14.3 Développements clés
      4. 12.14.4 Analyse SWOT
      5. 12.14.5 Stratégies clés
    15. 12.15 Tradeshift
      1. 12.15.1 Aperçu financier
      2. 12.15.2 Produits offerts
      3. 12.15.3 Développements clés
      4. 12.15.4 Analyse SWOT
      5. 12.15.5 Stratégies clés
  13. 13 ANNEXE
    1. 13.1 Références
    2. 13.2 Rapports connexes
    3. LISTE DES TABLEAUX
    4. TABLEAU 1. LISTE DES HYPOTHÈSES
    5. TABLEAU 2. AMÉRIQUE DU NORD E ESTIMATIONS DE LA TAILLE DU MARCHÉ DE LA FACTURATION & PRÉVISIONS, PAR MODE DE DÉPLOIEMENT, 2019-2032 (MILLIARDS USD)
    6. TABLEAU 3. AMÉRIQUE DU NORD E ESTIMATIONS DE LA TAILLE DU MARCHÉ DE LA FACTURATION & PRÉVISIONS, PAR UTILISATEUR FINAL, 2019-2032 (MILLIARDS USD)
    7. TABLEAU 4. AMÉRIQUE DU NORD E ESTIMATIONS DE LA TAILLE DU MARCHÉ DE LA FACTURATION ET AMÉRIQUE DU NORD PRÉVISIONS, PAR COMPOSANTE, 2019-2032 (MILLIARDS USD)
    8. TABLEAU 5. AMÉRIQUE DU NORD E ESTIMATIONS DE LA TAILLE ET DU MARCHÉ DE LA FACTURATION PRÉVISIONS, PAR INDUSTRIE VERTICALE, 2019-2032 (MILLIARDS USD)
    9. TABLEAU 6. AMÉRIQUE DU NORD E ESTIMATIONS DE LA TAILLE DU MARCHÉ DE LA FACTURATION ET AMÉRIQUE DU NORD PRÉVISIONS, PAR RÉGIONAL, 2019-2032 (MILLIARDS USD)
    10. TABLEAU 7. ESTIMATIONS ET ESTIMATIONS DE LA TAILLE DU MARCHÉ DE LA FACTURATION AUX ÉTATS-UNIS PRÉVISIONS, PAR MODE DE DÉPLOIEMENT, 2019-2032 (MILLIARDS USD)
    11. TABLEAU 8. ESTIMATIONS ET ESTIMATIONS DE LA TAILLE DU MARCHÉ DE LA FACTURATION AUX ÉTATS-UNIS PRÉVISIONS, PAR UTILISATEUR FINAL, 2019-2032 (MILLIARDS USD)
    12. TABLEAU 9. ESTIMATIONS ET ESTIMATIONS DE LA TAILLE DU MARCHÉ DE LA FACTURATION AUX ÉTATS-UNIS PRÉVISIONS, PAR COMPOSANTE, 2019-2032 (MILLIARDS USD)
    13. TABLEAU 10. ESTIMATIONS ET ESTIMATIONS DE LA TAILLE DU MARCHÉ DE LA FACTURATION AUX ÉTATS-UNIS PRÉVISIONS, PAR INDUSTRIE VERTICALE, 2019-2032 (MILLIARDS USD)
    14. TABLEAU 11. ESTIMATIONS ET ESTIMATIONS DE LA TAILLE DU MARCHÉ DE LA FACTURATION AUX ÉTATS-UNIS PRÉVISIONS, PAR RÉGION, 2019-2032 (MILLIARDS USD)
    15. TABLEAU 12. ESTIMATIONS ET ESTIMATIONS DE LA TAILLE DU MARCHÉ DE LA FACTURATION AU CANADA E PRÉVISIONS, PAR MODE DE DÉPLOIEMENT, 2019-2032 (MILLIARDS USD)
    16. TABLEAU 13. ESTIMATIONS ET ESTIMATIONS DE LA TAILLE DU MARCHÉ DE LA FACTURATION AU CANADA E PRÉVISIONS, PAR UTILISATEUR FINAL, 2019-2032 (MILLIARDS USD)
    17. TABLEAU 14. ESTIMATIONS ET ESTIMATIONS DE LA TAILLE DU MARCHÉ DE LA FACTURATION AU CANADA E PRÉVISIONS, PAR COMPOSANTE, 2019-2032 (MILLIARDS USD)
    18. TABLEAU 15. ESTIMATIONS ET ESTIMATIONS DE LA TAILLE DU MARCHÉ DE LA FACTURATION AU CANADA E PRÉVISIONS, PAR INDUSTRIE VERTICALE, 2019-2032 (MILLIARDS USD)
    19. TABLEAU 16. ESTIMATIONS DE LA TAILLE ET DU MARCHÉ DE LA FACTURATION AU CANADA E PRÉVISIONS, PAR RÉGION, 2019-2032 (MILLIARDS USD)
    20. TABLEAU 17. ESTIMATIONS ET ESTIMATIONS DE LA TAILLE DU MARCHÉ DE LA FACTURATION EN EUROPE E PRÉVISIONS, PAR MODE DE DÉPLOIEMENT, 2019-2032 (MILLIARDS USD)
    21. TABLEAU 18. ESTIMATIONS ET ESTIMATIONS DE LA TAILLE DU MARCHÉ DE LA FACTURATION EN EUROPE E PRÉVISIONS, PAR UTILISATEUR FINAL, 2019-2032 (MILLIARDS USD)
    22. TABLEAU 19. ESTIMATIONS ET ESTIMATIONS DE LA TAILLE DU MARCHÉ DE LA FACTURATION EN EUROPE E PRÉVISIONS, PAR COMPOSANTE, 2019-2032 (MILLIARDS USD)
    23. TABLEAU 20. ESTIMATIONS ET ESTIMATIONS DE LA TAILLE DU MARCHÉ DE LA FACTURATION EN EUROPE E PRÉVISIONS, PAR INDUSTRIE VERTICALE, 2019-2032 (MILLIARDS USD)
    24. TABLEAU 21. ESTIMATIONS ET ESTIMATIONS DE LA TAILLE DU MARCHÉ DE LA FACTURATION EN EUROPE E PRÉVISIONS, PAR RÉGION, 2019-2032 (MILLIARDS USD)
    25. TABLEAU 22. ALLEMAGNE E ESTIMATIONS DE LA TAILLE DU MARCHÉ DE FACTURATION ET amp; PRÉVISIONS, PAR MODE DE DÉPLOIEMENT, 2019-2032 (MILLIARDS USD)
    26. TABLEAU 23. ALLEMAGNE E ESTIMATIONS DE LA TAILLE DU MARCHÉ DE LA FACTURATION ET amp; PRÉVISIONS, PAR UTILISATEUR FINAL, 2019-2032 (MILLIARDS USD)
    27. TABLEAU 24. ALLEMAGNE E ESTIMATIONS DE LA TAILLE DU MARCHÉ DE FACTURATION ET amp; PRÉVISIONS, PAR COMPOSANTE, 2019-2032 (MILLIARDS USD)
    28. TABLEAU 25. ALLEMAGNE E ESTIMATIONS DE LA TAILLE DU MARCHÉ DE LA FACTURATION & PRÉVISIONS, PAR INDUSTRIE VERTICALE, 2019-2032 (MILLIARDS USD)
    29. TABLEAU 26. ESTIMATIONS ET ESTIMATIONS DE LA TAILLE DU MARCHÉ DE LA FACTURATION E EN ALLEMAGNE PRÉVISIONS, PAR RÉGIONAL, 2019-2032 (MILLIARDS USD)
    30. TABLEAU 27. ESTIMATIONS ET ESTIMATIONS DE LA TAILLE DU MARCHÉ DE LA FACTURATION E AU ROYAUME-UNI PRÉVISIONS, PAR MODE DE DÉPLOIEMENT, 2019-2032 (MILLIARDS USD)
    31. TABLEAU 28. ESTIMATIONS ET ESTIMATIONS DE LA TAILLE DU MARCHÉ DE LA FACTURATION E AU ROYAUME-UNI PRÉVISIONS, PAR UTILISATEUR FINAL, 2019-2032 (MILLIARDS USD)
    32. TABLEAU 29. ESTIMATIONS ET ESTIMATIONS DE LA TAILLE DU MARCHÉ DE LA FACTURATION E AU ROYAUME-UNI PRÉVISIONS, PAR COMPOSANTE, 2019-2032 (MILLIARDS USD)
    33. TABLEAU 30. ESTIMATIONS ET ESTIMATIONS DE LA TAILLE DU MARCHÉ DE LA FACTURATION E AU ROYAUME-UNI PRÉVISIONS, PAR INDUSTRIE VERTICALE, 2019-2032 (MILLIARDS USD)
    34. TABLEAU 31. ESTIMATIONS ET ESTIMATIONS DE LA TAILLE DU MARCHÉ DE LA FACTURATION E AU ROYAUME-UNI PRÉVISIONS, PAR RÉGION, 2019-2032 (MILLIARDS USD)
    35. TABLEAU 32. FRANCE E FACTURATION TAILLE DU MARCHÉ ESTIMATIONS & PRÉVISIONS, PAR MODE DE DÉPLOIEMENT, 2019-2032 (MILLIARDS USD)
    36. TABLEAU 33. FRANCE E FACTURATION TAILLE DU MARCHÉ ESTIMATIONS & PRÉVISIONS, PAR UTILISATEUR FINAL, 2019-2032 (MILLIARDS USD)
    37. TABLEAU 34. FRANCE E FACTURATION TAILLE DU MARCHÉ ESTIMATIONS & PRÉVISIONS, PAR COMPOSANTE, 2019-2032 (MILLIARDS USD)
    38. TABLEAU 35. ESTIMATIONS DE LA TAILLE DU MARCHÉ DE LA FACTURATION EN FRANCE E & PRÉVISIONS, PAR INDUSTRIE VERTICALE, 2019-2032 (MILLIARDS USD)
    39. TABLEAU 36. FRANCE E FACTURATION TAILLE DU MARCHÉ ESTIMATIONS & PRÉVISIONS, PAR RÉGION, 2019-2032 (MILLIARDS USD)
    40. TABLEAU 37. ESTIMATIONS ET ESTIMATIONS DE LA TAILLE DU MARCHÉ DE LA FACTURATION EN RUSSIE E ; PRÉVISIONS, PAR MODE DE DÉPLOIEMENT, 2019-2032 (MILLIARDS USD)
    41. TABLEAU 38. ESTIMATIONS ET ESTIMATIONS DE LA TAILLE DU MARCHÉ DE LA FACTURATION EN RUSSIE E PRÉVISIONS, PAR UTILISATEUR FINAL, 2019-2032 (MILLIARDS USD)
    42. TABLEAU 39. ESTIMATIONS ET ESTIMATIONS DE LA TAILLE DU MARCHÉ DE LA FACTURATION EN RUSSIE E ; PRÉVISIONS, PAR COMPOSANTE, 2019-2032 (MILLIARDS USD)
    43. TABLEAU 40. ESTIMATIONS ET ESTIMATIONS DE LA TAILLE DU MARCHÉ DE LA FACTURATION EN RUSSIE E ; PRÉVISIONS, PAR INDUSTRIE VERTICALE, 2019-2032 (MILLIARDS USD)
    44. TABLEAU 41. ESTIMATIONS ET ESTIMATIONS DE LA TAILLE DU MARCHÉ DE LA FACTURATION EN RUSSIE E ; PRÉVISIONS, PAR RÉGION, 2019-2032 (MILLIARDS USD)
    45. TABLEAU 42. ITALIE E ​​ESTIMATIONS DE LA TAILLE DU MARCHÉ DE LA FACTURATION & PRÉVISIONS, PAR MODE DE DÉPLOIEMENT, 2019-2032 (MILLIARDS USD)
    46. TABLEAU 43. ITALIE E ​​ESTIMATIONS DE LA TAILLE DU MARCHÉ DE LA FACTURATION & PRÉVISIONS, PAR UTILISATEUR FINAL, 2019-2032 (MILLIARDS USD)
    47. TABLEAU 44. ITALIE E ​​ESTIMATIONS DE LA TAILLE DU MARCHÉ DE LA FACTURATION & PRÉVISIONS, PAR COMPOSANTE, 2019-2032 (MILLIARDS USD)
    48. TABLEAU 45. ITALIE E, ESTIMATIONS DE LA TAILLE DU MARCHÉ DE LA FACTURATION & PRÉVISIONS, PAR INDUSTRIE VERTICALE, 2019-2032 (MILLIARDS USD)
    49. TABLEAU 46. ESTIMATIONS ET ESTIMATIONS DE LA TAILLE DU MARCHÉ DE LA FACTURATION EN ITALIE E PRÉVISIONS, PAR RÉGION, 2019-2032 (MILLIARDS USD)
    50. TABLEAU 47. ESPAGNE E FACTURATION ESTIMATIONS DE LA TAILLE DU MARCHÉ & PRÉVISIONS, PAR MODE DE DÉPLOIEMENT, 2019-2032 (MILLIARDS USD)
    51. TABLEAU 48. ESPAGNE E ESTIMATIONS DE LA TAILLE DU MARCHÉ DE LA FACTURATION & PRÉVISIONS, PAR UTILISATEUR FINAL, 2019-2032 (MILLIARDS USD)
    52. TABLEAU 49. ESPAGNE E ESTIMATIONS DE LA TAILLE DU MARCHÉ DE FACTURATION ET amp; PRÉVISIONS, PAR COMPOSANTE, 2019-2032 (MILLIARDS USD)
    53. TABLEAU 50. ESPAGNE E ESTIMATIONS DE LA TAILLE DU MARCHÉ DE LA FACTURATION & PRÉVISIONS, PAR INDUSTRIE VERTICALE, 2019-2032 (MILLIARDS USD)
    54. TABLEAU 51. ESPAGNE E ESTIMATIONS DE LA TAILLE DU MARCHÉ DE LA FACTURATION & PRÉVISIONS, PAR RÉGION, 2019-2032 (MILLIARDS USD)
    55. TABLEAU 52. RESTE DE L'EUROPE E ESTIMATIONS DE LA TAILLE DU MARCHÉ DE LA FACTURATION & PRÉVISIONS, PAR MODE DE DÉPLOIEMENT, 2019-2032 (MILLIARDS USD)
    56. TABLEAU 53. RESTE DE L'EUROPE E ESTIMATIONS DE LA TAILLE DU MARCHÉ DE LA FACTURATION& PRÉVISIONS, PAR UTILISATEUR FINAL, 2019-2032 (MILLIARDS USD)
    57. TABLEAU 54. RESTE DE L'EUROPE E ESTIMATIONS DE LA TAILLE DU MARCHÉ DE LA FACTURATION & PRÉVISIONS, PAR COMPOSANTE, 2019-2032 (MILLIARDS USD)
    58. TABLEAU 55. RESTE DE L'EUROPE E ESTIMATIONS DE LA TAILLE DU MARCHÉ DE LA FACTURATION & PRÉVISIONS, PAR INDUSTRIE VERTICALE, 2019-2032 (MILLIARDS USD)
    59. TABLEAU 56. RESTE DE L'EUROPE E ESTIMATIONS DE LA TAILLE DU MARCHÉ DE LA FACTURATION & PRÉVISIONS, PAR RÉGIONAL, 2019-2032 (MILLIARDS USD)
    60. TABLEAU 57. ESTIMATIONS ET ESTIMATIONS DE LA TAILLE DU MARCHÉ DE LA FACTURATION APAC E PRÉVISIONS, PAR MODE DE DÉPLOIEMENT, 2019-2032 (MILLIARDS USD)
    61. TABLEAU 58. ESTIMATIONS ET ESTIMATIONS DE LA TAILLE DU MARCHÉ DE LA FACTURATION APAC E PRÉVISIONS, PAR UTILISATEUR FINAL, 2019-2032 (MILLIARDS USD)
    62. TABLEAU 59. ESTIMATIONS ET ESTIMATIONS DE LA TAILLE DU MARCHÉ DE LA FACTURATION APAC E PRÉVISIONS, PAR COMPOSANTE, 2019-2032 (MILLIARDS USD)
    63. TABLEAU 60. ESTIMATIONS ET ESTIMATIONS DE LA TAILLE DU MARCHÉ DE LA FACTURATION APAC E PRÉVISIONS, PAR INDUSTRIE VERTICALE, 2019-2032 (MILLIARDS USD)
    64. TABLEAU 61. ESTIMATIONS ET ESTIMATIONS DE LA TAILLE DU MARCHÉ DE LA FACTURATION APAC E PRÉVISIONS, PAR RÉGION, 2019-2032 (MILLIARDS USD)
    65. TABLEAU 62. ESTIMATIONS ET ESTIMATIONS DE LA TAILLE DU MARCHÉ DE LA FACTURATION EN CHINE E PRÉVISIONS, PAR MODE DE DÉPLOIEMENT, 2019-2032 (MILLIARDS USD)
    66. TABLEAU 63. ESTIMATIONS ET ESTIMATIONS DE LA TAILLE DU MARCHÉ DE LA FACTURATION EN CHINE E PRÉVISIONS, PAR UTILISATEUR FINAL, 2019-2032 (MILLIARDS USD)
    67. TABLEAU 64. ESTIMATIONS ET ESTIMATIONS DE LA TAILLE DU MARCHÉ DE LA FACTURATION EN CHINE E PRÉVISIONS, PAR COMPOSANTE, 2019-2032 (MILLIARDS USD)
    68. TABLEAU 65. ESTIMATIONS ET ESTIMATIONS DE LA TAILLE DU MARCHÉ DE LA FACTURATION EN CHINE E PRÉVISIONS, PAR INDUSTRIE VERTICALE, 2019-2032 (MILLIARDS USD)
    69. TABLEAU 66. ESTIMATIONS ET ESTIMATIONS DE LA TAILLE DU MARCHÉ DE LA FACTURATION EN CHINE E PRÉVISIONS, PAR RÉGION, 2019-2032 (MILLIARDS USD)
    70. TABLEAU 67. ESTIMATIONS ET ESTIMATIONS DE LA TAILLE DU MARCHÉ DE LA FACTURATION EN INDE E PRÉVISIONS, PAR MODE DE DÉPLOIEMENT, 2019-2032 (MILLIARDS USD)
    71. TABLEAU 68. INDE ET ESTIMATIONS DE LA TAILLE DU MARCHÉ DE LA FACTURATION & PRÉVISIONS, PAR UTILISATEUR FINAL, 2019-2032 (MILLIARDS USD)
    72. TABLEAU 69. ESTIMATIONS ET ESTIMATIONS DE LA TAILLE DU MARCHÉ DE LA FACTURATION EN INDE E PRÉVISIONS, PAR COMPOSANTE, 2019-2032 (MILLIARDS USD)
    73. TABLEAU 70. ESTIMATIONS ET ESTIMATIONS DE LA TAILLE DU MARCHÉ DE LA FACTURATION EN INDE E PRÉVISIONS, PAR INDUSTRIE VERTICALE, 2019-2032 (MILLIARDS USD)
    74. TABLEAU 71. ESTIMATIONS ET ESTIMATIONS DE LA TAILLE DU MARCHÉ DE LA FACTURATION EN INDE E PRÉVISIONS, PAR RÉGION, 2019-2032 (MILLIARDS USD)
    75. TABLEAU 72. JAPON E FACTURATION TAILLE DU MARCHÉ ESTIMATIONS & PRÉVISIONS, PAR MODE DE DÉPLOIEMENT, 2019-2032 (MILLIARDS USD)
    76. TABLEAU 73. JAPON E, ESTIMATIONS DE LA TAILLE DU MARCHÉ DE LA FACTURATION & PRÉVISIONS, PAR UTILISATEUR FINAL, 2019-2032 (MILLIARDS USD)
    77. TABLEAU 74. ESTIMATIONS ET ESTIMATIONS DE LA TAILLE DU MARCHÉ DE LA FACTURATION AU JAPON E PRÉVISIONS, PAR COMPOSANTE, 2019-2032 (MILLIARDS USD)
    78. TABLEAU 75. ESTIMATIONS ET ESTIMATIONS DE LA TAILLE DU MARCHÉ DE LA FACTURATION AU JAPON E PRÉVISIONS, PAR INDUSTRIE VERTICALE, 2019-2032 (MILLIARDS USD)
    79. TABLEAU 76. JAPON E, ESTIMATIONS DE LA TAILLE ET DU MARCHÉ DE LA FACTURATION E. PRÉVISIONS, PAR RÉGION, 2019-2032 (MILLIARDS USD)
    80. TABLEAU 77. CORÉE DU SUD E FACTURATION ESTIMATIONS DE LA TAILLE DU MARCHÉ & PRÉVISIONS, PAR MODE DE DÉPLOIEMENT, 2019-2032 (MILLIARDS USD)
    81. TABLEAU 78. CORÉE DU SUD E FACTURATION ESTIMATIONS DE LA TAILLE DU MARCHÉ & PRÉVISIONS, PAR UTILISATEUR FINAL, 2019-2032 (MILLIARDS USD)
    82. TABLEAU 79. CORÉE DU SUD E, ESTIMATIONS DE LA TAILLE DU MARCHÉ DE LA FACTURATION et amp; PRÉVISIONS, PAR COMPOSANTE, 2019-2032 (MILLIARDS USD)
    83. TABLEAU 80. CORÉE DU SUD E FACTURATION ESTIMATIONS DE LA TAILLE DU MARCHÉ & PRÉVISIONS, PAR INDUSTRIE VERTICALE, 2019-2032 (MILLIARDS USD)
    84. TABLEAU 81. CORÉE DU SUD E-FACTURATION, ESTIMATIONS DE LA TAILLE DU MARCHÉ & PRÉVISIONS, PAR RÉGION, 2019-2032 (MILLIARDS USD)
    85. TABLEAU 82. MALAISIE E ESTIMATIONS DE LA TAILLE DU MARCHÉ DE LA FACTURATION & PRÉVISIONS, PAR MODE DE DÉPLOIEMENT, 2019-2032 (MILLIARDS USD)
    86. TABLEAU 83. MALAISIE E ESTIMATIONS DE LA TAILLE DU MARCHÉ DE LA FACTURATION & PRÉVISIONS, PAR UTILISATEUR FINAL, 2019-2032 (MILLIARDS USD)
    87. TABLEAU 84. MALAISIE E ESTIMATIONS DE LA TAILLE DU MARCHÉ DE LA FACTURATION & PRÉVISIONS, PAR COMPOSANTE, 2019-2032 (MILLIARDS USD)
    88. TABLEAU 85. MALAISIE E ESTIMATIONS DE LA TAILLE DU MARCHÉ DE LA FACTURATION & PRÉVISIONS, PAR INDUSTRIE VERTICALE, 2019-2032 (MILLIARDS USD)
    89. TABLEAU 86. MALAISIE E ESTIMATIONS DE LA TAILLE DU MARCHÉ DE LA FACTURATION & PRÉVISIONS, PAR RÉGIONAL, 2019-2032 (MILLIARDS USD)
    90. TABLEAU 87. THAÏLANDE E FACTURATION ESTIMATIONS DE LA TAILLE DU MARCHÉ & PRÉVISIONS, PAR MODE DE DÉPLOIEMENT, 2019-2032 (MILLIARDS USD)
    91. TABLEAU 88. THAÏLANDE E ESTIMATIONS DE LA TAILLE DU MARCHÉ DE LA FACTURATION & PRÉVISIONS, PAR UTILISATEUR FINAL, 2019-2032 (MILLIARDS USD)
    92. TABLEAU 89. THAÏLANDE E ESTIMATIONS DE LA TAILLE DU MARCHÉ DE LA FACTURATION & PRÉVISIONS, PAR COMPOSANTE, 2019-2032 (MILLIARDS USD)
    93. TABLEAU 90. THAÏLANDE E : ESTIMATIONS DE LA TAILLE DU MARCHÉ DE LA FACTURATION & PRÉVISIONS, PAR INDUSTRIE VERTICALE, 2019-2032 (MILLIARDS USD)
    94. TABLEAU 91. ESTIMATIONS ET ESTIMATIONS DE LA TAILLE DU MARCHÉ DE LA FACTURATION E EN THAÏLANDE PRÉVISIONS, PAR RÉGIONAL, 2019-2032 (MILLIARDS USD)
    95. TABLEAU 92. INDONÉSIE E ESTIMATIONS DE LA TAILLE DU MARCHÉ DE LA FACTURATION & PRÉVISIONS, PAR MODE DE DÉPLOIEMENT, 2019-2032 (MILLIARDS USD)
    96. TABLEAU 93. INDONÉSIE E ESTIMATIONS DE LA TAILLE DU MARCHÉ DE LA FACTURATION & PRÉVISIONS, PAR UTILISATEUR FINAL, 2019-2032 (MILLIARDS USD)
    97. TABLEAU 94. INDONÉSIE E ESTIMATIONS DE LA TAILLE DU MARCHÉ DE LA FACTURATION & PRÉVISIONS, PAR COMPOSANTE, 2019-2032 (MILLIARDS USD)
    98. TABLEAU 95. INDONÉSIE E ESTIMATIONS DE LA TAILLE DU MARCHÉ DE LA FACTURATION & PRÉVISIONS, PAR INDUSTRIE VERTICALE, 2019-2032 (MILLIARDS USD)
    99. TABLEAU 96. INDONÉSIE E ESTIMATIONS DE LA TAILLE DU MARCHÉ DE LA FACTURATION & PRÉVISIONS, PAR RÉGION, 2019-2032 (MILLIARDS USD)
    100. TABLEAU 97. RESTE DE L'APAC E, ESTIMATIONS DE LA TAILLE DU MARCHÉ DE LA FACTURATION et amp; PRÉVISIONS, PAR MODE DE DÉPLOIEMENT, 2019-2032 (MILLIARDS USD)
    101. TABLEAU 98. RESTE DE L'APAC E, ESTIMATIONS DE LA TAILLE DU MARCHÉ DE LA FACTURATION et amp; PRÉVISIONS, PAR UTILISATEUR FINAL, 2019-2032 (MILLIARDS USD)
    102. TABLEAU 99. RESTE DE L'APAC E, ESTIMATIONS DE LA TAILLE DU MARCHÉ DE LA FACTURATION et amp; PRÉVISIONS, PAR COMPOSANTE, 2019-2032 (MILLIARDS USD)
    103. TABLEAU 100. RESTE DE L'APAC E, ESTIMATIONS DE LA TAILLE DU MARCHÉ DE LA FACTURATION et amp; PRÉVISIONS, PAR INDUSTRIE VERTICALE, 2019-2032 (MILLIARDS USD)
    104. TABLEAU 101. RESTE DE L'APAC E, ESTIMATIONS DE LA TAILLE DU MARCHÉ DE LA FACTURATION & PRÉVISIONS, PAR RÉGION, 2019-2032 (MILLIARDS USD)
    105. TABLEAU 102. AMÉRIQUE DU SUD E ESTIMATIONS DE LA TAILLE DU MARCHÉ DE LA FACTURATION & PRÉVISIONS, PAR MODE DE DÉPLOIEMENT, 2019-2032 (MILLIARDS USD)
    106. TABLEAU 103. AMÉRIQUE DU SUD E ESTIMATIONS DE LA TAILLE DU MARCHÉ DE LA FACTURATION ET amp; PRÉVISIONS, PAR UTILISATEUR FINAL, 2019-2032 (MILLIARDS USD)
    107. TABLEAU 104. AMÉRIQUE DU SUD ET ESTIMATIONS DE LA TAILLE DU MARCHÉ DE LA FACTURATION ET AMÉRIQUE DU SUD PRÉVISIONS, PAR COMPOSANTE, 2019-2032 (MILLIARDS USD)
    108. TABLEAU 105. AMÉRIQUE DU SUD ET ESTIMATIONS DE LA TAILLE DU MARCHÉ DE LA FACTURATION ET AMÉRIQUE DU SUD PRÉVISIONS, PAR INDUSTRIE VERTICALE, 2019-2032 (MILLIARDS USD)
    109. TABLEAU 106. ESTIMATIONS DE LA TAILLE DU MARCHÉ DE LA FACTURATION EN AMÉRIQUE DU SUD et amp; PRÉVISIONS, PAR RÉGION, 2019-2032 (MILLIARDS USD)
    110. TABLEAU 107. BRÉSIL E FACTURATION ESTIMATIONS DE LA TAILLE DU MARCHÉ & PRÉVISIONS, PAR MODE DE DÉPLOIEMENT, 2019-2032 (MILLIARDS USD)
    111. TABLEAU 108. ESTIMATIONS ET ESTIMATIONS DE LA TAILLE DU MARCHÉ DE LA FACTURATION AU BRÉSIL E PRÉVISIONS, PAR UTILISATEUR FINAL, 2019-2032 (MILLIARDS USD)
    112. TABLEAU 109. ESTIMATIONS ET ESTIMATIONS DE LA TAILLE DU MARCHÉ DE LA FACTURATION AU BRÉSIL E PRÉVISIONS, PAR COMPOSANTE, 2019-2032 (MILLIARDS USD)
    113. TABLEAU 110. ESTIMATIONS ET ESTIMATIONS DE LA TAILLE DU MARCHÉ DE LA FACTURATION AU BRÉSIL E PRÉVISIONS, PAR INDUSTRIE VERTICALE, 2019-2032 (MILLIARDS USD)
    114. TABLEAU 111. ESTIMATIONS ET ESTIMATIONS DE LA TAILLE DU MARCHÉ DE LA FACTURATION E AU BRÉSIL PRÉVISIONS, PAR RÉGION, 2019-2032 (MILLIARDS USD)
    115. TABLEAU 112. ESTIMATIONS ET ESTIMATIONS DE LA TAILLE DU MARCHÉ DE LA FACTURATION AU MEXIQUE E PRÉVISIONS, PAR MODE DE DÉPLOIEMENT, 2019-2032 (MILLIARDS USD)
    116. TABLEAU 113. ESTIMATIONS ET ESTIMATIONS DE LA TAILLE DU MARCHÉ DE LA FACTURATION AU MEXIQUE E PRÉVISIONS, PAR UTILISATEUR FINAL, 2019-2032 (MILLIARDS USD)
    117. TABLEAU 114. ESTIMATIONS ET ESTIMATIONS DE LA TAILLE DU MARCHÉ DE LA FACTURATION AU MEXIQUE E PRÉVISIONS, PAR COMPOSANTE, 2019-2032 (MILLIARDS USD)
    118. TABLEAU 115. ESTIMATIONS ET ESTIMATIONS DE LA TAILLE DU MARCHÉ DE LA FACTURATION AU MEXIQUE E PRÉVISIONS, PAR INDUSTRIE VERTICALE, 2019-2032 (MILLIARDS USD)
    119. TABLEAU 116. ESTIMATIONS ET ESTIMATIONS DE LA TAILLE DU MARCHÉ DE LA FACTURATION AU MEXIQUE E PRÉVISIONS, PAR RÉGION, 2019-2032 (MILLIARDS USD)
    120. TABLEAU 117. ESTIMATIONS ET ESTIMATIONS DE LA TAILLE DU MARCHÉ DE LA FACTURATION EN ARGENTINE E & PRÉVISIONS, PAR MODE DE DÉPLOIEMENT, 2019-2032 (MILLIARDS USD)
    121. TABLEAU 118. ESTIMATIONS ET ESTIMATIONS DE LA TAILLE DU MARCHÉ DE LA FACTURATION EN ARGENTINE E PRÉVISIONS, PAR UTILISATEUR FINAL, 2019-2032 (MILLIARDS USD)
    122. TABLEAU 119. ESTIMATIONS ET ESTIMATIONS DE LA TAILLE DU MARCHÉ DE LA FACTURATION EN ARGENTINE E PRÉVISIONS, PAR COMPOSANTE, 2019-2032 (MILLIARDS USD)
    123. TABLEAU 120. ESTIMATIONS ET ESTIMATIONS DE LA TAILLE DU MARCHÉ DE LA FACTURATION EN ARGENTINE E & PRÉVISIONS, PAR INDUSTRIE VERTICALE, 2019-2032 (MILLIARDS USD)
    124. TABLEAU 121. ESTIMATIONS ET ESTIMATIONS DE LA TAILLE DU MARCHÉ DE LA FACTURATION EN ARGENTINE E PRÉVISIONS, PAR RÉGIONAL, 2019-2032 (MILLIARDS USD)
    125. TABLEAU 122. RESTE DE L'AMÉRIQUE DU SUD E ESTIMATIONS DE LA TAILLE DU MARCHÉ DE LA FACTURATION & PRÉVISIONS, PAR MODE DE DÉPLOIEMENT, 2019-2032 (MILLIARDS USD)
    126. TABLEAU 123. RESTE DE L'AMÉRIQUE DU SUD E ESTIMATIONS DE LA TAILLE DU MARCHÉ DE LA FACTURATION & PRÉVISIONS, PAR UTILISATEUR FINAL, 2019-2032 (MILLIARDS USD)
    127. TABLEAU 124. RESTE DE L'AMÉRIQUE DU SUD E ESTIMATIONS ET ESTIMATIONS DE LA TAILLE DU MARCHÉ DE LA FACTURATION & PRÉVISIONS, PAR COMPOSANTE, 2019-2032 (MILLIARDS USD)
    128. TABLEAU 125. RESTE DE L'AMÉRIQUE DU SUD E ESTIMATIONS DE LA TAILLE DU MARCHÉ DE LA FACTURATION & PRÉVISIONS, PAR INDUSTRIE VERTICALE, 2019-2032 (MILLIARDS USD)
    129. TABLEAU 126. RESTE DE L'AMÉRIQUE DU SUD ET ESTIMATIONS DE LA TAILLE DU MARCHÉ DE LA FACTURATION et amp; PRÉVISIONS, PAR RÉGIONAL, 2019-2032 (MILLIARDS USD)
    130. TABLEAU 127. ESTIMATIONS ET ESTIMATIONS DE LA TAILLE DU MARCHÉ DE FACTURATION DES MEA E & PRÉVISIONS, PAR MODE DE DÉPLOIEMENT, 2019-2032 (MILLIARDS USD)
    131. TABLEAU 128. ESTIMATIONS DE LA TAILLE DU MARCHÉ DE FACTURATION DES MEA E & PRÉVISIONS, PAR UTILISATEUR FINAL, 2019-2032 (MILLIARDS USD)
    132. TABLEAU 129. ESTIMATIONS ET ESTIMATIONS DE LA TAILLE DU MARCHÉ DE FACTURATION DU MEA E PRÉVISIONS, PAR COMPOSANTE, 2019-2032 (MILLIARDS USD)
    133. TABLEAU 130. ESTIMATIONS DE LA TAILLE DU MARCHÉ DE FACTURATION DES MEA E & PRÉVISIONS, PAR INDUSTRIE VERTICALE, 2019-2032 (MILLIARDS USD)
    134. TABLEAU 131. ESTIMATIONS ET ESTIMATIONS DE LA TAILLE DU MARCHÉ DE FACTURATION DES MEA E & PRÉVISIONS, PAR RÉGIONAL, 2019-2032 (MILLIARDS USD)
    135. TABLEAU 132. PAYS DU CCG E ESTIMATIONS DE LA TAILLE DU MARCHÉ DE FACTURATION et amp; PRÉVISIONS, PAR MODE DE DÉPLOIEMENT, 2019-2032 (MILLIARDS USD)
    136. TABLEAU 133. PAYS DU CCG E ESTIMATIONS DE LA TAILLE DU MARCHÉ DE LA FACTURATION & PRÉVISIONS, PAR UTILISATEUR FINAL, 2019-2032 (MILLIARDS USD)
    137. TABLEAU 134. PAYS DU CCG E ESTIMATIONS DE LA TAILLE DU MARCHÉ DE LA FACTURATION & PRÉVISIONS, PAR COMPOSANTE, 2019-2032 (MILLIARDS USD)
    138. TABLEAU 135. PAYS DU CCG E ESTIMATIONS DE LA TAILLE DU MARCHÉ DE LA FACTURATION & PRÉVISIONS, PAR INDUSTRIE VERTICALE, 2019-2032 (MILLIARDS USD)
    139. TABLEAU 136. PAYS DU CCG E ESTIMATIONS DE LA TAILLE DU MARCHÉ DE LA FACTURATION & PRÉVISIONS, PAR RÉGION, 2019-2032 (MILLIARDS USD)
    140. TABLEAU 137. AFRIQUE DU SUD E ESTIMATIONS DE LA TAILLE DU MARCHÉ DE LA FACTURATION & PRÉVISIONS, PAR MODE DE DÉPLOIEMENT, 2019-2032 (MILLIARDS USD)
    141. TABLEAU 138. AFRIQUE DU SUD E ESTIMATIONS DE LA TAILLE DU MARCHÉ DE LA FACTURATION & PRÉVISIONS, PAR UTILISATEUR FINAL, 2019-2032 (MILLIARDS USD)
    142. TABLEAU 139. AFRIQUE DU SUD E ESTIMATIONS DE LA TAILLE DU MARCHÉ DE LA FACTURATION & PRÉVISIONS, PAR COMPOSANTE, 2019-2032 (MILLIARDS USD)
    143. TABLEAU 140. AFRIQUE DU SUD E ESTIMATIONS DE LA TAILLE DU MARCHÉ DE LA FACTURATION & PRÉVISIONS, PAR INDUSTRIE VERTICALE, 2019-2032 (MILLIARDS USD)
    144. TABLEAU 141. AFRIQUE DU SUD E ESTIMATIONS DE LA TAILLE ET DU MARCHÉ DE LA FACTURATION EN AFRIQUE DU SUD PRÉVISIONS, PAR RÉGIONAL, 2019-2032 (MILLIARDS USD)
    145. TABLEAU 142. RESTE DES MES E FACTURATION ESTIMATIONS DE LA TAILLE DU MARCHÉ & PRÉVISIONS, PAR MODE DE DÉPLOIEMENT, 2019-2032 (MILLIARDS USD)
    146. TABLEAU 143. RESTE DU MEA E FACTURATION ESTIMATIONS DE LA TAILLE DU MARCHÉ & PRÉVISIONS, PAR UTILISATEUR FINAL, 2019-2032 (MILLIARDS USD)
    147. TABLEAU 144. RESTE DU MEA E FACTURATION ESTIMATIONS DE LA TAILLE DU MARCHÉ & PRÉVISIONS, PAR COMPOSANTE, 2019-2032 (MILLIARDS USD)
    148. TABLEAU 145. RESTE DU MES E FACTURATION ESTIMATIONS DE LA TAILLE DU MARCHÉ & PRÉVISIONS, PAR INDUSTRIE VERTICALE, 2019-2032 (MILLIARDS USD)
    149. TABLEAU 146. RESTE DE LA FACTURATION DES MES E, ESTIMATIONS DE LA TAILLE DU MARCHÉ & PRÉVISIONS, PAR RÉGIONAL, 2019-2032 (MILLIARDS USD)
    150. TABLEAU 147. LANCEMENT DE PRODUIT/DÉVELOPPEMENT DE PRODUIT/APPROBATION
    151. TABLEAU 148. ACQUISITION/PARTENARIAT
  14. LISTE DES FIGURES
  15. FIGURE 1 SYNOPSIS DU MARCHÉ
  16. FIGURE 2 ANALYSE DU MARCHÉ DE LA FACTURATION EN AMÉRIQUE DU NORD
  17. FIGURE 3 ANALYSE DU MARCHÉ DE LA FACTURATION AUX ÉTATS-UNIS PAR MODE DE DÉPLOIEMENT
  18. FIGURE 4 ANALYSE DU MARCHÉ DE LA FACTURATION US E PAR UTILISATEUR FINAL
  19. FIGURE 5 ANALYSE DU MARCHÉ DE LA FACTURATION US E PAR COMPOSANTE
  20. FIGURE 6 ANALYSE DU MARCHÉ DE LA FACTURATION US E PAR INDUSTRIE VERTICALE
  21. FIGURE 7 ANALYSE DU MARCHÉ DE LA FACTURATION US E PAR RÉGIONAL
  22. FIGURE 8 ANALYSE DU MARCHÉ DE LA FACTURATION E AU CANADA PAR MODE DE DÉPLOIEMENT
  23. FIGURE 9 ANALYSE DU MARCHÉ DE LA FACTURATION E AU CANADA PAR UTILISATEUR FINAL
  24. FIGURE 10 ANALYSE DU MARCHÉ DE LA FACTURATION E AU CANADA PAR COMPOSANTE
  25. FIGURE 11 CANADA E ANALYSE DU MARCHÉ DE LA FACTURATION PAR INDUSTRIE VERTIQUE
  26. FIGURE 12 ANALYSE DU MARCHÉ DE LA FACTURATION E AU CANADA PAR RÉGION
  27. FIGURE 13 ANALYSE DU MARCHÉ DE LA FACTURATION E EN EUROPE
  28. FIGURE 14 ANALYSE DU MARCHÉ DE LA FACTURATION E EN ALLEMAGNE PAR MODE DE DÉPLOIEMENT
  29. FIGURE 15 ALLEMAGNE E ANALYSE DU MARCHÉ DE LA FACTURATION PAR UTILISATEUR FINAL
  30. FIGURE 16 ANALYSE DU MARCHÉ DE LA FACTURATION E EN ALLEMAGNE PAR COMPOSANTE
  31. FIGURE 17 ANALYSE DU MARCHÉ DE LA FACTURATION E EN ALLEMAGNE PAR INDUSTRIE VERTICALE
  32. FIGURE 18 ANALYSE DU MARCHÉ DE LA FACTURATION E EN ALLEMAGNE PAR RÉGION
  33. FIGURE 19 ANALYSE DU MARCHÉ DE LA FACTURATION E AU ROYAUME-UNI PAR MODE DE DÉPLOIEMENT
  34. FIGURE 20 ANALYSE DU MARCHÉ DE LA FACTURATION E AU ROYAUME-UNI PAR UTILISATEUR FINAL
  35. FIGURE 21 ANALYSE DU MARCHÉ DE LA FACTURATION E AU ROYAUME-UNI PAR COMPOSANTE
  36. FIGURE 22 ANALYSE DU MARCHÉ DE LA FACTURATION E AU ROYAUME-UNI PAR INDUSTRIE VERTICALE
  37. FIGURE 23 ANALYSE DU MARCHÉ DE LA FACTURATION E AU ROYAUME-UNI PAR RÉGION
  38. FIGURE 24 ANALYSE DU MARCHÉ DE LA FACTURATION FRANCE E PAR MODE DE DÉPLOIEMENT
  39. FIGURE 25 ANALYSE DU MARCHÉ DE LA FACTURATION FRANCE E PAR UTILISATEUR FINAL
  40. FIGURE 26 ANALYSE DU MARCHÉ DE LA FACTURATION FRANCE E PAR COMPOSANTE
  41. FIGURE 27 . FRANCE E ANALYSE DU MARCHÉ DE LA FACTURATION PAR INDUSTRIE VERTICALE
  42. FIGURE 28 ANALYSE DU MARCHÉ DE LA FACTURATION E EN FRANCE PAR RÉGION
  43. FIGURE 29 ANALYSE DU MARCHÉ DE LA FACTURATION E EN RUSSIE PAR MODE DE DÉPLOIEMENT
  44. FIGURE 30 ANALYSE DU MARCHÉ DE LA FACTURATION E EN RUSSIE PAR UTILISATEUR FINAL
  45. FIGURE 31 RUSSIE E ANALYSE DU MARCHÉ DE LA FACTURATION PAR COMPOSANTE
  46. FIGURE 32 ANALYSE DU MARCHÉ DE LA FACTURATION E EN RUSSIE PAR INDUSTRIE VERTICALE
  47. FIGURE 33 ANALYSE DU MARCHÉ DE LA FACTURATION E EN RUSSIE PAR RÉGION
  48. FIGURE 34 ANALYSE DU MARCHÉ DE LA FACTURATION E EN ITALIE PAR MODE DE DÉPLOIEMENT
  49. FIGURE 35 ITALIE E ANALYSE DU MARCHÉ DE LA FACTURATION PAR UTILISATEUR FINAL
  50. FIGURE 36 ANALYSE DU MARCHÉ DE LA FACTURATION E EN ITALIE PAR COMPOSANTE
  51. FIGURE 37 ANALYSE DU MARCHÉ DE LA FACTURATION E EN ITALIE PAR INDUSTRIE VERTICALE
  52. FIGURE 38 ANALYSE DU MARCHÉ DE LA FACTURATION E EN ITALIE PAR RÉGION
  53. FIGURE 39 ESPAGNE E MARCHÉ DE LA FACTURATION ANALYSE PAR MODE DE DÉPLOIEMENT
  54. FIGURE 40 ESPAGNE E ANALYSE DU MARCHÉ DE LA FACTURATION PAR UTILISATEUR FINAL
  55. FIGURE 41 ESPAGNE E ANALYSE DU MARCHÉ DE LA FACTURATION PAR COMPOSANTE
  56. FIGURE 42 ESPAGNE E ANALYSE DU MARCHÉ DE LA FACTURATION PAR INDUSTRIE VERTICALE
  57. FIGURE 43 ESPAGNE E FACTURATION ANALYSE DU MARCHÉ PAR RÉGION
  58. FIGURE 44 RESTE DE L'EUROPE E ANALYSE DU MARCHÉ DE LA FACTURATION PAR MODE DE DÉPLOIEMENT
  59. FIGURE 45 RESTE DE L'EUROPE E ANALYSE DU MARCHÉ DE LA FACTURATION PAR UTILISATEUR FINAL
  60. FIGURE 46 RESTE DE L'EUROPE E FACTURATION ANALYSE DU MARCHÉ PAR COMPOSANTE
  61. FIGURE 47 RESTE DE L'EUROPE E ANALYSE DU MARCHÉ DE LA FACTURATION E PAR INDUSTRIE VERTICALE
  62. FIGURE 48 RESTE DE L'EUROPE E ANALYSE DU MARCHÉ DE LA FACTURATION E PAR RÉGION
  63. FIGURE 49 ANALYSE DU MARCHÉ DE LA FACTURATION E APAC
  64. FIGURE 50 ANALYSE DU MARCHÉ DE LA FACTURATION E EN CHINE PAR MODE DE DÉPLOIEMENT
    1. CHIFFRE 51. ANALYSE DU MARCHÉ DE LA FACTURATION E EN CHINE PAR UTILISATEUR FINAL
  65. FIGURE 52 ANALYSE DU MARCHÉ DE LA FACTURATION E EN CHINE PAR COMPOSANTE
  66. FIGURE 53 ANALYSE DU MARCHÉ DE LA FACTURATION E EN CHINE PAR INDUSTRIE VERTICALE
  67. FIGURE 54 MARCHÉ DE LA FACTURATION E EN CHINE ANALYSE PAR RÉGION
    1. CHIFFRE 55. ANALYSE DU MARCHÉ DE LA FACTURATION E EN INDE PAR MODE DE DÉPLOIEMENT
  68. FIGURE 56 ANALYSE DU MARCHÉ DE LA FACTURATION E EN INDE PAR UTILISATEUR FINAL
  69. FIGURE 57 ANALYSE DU MARCHÉ DE LA FACTURATION E EN INDE PAR COMPOSANTE
  70. FIGURE 58 MARCHÉ DE LA FACTURATION E EN INDE ANALYSE PAR INDUSTRIE VERTICALE
  71. FIGURE 59 INDE E ANALYSE DU MARCHÉ DE LA FACTURATION PAR RÉGION
  72. FIGURE 60 JAPON E ANALYSE DU MARCHÉ DE LA FACTURATION PAR MODE DE DÉPLOIEMENT
  73. FIGURE 61 JAPON E ANALYSE DU MARCHÉ DE LA FACTURATION PAR UTILISATEUR FINAL
  74. FIGURE 62 JAPON E ANALYSE DU MARCHÉ DE LA FACTURATION PAR COMPOSANTE
  75. FIGURE 63 ANALYSE DU MARCHÉ DE LA FACTURATION E AU JAPON PAR INDUSTRIE VERTICALE
  76. FIGURE 64 ANALYSE DU MARCHÉ DE LA FACTURATION E AU JAPON PAR RÉGION
  77. FIGURE 65 ANALYSE DU MARCHÉ DE LA FACTURATION E EN CORÉE DU SUD PAR MODE DE DÉPLOIEMENT
  78. FIGURE 66 CORÉE DU SUD E ANALYSE DU MARCHÉ DE LA FACTURATION PAR UTILISATEUR FINAL
  79. FIGURE 67 ANALYSE DU MARCHÉ DE LA FACTURATION E EN CORÉE DU SUD PAR COMPOSANTE
  80. FIGURE 68 ANALYSE DU MARCHÉ DE LA FACTURATION E EN CORÉE DU SUD PAR INDUSTRIE VERTICALE
  81. FIGURE 69 ANALYSE DU MARCHÉ DE LA FACTURATION E EN CORÉE DU SUD PAR RÉGION
  82. FIGURE 70 MALAISIE E FACTURATION ANALYSE DU MARCHÉ PAR MODE DE DÉPLOIEMENT
  83. FIGURE 71 MALAISIE E ANALYSE DU MARCHÉ DE LA FACTURATION PAR UTILISATEUR FINAL
  84. FIGURE 72 MALAISIE E ANALYSE DU MARCHÉ DE LA FACTURATION PAR COMPOSANTE
  85. FIGURE 73 MALAISIE E ANALYSE DU MARCHÉ DE LA FACTURATION PAR INDUSTRIE VERTICALE FIGURE 74. MALAISIE E ANALYSE DU MARCHÉ DE LA FACTURATION PAR RÉGION
  86. FIGURE 75 THAÏLANDE E ANALYSE DU MARCHÉ DE LA FACTURATION PAR MODE DE DÉPLOIEMENT
  87. FIGURE 76 THAÏLANDE E ANALYSE DU MARCHÉ DE LA FACTURATION PAR UTILISATEUR FINAL
  88. FIGURE 77 THAÏLANDE E ANALYSE DU MARCHÉ DE LA FACTURATION PAR UTILISATEUR FINAL COMPOSANT
  89. FIGURE 78 ANALYSE DU MARCHÉ DE LA FACTURATION E EN THAÏLANDE PAR INDUSTRIE VERTICALE
  90. FIGURE 79 ANALYSE DU MARCHÉ DE LA FACTURATION E EN THAÏLANDE PAR RÉGION
  91. FIGURE 80 ANALYSE DU MARCHÉ DE LA FACTURATION E EN INDONÉSIE PAR MODE DE DÉPLOIEMENT
  92. FIGURE 81 MARCHÉ DE LA FACTURATION E EN INDONÉSIE ANALYSE PAR UTILISATEUR FINAL
  93. FIGURE 82 ANALYSE DU MARCHÉ DE LA FACTURATION E EN INDONÉSIE PAR COMPOSANTE
  94. FIGURE 83 ANALYSE DU MARCHÉ DE LA FACTURATION E EN INDONÉSIE PAR INDUSTRIE VERTICALE
  95. FIGURE 84 ANALYSE DU MARCHÉ DE LA FACTURATION E EN INDONÉSIE PAR RÉGION
  96. FIGURE 85 RESTE DU MARCHÉ DE LA FACTURATION APAC E ANALYSE PAR MODE DE DÉPLOIEMENT
  97. FIGURE 86 ANALYSE DU MARCHÉ DE LA FACTURATION E RESTE DE L'APAC E PAR UTILISATEUR FINAL
  98. FIGURE 87 ANALYSE DU MARCHÉ DE LA FACTURATION E RESTE DE L'APAC E PAR COMPOSANTE
  99. FIGURE 88 RESTE DU MARCHÉ DE LA FACTURATION E APAC E ANALYSE PAR INDUSTRIE VERTICALE
    1. CHIFFRE 89. RESTE DE L'APAC E ANALYSE DU MARCHÉ DE LA FACTURATION E PAR RÉGION
  100. FIGURE 90 ANALYSE DU MARCHÉ DE LA FACTURATION E EN AMÉRIQUE DU SUD
  101. FIGURE 91 ANALYSE DU MARCHÉ DE LA FACTURATION E AU BRÉSIL PAR MODE DE DÉPLOIEMENT
  102. FIGURE 92 MARCHÉ DE LA FACTURATION E AU BRÉSIL ANALYSE PAR UTILISATEUR FINAL
  103. FIGURE 93 ANALYSE DU MARCHÉ DE LA FACTURATION E AU BRÉSIL PAR COMPOSANTE
  104. FIGURE 94 ANALYSE DU MARCHÉ DE LA FACTURATION E AU BRÉSIL PAR INDUSTRIE VERTICALE
  105. FIGURE 95 ANALYSE DU MARCHÉ DE LA FACTURATION E AU BRÉSIL PAR RÉGION
  106. FIGURE 96 MEXIQUE E ANALYSE DU MARCHÉ DE LA FACTURATION PAR MODE DE DÉPLOIEMENT
  107. FIGURE 97 ANALYSE DU MARCHÉ DE LA FACTURATION E AU MEXIQUE PAR UTILISATEUR FINAL
  108. FIGURE 98 ANALYSE DU MARCHÉ DE LA FACTURATION E AU MEXIQUE PAR COMPOSANTE
  109. FIGURE 99 ANALYSE DU MARCHÉ DE LA FACTURATION E AU MEXIQUE PAR INDUSTRIE VERTICALE
  110. FIGURE 100 FACTURATION AU MEXIQUE E ANALYSE DU MARCHÉ PAR RÉGION
  111. FIGURE 101 ANALYSE DU MARCHÉ DE LA FACTURATION ARGENTINE E PAR MODE DE DÉPLOIEMENT
  112. FIGURE 102 ANALYSE DU MARCHÉ DE LA FACTURATION ARGENTINE E PAR UTILISATEUR FINAL
  113. FIGURE 103 ANALYSE DU MARCHÉ DE LA FACTURATION ARGENTINE E PAR COMPOSANTE
    1. GRAPHIQUE 104. ARGENTINE E ANALYSE DU MARCHÉ DE LA FACTURATION PAR INDUSTRIE VERTICALE
  114. FIGURE 105 ARGENTINE E ANALYSE DU MARCHÉ DE LA FACTURATION PAR RÉGION
  115. FIGURE 106 RESTE DE L'AMÉRIQUE DU SUD E ANALYSE DU MARCHÉ DE LA FACTURATION PAR MODE DE DÉPLOIEMENT
  116. FIGURE 107 RESTE DE L'AMÉRIQUE DU SUD MARCHÉ AMÉRIQUE DE LA FACTURATION E ANALYSE PAR UTILISATEUR FINAL
  117. FIGURE 108 RESTE DE L'AMÉRIQUE DU SUD E ANALYSE DU MARCHÉ DE LA FACTURATION PAR COMPOSANTE
  118. FIGURE 109 RESTE DE L'AMÉRIQUE DU SUD E ANALYSE DU MARCHÉ DE LA FACTURATION PAR INDUSTRIE VERTICALE
  119. FIGURE 110 RESTE DE L'AMÉRIQUE DU SUD E ANALYSE DU MARCHÉ DE LA FACTURATION PAR RÉGION
  120. FIGURE 111 ANALYSE DU MARCHÉ DE LA FACTURATION DES MEA E
  121. FIGURE 112 ANALYSE DU MARCHÉ DE LA FACTURATION DES PAYS DU CCG PAR MODE DE DÉPLOIEMENT
  122. FIGURE 113 ANALYSE DU MARCHÉ DE LA FACTURATION DES PAYS DU CCG E PAR UTILISATEUR FINAL
  123. FIGURE 114 PAYS DU CCG E MARCHÉ DE LA FACTURATION . ANALYSE PAR COMPOSANTE
  124. FIGURE 115 PAYS DU CCG E ANALYSE DU MARCHÉ DE LA FACTURATION PAR INDUSTRIE VERTICALE
  125. FIGURE 116 PAYS DU CCG E ANALYSE DU MARCHÉ DE LA FACTURATION PAR RÉGION
  126. FIGURE 117 AFRIQUE DU SUD E ANALYSE DU MARCHÉ DE LA FACTURATION PAR MODE DE DÉPLOIEMENT
    1. CHIFFRE 118. AFRIQUE DU SUD ANALYSE DU MARCHÉ DE LA FACTURATION E PAR UTILISATEUR FINAL
  127. FIGURE 119 AFRIQUE DU SUD ANALYSE DU MARCHÉ DE LA FACTURATION E PAR COMPOSANTE
  128. FIGURE 120 AFRIQUE DU SUD ANALYSE DU MARCHÉ DE LA FACTURATION E PAR INDUSTRIE VERTICALE
  129. FIGURE 121 SUD MARCHÉ AFRIQUE DE LA FACTURATION E ANALYSE PAR RÉGION
  130. FIGURE 122 ANALYSE DU MARCHÉ DE LA FACTURATION DU RESTE DE MEA E PAR MODE DE DÉPLOIEMENT
  131. FIGURE 123 ANALYSE DU MARCHÉ DE LA FACTURATION DU RESTE DE MEA E PAR UTILISATEUR FINAL
  132. FIGURE 124 RESTE DU MARCHÉ DE LA FACTURATION DE MEA E ANALYSE PAR COMPOSANTE
    1. CHIFFRE 125. ANALYSE DU MARCHÉ DE LA FACTURATION DU RESTE DES MEA E PAR INDUSTRIE VERTICALE
  133. FIGURE 126 ANALYSE DU MARCHÉ DE LA FACTURATION DES MEA E PAR RÉGION
  134. FIGURE 127 CRITÈRES D'ACHAT CLÉS DU MARCHÉ DE LA FACTURATION E
  135. FIGURE 128 RECHERCHE PROCESSUS DE MRFR
  136. FIGURE 129 ANALYSE DRO DU MARCHÉ DE LA FACTURATION E
  137. FIGURE 130 ANALYSE D'IMPACT DES FACTEURS : MARCHÉ DE LA FACTURATION E
  138. FIGURE 131 ANALYSE D'IMPACT DES RESTRICTIONS : MARCHÉ DE LA FACTURATION E
  139. FIGURE 132 CHAÎNE D'APPROVISIONNEMENT / DE VALEUR : FACTURATION E MARCHÉ
    1. CHIFFRE 133. MARCHÉ DE LA FACTURATION E, PAR MODE DE DÉPLOIEMENT, 2024 (% DE PART)
  140. FIGURE 134 MARCHÉ DE LA FACTURATION E, PAR MODE DE DÉPLOIEMENT, 2019 À 2032 (en milliards USD)
  141. FIGURE 135 MARCHÉ DE LA FACTURATION E, PAR FIN UTILISATEUR, 2024 (% PART)
    1. CHIFFRE 136. MARCHÉ DE LA FACTURATION E, PAR UTILISATEUR FINAL, 2019 À 2032 (en milliards USD)
  142. FIGURE 137 MARCHÉ DE LA FACTURATION E, PAR COMPOSANTE, 2024 (PART EN%)
  143. FIGURE 138 MARCHÉ DE LA FACTURATION E, PAR COMPOSANTE, 2019 À 2032 (en milliards USD)
    1. CHIFFRE 139. MARCHÉ DE LA FACTURATION E, PAR INDUSTRIE VERTICALE, 2024 (PARTAGE EN%)
  144. FIGURE 140 MARCHÉ DE LA FACTURATION E, PAR INDUSTRIE VERTICALE, 2019 À 2032 (en milliards USD)
  145. FIGURE 141 MARCHÉ DE LA FACTURATION E, PAR RÉGIONAL , 2024 (% PART)
  146. FIGURE 142 MARCHÉ DE LA FACTURATION E, PAR RÉGIONAL, 2019 À 2032 (en milliards USD)
  147. FIGURE 143 BENCHMARKING DES PRINCIPAUX CONCURRENTS

Segmentation du marché de la facturation électronique

  • Marché de la facturation électronique par mode de déploiement (en milliards USD, 2019-2032)
    • Basé sur le cloud
    • Sur site
    • Hybride


  • Marché de la facturation électronique par utilisateur final (en milliards de dollars américains, 2019-2032)
    • Petites entreprises
    • Moyennes entreprises
    • Grandes entreprises


  • Marché de la facturation électronique par composante (en milliards de dollars américains, 2019-2032)
    • Logiciel
    • Services
    • Intégration


  • Marché de la facturation électronique par secteur vertical (en milliards de dollars américains, 2019-2032)
    • Commerce de détail
    • Soins de santé
    • Fabrication
    • Construction
    • Nourriture et boissons


  • Marché de la facturation électronique par région (en milliards de dollars, 2019-2032)
    • Amérique du Nord
    • Europe
    • Amérique du Sud
    • Asie-Pacifique
    • Moyen-Orient et Afrique


Perspectives régionales du marché de la facturation électronique (en milliards de dollars américains, 2019-2032)


  • Perspectives de l'Amérique du Nord (en milliards de dollars, 2019-2032)
    • Marché de la facturation électronique en Amérique du Nord, par type de mode de déploiement
      • Basé sur le cloud
      • Sur site
      • Hybride
    • Marché de la facturation électronique en Amérique du Nord, par type d'utilisateur final
      • Petites entreprises
      • Moyennes entreprises
      • Grandes entreprises
    • Marché de la facturation électronique en Amérique du Nord par type de composant
      • Logiciel
      • Services
      • Intégration
    • Marché de la facturation électronique en Amérique du Nord, par type vertical d'industrie
      • Commerce de détail
      • Soins de santé
      • Fabrication
      • Construction
      • Nourriture et boissons
    • Marché de la facturation électronique en Amérique du Nord par type régional
      • États-Unis
      • Canada
    • Perspectives des États-Unis (en milliards de dollars, 2019-2032)
    • Marché de la facturation électronique aux États-Unis, par type de mode de déploiement
      • Basé sur le cloud
      • Sur site
      • Hybride
    • Marché de la facturation électronique aux États-Unis, par type d'utilisateur final
      • Petites entreprises
      • Moyennes entreprises
      • Grandes entreprises
    • Marché américain de la facturation électronique par type de composant
      • Logiciel
      • Services
      • Intégration
    • Marché de la facturation électronique aux États-Unis, par type vertical d'industrie
      • Commerce de détail
      • Soins de santé
      • Fabrication
      • Construction
      • Nourriture et boissons
    • Perspectives du CANADA (milliards de dollars américains, 2019-2032)
    • Marché de la facturation électronique au CANADA par type de mode de déploiement
      • Basé sur le cloud
      • Sur site
      • Hybride
    • Marché canadien de la facturation électronique par type d'utilisateur final
      • Petites entreprises
      • Moyennes entreprises
      • Grandes entreprises
    • Marché canadien de la facturation électronique par type de composant
      • Logiciel
      • Services
      • Intégration
    • CANADA Marché de la facturation électronique par type vertical d'industrie
      • Commerce de détail
      • Soins de santé
      • Fabrication
      • Construction
      • Nourriture et boissons
    • Perspectives de l'Europe (en milliards de dollars, 2019-2032)
      • Marché européen de la facturation électronique par type de mode de déploiement
        • Basé sur le cloud
        • Sur site
        • Hybride
      • Marché européen de la facturation électronique par type d'utilisateur final
        • Petites entreprises
        • Moyennes entreprises
        • Grandes entreprises
      • Marché européen de la facturation électronique par type de composant
        • Logiciel
        • Services
        • Intégration
      • Marché européen de la facturation électronique par type vertical d'industrie
        • Commerce de détail
        • Soins de santé
        • Fabrication
        • Construction
        • Nourriture et boissons
      • Marché européen de la facturation électronique par type régional
        • Allemagne
        • Royaume-Uni
        • France
        • Russie
        • Italie
        • Espagne
        • Reste de l'Europe
      • Perspectives de l'ALLEMAGNE (en milliards de dollars, 2019-2032)
      • ALLEMAGNE E Marché de la facturation par type de mode de déploiement
        • Basé sur le cloud
        • Sur site
        • Hybride
      • ALLEMAGNE Marché de la facturation électronique par type d'utilisateur final
        • Petites entreprises
        • Moyennes entreprises
        • Grandes entreprises
      • ALLEMAGNE Marché de la facturation électronique par type de composant
        • Logiciel
        • Services
        • Intégration
      • ALLEMAGNE Marché de la facturation électronique par type vertical d'industrie
        • Commerce de détail
        • Soins de santé
        • Fabrication
        • Construction
        • Nourriture et boissons
      • Perspectives du Royaume-Uni (milliards de dollars américains, 2019-2032)
      • Marché de la facturation électronique au Royaume-Uni, par type de mode de déploiement
        • Basé sur le cloud
        • Sur site
        • Hybride
      • Marché de la facturation électronique au Royaume-Uni, par type d'utilisateur final
        • Petites entreprises
        • Moyennes entreprises
        • Grandes entreprises
      • Marché de la facturation électronique au Royaume-Uni par type de composant
        • Logiciel
        • Services
        • Intégration
      • Marché de la facturation électronique au Royaume-Uni, par type vertical d'industrie
        • Commerce de détail
        • Soins de santé
        • Fabrication
        • Construction
        • Nourriture et boissons
      • Perspectives de la FRANCE (en milliards de dollars, 2019-2032)
      • FRANCE Marché de la facturation électronique par type de mode de déploiement
        • Basé sur le cloud
        • Sur site
        • Hybride
      • FRANCE Marché de la facturation électronique par type d'utilisateur final
        • Petites entreprises
        • Moyennes entreprises
        • Grandes entreprises
      • FRANCE Marché de la facturation électronique par type de composant
        • Logiciel
        • Services
        • Intégration
      • FRANCE Marché de la facturation électronique par type vertical d'industrie
        • Commerce de détail
        • Soins de santé
        • Fabrication
        • Construction
        • Nourriture et boissons
      • Perspectives de la RUSSIE (en milliards de dollars, 2019-2032)
      • RUSSIE Marché de la facturation E par type de mode de déploiement
        • Basé sur le cloud
        • Sur site
        • Hybride
      • RUSSIE Marché de la facturation électronique par type d'utilisateur final
        • Petites entreprises
        • Moyennes entreprises
        • Grandes entreprises
      • RUSSIE Marché de la facturation électronique par type de composant
        • Logiciel
        • Services
        • Intégration
      • RUSSIE Marché de la facturation électronique par type vertical d'industrie
        • Commerce de détail
        • Soins de santé
        • Fabrication
        • Construction
        • Nourriture et boissons
      • Perspectives de l'ITALIE (en milliards de dollars, 2019-2032)
      • ITALIE E Marché de la facturation par type de mode de déploiement
        • Basé sur le cloud
        • Sur site
        • Hybride
      • ITALIE Marché de la facturation électronique par type d'utilisateur final
        • Petites entreprises
        • Moyennes entreprises
        • Grandes entreprises
      • ITALIE Marché de la facturation électronique par type de composant
        • Logiciel
        • Services
        • Intégration
      • ITALIE Marché de la facturation électronique par type vertical d'industrie
        • Commerce de détail
        • Soins de santé
        • Fabrication
        • Construction
        • Nourriture et boissons
      • Perspectives de l'ESPAGNE (milliards USD, 2019-2032)
      • ESPAGNE E Marché de la facturation par type de mode de déploiement
        • Basé sur le cloud
        • Sur site
        • Hybride
      • ESPAGNE Marché de la facturation électronique par type d'utilisateur final
        • Petites entreprises
        • Moyennes entreprises
        • Grandes entreprises
      • ESPAGNE Marché de la facturation électronique par type de composant
        • Logiciel
        • Services
        • Intégration
      • ESPAGNE Marché de la facturation électronique par type vertical d'industrie
        • Commerce de détail
        • Soins de santé
        • Fabrication
        • Construction
        • Nourriture et boissons
      • Perspectives RESTE DE L'EUROPE (en milliards USD, 2019-2032)
      • RESTE DE L'EUROPE Marché de facturation E par type de mode de déploiement
        • Basé sur le cloud
        • Sur site
        • Hybride
      • RESTE DE L'EUROPE Marché de la facturation électronique par type d'utilisateur final
        • Petites entreprises
        • Moyennes entreprises
        • Grandes entreprises
      • RESTE DE L'EUROPE Marché de la facturation E par type de composant
        • Logiciel
        • Services
        • Intégration
      • RESTE DE L'EUROPE Marché de la facturation électronique par type vertical d'industrie
        • Commerce de détail
        • Soins de santé
        • Fabrication
        • Construction
        • Nourriture et boissons
      • Perspectives APAC (en milliards de dollars, 2019-2032)
        • Marché de la facturation E APAC par type de mode de déploiement
          • Basé sur le cloud
          • Sur site
          • Hybride
        • Marché de la facturation électronique APAC par type d'utilisateur final
          • Petites entreprises
          • Moyennes entreprises
          • Grandes entreprises
        • Marché de la facturation électronique APAC par type de composant
          • Logiciel
          • Services
          • Intégration
        • Marché de la facturation électronique APAC par type vertical d'industrie
          • Commerce de détail
          • Soins de santé
          • Fabrication
          • Construction
          • Nourriture et boissons
        • Marché de la facturation électronique APAC par type régional
          • Chine
          • Inde
          • Japon
          • Corée du Sud
          • Malaisie
          • Thaïlande
          • Indonésie
          • Reste de l'Asie-Pacifique
        • Perspectives de la CHINE (milliards USD, 2019-2032)
        • CHINE E Marché de facturation électronique par type de mode de déploiement
          • Basé sur le cloud
          • Sur site
          • Hybride
        • CHINE Marché de la facturation électronique par type d'utilisateur final
          • Petites entreprises
          • Moyennes entreprises
          • Grandes entreprises
        • Marché de la facturation électronique en CHINE par type de composant
          • Logiciel
          • Services
          • Intégration
        • CHINE Marché de la facturation électronique par type vertical d'industrie
          • Commerce de détail
          • Soins de santé
          • Fabrication
          • Construction
          • Nourriture et boissons
        • Perspectives de l'INDE (en milliards de dollars, 2019-2032)
        • INDE Marché de la facturation électronique par type de mode de déploiement
          • Basé sur le cloud
          • Sur site
          • Hybride
        • INDE Marché de la facturation électronique par type d'utilisateur final
          • Petites entreprises
          • Moyennes entreprises
          • Grandes entreprises
        • INDE Marché de la facturation électronique par type de composant
          • Logiciel
          • Services
          • Intégration
        • INDE Marché de la facturation électronique par type vertical d'industrie
          • Commerce de détail
          • Soins de santé
          • Fabrication
          • Construction
          • Nourriture et boissons
        • Perspectives du JAPON (milliards USD, 2019-2032)
        • JAPON E Marché de la facturation électronique par type de mode de déploiement
          • Basé sur le cloud
          • Sur site
          • Hybride
        • JAPON Marché de la facturation électronique par type d'utilisateur final
          • Petites entreprises
          • Moyennes entreprises
          • Grandes entreprises
        • JAPON Marché de la facturation électronique par type de composant
          • Logiciel
          • Services
          • Intégration
        • JAPON Marché de la facturation électronique par type vertical d'industrie
          • Commerce de détail
          • Soins de santé
          • Fabrication
          • Construction
          • Nourriture et boissons
        • Perspectives de la CORÉE DU SUD (en milliards de dollars américains, 2019-2032)
        • Corée du Sud E Marché de la facturation par type de mode de déploiement
          • Basé sur le cloud
          • Sur site
          • Hybride
        • CORÉE DU SUD Marché de la facturation électronique par type d'utilisateur final
          • Petites entreprises
          • Moyennes entreprises
          • Grandes entreprises
        • CORÉE DU SUD E Marque de facturationet par type de composant
          • Logiciel
          • Services
          • Intégration
        • CORÉE DU SUD Marché de la facturation électronique par type vertical d'industrie
          • Commerce de détail
          • Soins de santé
          • Fabrication
          • Construction
          • Nourriture et boissons
        • Perspectives de la MALAISIE (en milliards de dollars américains, 2019-2032)
        • MALAISIE Marché de la facturation E par type de mode de déploiement
          • Basé sur le cloud
          • Sur site
          • Hybride
        • MALAISIE Marché de la facturation électronique par type d'utilisateur final
          • Petites entreprises
          • Moyennes entreprises
          • Grandes entreprises
        • MALAISIE Marché de la facturation électronique par type de composant
          • Logiciel
          • Services
          • Intégration
        • MALAISIE Marché de la facturation électronique par type vertical d'industrie
          • Commerce de détail
          • Soins de santé
          • Fabrication
          • Construction
          • Nourriture et boissons
        • Perspectives de la THAÏLANDE (en milliards de dollars américains, 2019-2032)
        • THAÏLANDE Marché de la facturation électronique par type de mode de déploiement
          • Basé sur le cloud
          • Sur site
          • Hybride
        • THAÏLANDE Marché de la facturation électronique par type d'utilisateur final
          • Petites entreprises
          • Moyennes entreprises
          • Grandes entreprises
        • THAÏLANDE Marché de la facturation électronique par type de composant
          • Logiciel
          • Services
          • Intégration
        • THAÏLANDE Marché de la facturation électronique par type vertical d'industrie
          • Commerce de détail
          • Soins de santé
          • Fabrication
          • Construction
          • Nourriture et boissons
        • Perspectives de l'INDONÉSIE (en milliards de dollars américains, 2019-2032)
        • INDONÉSIE Marché de la facturation E par type de mode de déploiement
          • Basé sur le cloud
          • Sur site
          • Hybride
        • INDONÉSIE Marché de la facturation électronique par type d'utilisateur final
          • Petites entreprises
          • Moyennes entreprises
          • Grandes entreprises
        • INDONÉSIE Marché de la facturation électronique par type de composant
          • Logiciel
          • Services
          • Intégration
        • INDONÉSIE Marché de la facturation électronique par type vertical d'industrie
          • Commerce de détail
          • Soins de santé
          • Fabrication
          • Construction
          • Nourriture et boissons
        • Perspectives du reste de l'APAC (en milliards de dollars, 2019-2032)
        • RESTE DE L'APAC E Marché de facturation par type de mode de déploiement
          • Basé sur le cloud
          • Sur site
          • Hybride
        • RESTE DE L'APAC Marché de la facturation électronique par type d'utilisateur final
          • Petites entreprises
          • Moyennes entreprises
          • Grandes entreprises
        • RESTE DE L'APAC Marché de la facturation électronique par type de composant
          • Logiciel
          • Services
          • Intégration
        • RESTE DE L'APAC Marché de la facturation électronique par type vertical d'industrie
          • Commerce de détail
          • Soins de santé
          • Fabrication
          • Construction
          • Nourriture et boissons
        • Perspectives de l'Amérique du Sud (en milliards de dollars, 2019-2032)
          • Marché de la facturation électronique en Amérique du Sud, par type de mode de déploiement
            • Basé sur le cloud
            • Sur site
            • Hybride
          • Marché de la facturation électronique en Amérique du Sud, par type d'utilisateur final
            • Petites entreprises
            • Moyennes entreprises
            • Grandes entreprises
          • Marché de la facturation électronique en Amérique du Sud par type de composant
            • Logiciel
            • Services
            • Intégration
          • Marché de la facturation électronique en Amérique du Sud, par type vertical d'industrie
            • Commerce de détail
            • Soins de santé
            • Fabrication
            • Construction
            • Nourriture et boissons
          • Marché de la facturation électronique en Amérique du Sud par type régional
            • Brésil
            • Mexique
            • Argentine
            • Reste de l'Amérique du Sud
          • Perspectives du BRÉSIL (milliards USD, 2019-2032)
          • BRÉSIL Marché de la facturation E par type de mode de déploiement
            • Basé sur le cloud
            • Sur site
            • Hybride
          • BRÉSIL Marché de la facturation électronique par type d'utilisateur final
            • Petites entreprises
            • Moyennes entreprises
            • Grandes entreprises
          • BRÉSIL Marché de la facturation électronique par type de composant
            • Logiciel
            • Services
            • Intégration
          • BRÉSIL Marché de la facturation électronique par type vertical d'industrie
            • Commerce de détail
            • Soins de santé
            • Fabrication
            • Construction
            • Nourriture et boissons
          • Perspectives du MEXIQUE (en milliards de dollars, 2019-2032)
          • MEXIQUE Marché de la facturation électronique par type de mode de déploiement
            • Basé sur le cloud
            • Sur site
            • Hybride
          • MEXIQUE Marché de la facturation électronique par type d'utilisateur final
            • Petites entreprises
            • Moyennes entreprises
            • Grandes entreprises
          • MEXIQUE Marché de la facturation électronique par type de composant
            • Logiciel
            • Services
            • Intégration
          • MEXIQUE Marché de la facturation électronique par type vertical d'industrie
            • Commerce de détail
            • Soins de santé
            • Fabrication
            • Construction
            • Nourriture et boissons
          • Perspectives de l'ARGENTINE (milliards USD, 2019-2032)
          • Marché de la facturation E ARGENTINE par type de mode de déploiement
            • Basé sur le cloud
            • Sur site
            • Hybride
          • Marché de la facturation électronique en ARGENTINE par type d'utilisateur final
            • Petites entreprises
            • Moyennes entreprises
            • Grandes entreprises
          • Marché de la facturation électronique en ARGENTINE par type de composant
            • Logiciel
            • Services
            • Intégration
          • ARGENTINE Marché de la facturation électronique par type vertical d'industrie
            • Commerce de détail
            • Soins de santé
            • Fabrication
            • Construction
            • Nourriture et boissons
          • Perspectives du reste de l'Amérique du Sud (en milliards de dollars américains, 2019-2032)
          • RESTE DE L'AMÉRIQUE DU SUD Marché de la facturation électronique par type de mode de déploiement
            • Basé sur le cloud
            • Sur site
            • Hybride
          • RESTE DE L'AMÉRIQUE DU SUD Marché de la facturation électronique par type d'utilisateur final
            • Petites entreprises
            • Moyennes entreprises
            • Grandes entreprises
          • RESTE DE L'AMÉRIQUE DU SUD Marché de la facturation électronique par type de composant
            • Logiciel
            • Services
            • Intégration
          • RESTE DE L'AMÉRIQUE DU SUD Marché de la facturation électronique par type vertical d'industrie
            • Commerce de détail
            • Soins de santé
            • Fabrication
            • Construction
            • Nourriture et boissons
          • Perspectives MEA (milliards USD, 2019-2032)
            • Marché de la facturation MEA E par type de mode de déploiement
              • Basé sur le cloud
              • Sur site
              • Hybride
            • Marché de la facturation MEA E par type d'utilisateur final
              • Petites entreprises
              • Moyennes entreprises
              • Grandes entreprises
            • Marché de la facturation MEA E par type de composant
              • Logiciel
              • Services
              • Intégration
            • Marché de la facturation MEA E par type vertical d'industrie
              • Commerce de détail
              • Soins de santé
              • Fabrication
              • Construction
              • Nourriture et boissons
            • Marché de la facturation MEA E par type régional
              • Pays du CCG
              • Afrique du Sud
              • Reste de la MEA
            • Perspectives des pays du CCG (en milliards de dollars, 2019-2032)
            • PAYS DU CCG E Marché de la facturation par type de mode de déploiement
              • Basé sur le cloud
              • Sur site
              • Hybride
            • PAYS DU CCG E Marché de la facturation par type d'utilisateur final
              • Petites entreprises
              • Moyennes entreprises
              • Grandes entreprises
            • PAYS DU CCG E Marché de la facturation par type de composant
              • Logiciel
              • Services
              • Intégration
            • PAYS DU CCG E Marché de la facturation par type vertical d'industrie
              • Commerce de détail
              • Soins de santé
              • Fabrication
              • Construction
              • Nourriture et boissons
            • Perspectives de l'AFRIQUE DU SUD (en milliards de dollars, 2019-2032)
            • AFRIQUE DU SUD Marché de la facturation électronique par type de mode de déploiement
              • Basé sur le cloud
              • Sur site
              • Hybride
            • AFRIQUE DU SUD Marché de la facturation électronique par type d'utilisateur final
              • Petites entreprises
              • Moyennes entreprises
              • Grandes entreprises
            • AFRIQUE DU SUD Marché de la facturation électronique par type de composant
              • Logiciel
              • Services
              • Intégration
            • AFRIQUE DU SUD Marché de la facturation électronique par type vertical d'industrie
              • Commerce de détail
              • Soins de santé
              • Fabrication
              • Construction
              • Nourriture et boissons
            • Perspectives RESTE DES MEA (milliards USD, 2019-2032)
            • REST OF MEA E Marché de facturation par type de mode de déploiement
              • Basé sur le cloud
              • Sur site
              • Hybride
            • RESTE DU MEA E Marché de la facturation par type d'utilisateur final
              • Petites entreprises
              • Moyennes entreprises
              • Grandes entreprises
            • RESTE DU MEA E Marché de la facturation par type de composant
              • Logiciel
              • Services
              • Intégration
            • RESTE DU MEA E Marché de la facturation par type vertical d'industrie
              • Commerce de détail
              • Soins de santé
              • Fabrication
              • Construction
              • Nourriture et boissons

Compare Licence

×
Features License Type
Single User Multiuser License Enterprise User
Price $4,950 $5,950 $7,250
Maximum User Access Limit 1 User Upto 10 Users Unrestricted Access Throughout the Organization
Free Customization
Direct Access to Analyst
Deliverable Format
Platform Access
Discount on Next Purchase 10% 15% 15%
Printable Versions