Request Free Sample ×

Kindly complete the form below to receive a free sample of this Report

* Please use a valid business email

Leading companies partner with us for data-driven Insights

clients tt-cursor
Hero Background

Marché des tuyaux en fonte ductile

ID: MRFR/PCM/6130-HCR
111 Pages
Snehal Singh
Last Updated: April 22, 2026

Rapport de recherche sur le marché des tuyaux en fonte ductile Informations par diamètre (D.N. 80-300, DN 350-600, DN 700-1000, DN 1200-2000, et DN2000 et plus), par application (Eau et eaux usées et irrigation), et par région (Amérique du Nord, Europe, Asie-Pacifique, et reste du monde) – Prévisions du marché jusqu'en 2035

Partager
Download PDF ×

We do not share your information with anyone. However, we may send you emails based on your report interest from time to time. You may contact us at any time to opt-out.

Ductile Iron Pipes Market Infographic
Purchase Options
  1. 1 SECTION I : RÉSUMÉ EXÉCUTIF ET POINTS CLÉS
    1. 1.1 RÉSUMÉ EXÉCUTIF
      1. 1.1.1 Vue d'ensemble du marché
      2. 1.1.2 Conclusions clés
      3. 1.1.3 Segmentation du marché
      4. 1.1.4 Paysage concurrentiel
      5. 1.1.5 Défis et opportunités
      6. 1.1.6 Perspectives d'avenir
  2. 2 SECTION II : DÉLIMITATION, MÉTHODOLOGIE ET STRUCTURE DU MARCHÉ
    1. 2.1 INTRODUCTION AU MARCHÉ
      1. 2.1.1 Définition
      2. 2.1.2 Portée de l'étude
        1. 2.1.2.1 Objectif de recherche
        2. 2.1.2.2 Hypothèse
        3. 2.1.2.3 Limitations
    2. 2.2 MÉTHODOLOGIE DE RECHERCHE
      1. 2.2.1 Vue d'ensemble
      2. 2.2.2 Exploration des données
      3. 2.2.3 Recherche secondaire
      4. 2.2.4 Recherche primaire
        1. 2.2.4.1 Interviews primaires et processus de collecte d'informations
        2. 2.2.4.2 Répartition des répondants principaux
      5. 2.2.5 Modèle de prévision
      6. 2.2.6 Estimation de la taille du marché
        1. 2.2.6.1 Approche ascendante
        2. 2.2.6.2 Approche descendante
      7. 2.2.7 Triangulation des données
      8. 2.2.8 Validation
  3. 3 SECTION III : ANALYSE QUALITATIVE
    1. 3.1 DYNAMIQUE DU MARCHÉ
      1. 3.1.1 Vue d'ensemble
      2. 3.1.2 Facteurs moteurs
      3. 3.1.3 Contraintes
      4. 3.1.4 Opportunités
    2. 3.2 ANALYSE DES FACTEURS DU MARCHÉ
      1. 3.2.1 Analyse de la chaîne de valeur
      2. 3.2.2 Analyse des cinq forces de Porter
        1. 3.2.2.1 Pouvoir de négociation des fournisseurs
        2. 3.2.2.2 Pouvoir de négociation des acheteurs
        3. 3.2.2.3 Menace des nouveaux entrants
        4. 3.2.2.4 Menace des substituts
        5. 3.2.2.5 Intensité de la rivalité
      3. 3.2.3 Analyse de l'impact du COVID-19
        1. 3.2.3.1 Analyse de l'impact sur le marché
        2. 3.2.3.2 Impact régional
        3. 3.2.3.3 Analyse des opportunités et des menaces
  4. 4 SECTION IV : ANALYSE QUANTITATIVE
    1. 4.1 Emballage et transport, PAR diamètre (milliards USD)
      1. 4.1.1 DN 80-300
      2. 4.1.2 DN 350-600
      3. 4.1.3 DN 700-1000
      4. 4.1.4 DN 1200-2000
      5. 4.1.5 DN 2000 et plus
    2. 4.2 Emballage et transport, PAR type (milliards USD)
      1. 4.2.1 Eau et eaux usées
      2. 4.2.2 Irrigation
    3. 4.3 Emballage et transport, PAR région (milliards USD)
      1. 4.3.1 Amérique du Nord
        1. 4.3.1.1 États-Unis
        2. 4.3.1.2 Canada
      2. 4.3.2 Europe
        1. 4.3.2.1 Allemagne
        2. 4.3.2.2 Royaume-Uni
        3. 4.3.2.3 France
        4. 4.3.2.4 Russie
        5. 4.3.2.5 Italie
        6. 4.3.2.6 Espagne
        7. 4.3.2.7 Reste de l'Europe
      3. 4.3.3 APAC
        1. 4.3.3.1 Chine
        2. 4.3.3.2 Inde
        3. 4.3.3.3 Japon
        4. 4.3.3.4 Corée du Sud
        5. 4.3.3.5 Malaisie
        6. 4.3.3.6 Thaïlande
        7. 4.3.3.7 Indonésie
        8. 4.3.3.8 Reste de l'APAC
      4. 4.3.4 Amérique du Sud
        1. 4.3.4.1 Brésil
        2. 4.3.4.2 Mexique
        3. 4.3.4.3 Argentine
        4. 4.3.4.4 Reste de l'Amérique du Sud
      5. 4.3.5 MEA
        1. 4.3.5.1 Pays du CCG
        2. 4.3.5.2 Afrique du Sud
        3. 4.3.5.3 Reste de la MEA
  5. 5 SECTION V : ANALYSE CONCURRENTIELLE
    1. 5.1 Paysage concurrentiel
      1. 5.1.1 Vue d'ensemble
      2. 5.1.2 Analyse concurrentielle
      3. 5.1.3 Analyse de la part de marché
      4. 5.1.4 Stratégie de croissance majeure dans l'emballage et le transport
      5. 5.1.5 Évaluation comparative
      6. 5.1.6 Acteurs principaux en termes de nombre de développements dans l'emballage et le transport
      7. 5.1.7 Développements clés et stratégies de croissance
        1. 5.1.7.1 Lancement de nouveaux produits / Déploiement de services
        2. 5.1.7.2 Fusions et acquisitions
        3. 5.1.7.3 Coentreprises
      8. 5.1.8 Matrice financière des principaux acteurs
        1. 5.1.8.1 Ventes et revenu d'exploitation
        2. 5.1.8.2 Dépenses de R&D des principaux acteurs. 2023
    2. 5.2 Profils d'entreprise
      1. 5.2.1 Saint-Gobain (FR)
        1. 5.2.1.1 Vue d'ensemble financière
        2. 5.2.1.2 Produits offerts
        3. 5.2.1.3 Développements clés
        4. 5.2.1.4 Analyse SWOT
        5. 5.2.1.5 Stratégies clés
      2. 5.2.2 McWane (US)
        1. 5.2.2.1 Vue d'ensemble financière
        2. 5.2.2.2 Produits offerts
        3. 5.2.2.3 Développements clés
        4. 5.2.2.4 Analyse SWOT
        5. 5.2.2.5 Stratégies clés
      3. 5.2.3 Jindal Saw (IN)
        1. 5.2.3.1 Vue d'ensemble financière
        2. 5.2.3.2 Produits offerts
        3. 5.2.3.3 Développements clés
        4. 5.2.3.4 Analyse SWOT
        5. 5.2.3.5 Stratégies clés
      4. 5.2.4 U.S. Pipe (US)
        1. 5.2.4.1 Vue d'ensemble financière
        2. 5.2.4.2 Produits offerts
        3. 5.2.4.3 Développements clés
        4. 5.2.4.4 Analyse SWOT
        5. 5.2.4.5 Stratégies clés
      5. 5.2.5 Hepworth (GB)
        1. 5.2.5.1 Vue d'ensemble financière
        2. 5.2.5.2 Produits offerts
        3. 5.2.5.3 Développements clés
        4. 5.2.5.4 Analyse SWOT
        5. 5.2.5.5 Stratégies clés
      6. 5.2.6 AMERICAN Cast Iron Pipe Company (US)
        1. 5.2.6.1 Vue d'ensemble financière
        2. 5.2.6.2 Produits offerts
        3. 5.2.6.3 Développements clés
        4. 5.2.6.4 Analyse SWOT
        5. 5.2.6.5 Stratégies clés
      7. 5.2.7 Kubota (JP)
        1. 5.2.7.1 Vue d'ensemble financière
        2. 5.2.7.2 Produits offerts
        3. 5.2.7.3 Développements clés
        4. 5.2.7.4 Analyse SWOT
        5. 5.2.7.5 Stratégies clés
      8. 5.2.8 Ductile Iron Pipe Company (US)
        1. 5.2.8.1 Vue d'ensemble financière
        2. 5.2.8.2 Produits offerts
        3. 5.2.8.3 Développements clés
        4. 5.2.8.4 Analyse SWOT
        5. 5.2.8.5 Stratégies clés
      9. 5.2.9 Tata Metaliks (IN)
        1. 5.2.9.1 Vue d'ensemble financière
        2. 5.2.9.2 Produits offerts
        3. 5.2.9.3 Développements clés
        4. 5.2.9.4 Analyse SWOT
        5. 5.2.9.5 Stratégies clés
    3. 5.3 Annexe
      1. 5.3.1 Références
      2. 5.3.2 Rapports connexes
  6. 6 LISTE DES FIGURES
    1. 6.1 SYNOPSIS DU MARCHÉ
    2. 6.2 ANALYSE DU MARCHÉ EN AMÉRIQUE DU NORD
    3. 6.3 ANALYSE DU MARCHÉ AMÉRICAIN PAR DIAMÈTRE
    4. 6.4 ANALYSE DU MARCHÉ AMÉRICAIN PAR TYPE
    5. 6.5 ANALYSE DU MARCHÉ CANADIEN PAR DIAMÈTRE
    6. 6.6 ANALYSE DU MARCHÉ CANADIEN PAR TYPE
    7. 6.7 ANALYSE DU MARCHÉ EUROPÉEN
    8. 6.8 ANALYSE DU MARCHÉ ALLEMAND PAR DIAMÈTRE
    9. 6.9 ANALYSE DU MARCHÉ ALLEMAND PAR TYPE
    10. 6.10 ANALYSE DU MARCHÉ ROYAUME-UNI PAR DIAMÈTRE
    11. 6.11 ANALYSE DU MARCHÉ ROYAUME-UNI PAR TYPE
    12. 6.12 ANALYSE DU MARCHÉ FRANÇAIS PAR DIAMÈTRE
    13. 6.13 ANALYSE DU MARCHÉ FRANÇAIS PAR TYPE
    14. 6.14 ANALYSE DU MARCHÉ RUSSE PAR DIAMÈTRE
    15. 6.15 ANALYSE DU MARCHÉ RUSSE PAR TYPE
    16. 6.16 ANALYSE DU MARCHÉ ITALIEN PAR DIAMÈTRE
    17. 6.17 ANALYSE DU MARCHÉ ITALIEN PAR TYPE
    18. 6.18 ANALYSE DU MARCHÉ ESPAGNOL PAR DIAMÈTRE
    19. 6.19 ANALYSE DU MARCHÉ ESPAGNOL PAR TYPE
    20. 6.20 ANALYSE DU MARCHÉ RESTE DE L'EUROPE PAR DIAMÈTRE
    21. 6.21 ANALYSE DU MARCHÉ RESTE DE L'EUROPE PAR TYPE
    22. 6.22 ANALYSE DU MARCHÉ APAC
    23. 6.23 ANALYSE DU MARCHÉ CHINOIS PAR DIAMÈTRE
    24. 6.24 ANALYSE DU MARCHÉ CHINOIS PAR TYPE
    25. 6.25 ANALYSE DU MARCHÉ INDIEN PAR DIAMÈTRE
    26. 6.26 ANALYSE DU MARCHÉ INDIEN PAR TYPE
    27. 6.27 ANALYSE DU MARCHÉ JAPONAIS PAR DIAMÈTRE
    28. 6.28 ANALYSE DU MARCHÉ JAPONAIS PAR TYPE
    29. 6.29 ANALYSE DU MARCHÉ CORÉEN DU SUD PAR DIAMÈTRE
    30. 6.30 ANALYSE DU MARCHÉ CORÉEN DU SUD PAR TYPE
    31. 6.31 ANALYSE DU MARCHÉ MALAYSIEN PAR DIAMÈTRE
    32. 6.32 ANALYSE DU MARCHÉ MALAYSIEN PAR TYPE
    33. 6.33 ANALYSE DU MARCHÉ THAÏLAIS PAR DIAMÈTRE
    34. 6.34 ANALYSE DU MARCHÉ THAÏLAIS PAR TYPE
    35. 6.35 ANALYSE DU MARCHÉ INDONÉSIEN PAR DIAMÈTRE
    36. 6.36 ANALYSE DU MARCHÉ INDONÉSIEN PAR TYPE
    37. 6.37 ANALYSE DU MARCHÉ RESTE DE L'APAC PAR DIAMÈTRE
    38. 6.38 ANALYSE DU MARCHÉ RESTE DE L'APAC PAR TYPE
    39. 6.39 ANALYSE DU MARCHÉ EN AMÉRIQUE DU SUD
    40. 6.40 ANALYSE DU MARCHÉ BRÉSILIEN PAR DIAMÈTRE
    41. 6.41 ANALYSE DU MARCHÉ BRÉSILIEN PAR TYPE
    42. 6.42 ANALYSE DU MARCHÉ MEXICAIN PAR DIAMÈTRE
    43. 6.43 ANALYSE DU MARCHÉ MEXICAIN PAR TYPE
    44. 6.44 ANALYSE DU MARCHÉ ARGENTIN PAR DIAMÈTRE
    45. 6.45 ANALYSE DU MARCHÉ ARGENTIN PAR TYPE
    46. 6.46 ANALYSE DU MARCHÉ RESTE DE L'AMÉRIQUE DU SUD PAR DIAMÈTRE
    47. 6.47 ANALYSE DU MARCHÉ RESTE DE L'AMÉRIQUE DU SUD PAR TYPE
    48. 6.48 ANALYSE DU MARCHÉ MEA
    49. 6.49 ANALYSE DU MARCHÉ DES PAYS DU CCG PAR DIAMÈTRE
    50. 6.50 ANALYSE DU MARCHÉ DES PAYS DU CCG PAR TYPE
    51. 6.51 ANALYSE DU MARCHÉ EN AFRIQUE DU SUD PAR DIAMÈTRE
    52. 6.52 ANALYSE DU MARCHÉ EN AFRIQUE DU SUD PAR TYPE
    53. 6.53 ANALYSE DU MARCHÉ RESTE DE LA MEA PAR DIAMÈTRE
    54. 6.54 ANALYSE DU MARCHÉ RESTE DE LA MEA PAR TYPE
    55. 6.55 CRITÈRES D'ACHAT CLÉS DE L'EMBALLAGE ET DU TRANSPORT
    56. 6.56 PROCESSUS DE RECHERCHE DE MRFR
    57. 6.57 ANALYSE DRO DE L'EMBALLAGE ET DU TRANSPORT
    58. 6.58 ANALYSE D'IMPACT DES FACTEURS MOTRICES : EMBALLAGE ET TRANSPORT
    59. 6.59 ANALYSE D'IMPACT DES CONTRAINTES : EMBALLAGE ET TRANSPORT
    60. 6.60 CHAÎNE D'APPROVISIONNEMENT / VALEUR : EMBALLAGE ET TRANSPORT
    61. 6.61 EMBALLAGE ET TRANSPORT, PAR DIAMÈTRE, 2024 (% PART)
    62. 6.62 EMBALLAGE ET TRANSPORT, PAR DIAMÈTRE, 2024 À 2035 (milliards USD)
    63. 6.63 EMBALLAGE ET TRANSPORT, PAR TYPE, 2024 (% PART)
    64. 6.64 EMBALLAGE ET TRANSPORT, PAR TYPE, 2024 À 2035 (milliards USD)
    65. 6.65 ÉVALUATION COMPARATIVE DES PRINCIPAUX CONCURRENTS
  7. 7 LISTE DES TABLEAUX
    1. 7.1 LISTE DES HYPOTHÈSES
    2. 7.2 ESTIMATIONS DE TAILLE DU MARCHÉ EN AMÉRIQUE DU NORD ; PRÉVISION
      1. 7.2.1 PAR DIAMÈTRE, 2025-2035 (milliards USD)
      2. 7.2.2 PAR TYPE, 2025-2035 (milliards USD)
    3. 7.3 ESTIMATIONS DE TAILLE DU MARCHÉ AMÉRICAIN ; PRÉVISION
      1. 7.3.1 PAR DIAMÈTRE, 2025-2035 (milliards USD)
      2. 7.3.2 PAR TYPE, 2025-2035 (milliards USD)
    4. 7.4 ESTIMATIONS DE TAILLE DU MARCHÉ CANADIEN ; PRÉVISION
      1. 7.4.1 PAR DIAMÈTRE, 2025-2035 (milliards USD)
      2. 7.4.2 PAR TYPE, 2025-2035 (milliards USD)
    5. 7.5 ESTIMATIONS DE TAILLE DU MARCHÉ EUROPÉEN ; PRÉVISION
      1. 7.5.1 PAR DIAMÈTRE, 2025-2035 (milliards USD)
      2. 7.5.2 PAR TYPE, 2025-2035 (milliards USD)
    6. 7.6 ESTIMATIONS DE TAILLE DU MARCHÉ ALLEMAND ; PRÉVISION
      1. 7.6.1 PAR DIAMÈTRE, 2025-2035 (milliards USD)
      2. 7.6.2 PAR TYPE, 2025-2035 (milliards USD)
    7. 7.7 ESTIMATIONS DE TAILLE DU MARCHÉ ROYAUME-UNI ; PRÉVISION
      1. 7.7.1 PAR DIAMÈTRE, 2025-2035 (milliards USD)
      2. 7.7.2 PAR TYPE, 2025-2035 (milliards USD)
    8. 7.8 ESTIMATIONS DE TAILLE DU MARCHÉ FRANÇAIS ; PRÉVISION
      1. 7.8.1 PAR DIAMÈTRE, 2025-2035 (milliards USD)
      2. 7.8.2 PAR TYPE, 2025-2035 (milliards USD)
    9. 7.9 ESTIMATIONS DE TAILLE DU MARCHÉ RUSSE ; PRÉVISION
      1. 7.9.1 PAR DIAMÈTRE, 2025-2035 (milliards USD)
      2. 7.9.2 PAR TYPE, 2025-2035 (milliards USD)
    10. 7.10 ESTIMATIONS DE TAILLE DU MARCHÉ ITALIEN ; PRÉVISION
      1. 7.10.1 PAR DIAMÈTRE, 2025-2035 (milliards USD)
      2. 7.10.2 PAR TYPE, 2025-2035 (milliards USD)
    11. 7.11 ESTIMATIONS DE TAILLE DU MARCHÉ ESPAGNOL ; PRÉVISION
      1. 7.11.1 PAR DIAMÈTRE, 2025-2035 (milliards USD)
      2. 7.11.2 PAR TYPE, 2025-2035 (milliards USD)
    12. 7.12 ESTIMATIONS DE TAILLE DU MARCHÉ RESTE DE L'EUROPE ; PRÉVISION
      1. 7.12.1 PAR DIAMÈTRE, 2025-2035 (milliards USD)
      2. 7.12.2 PAR TYPE, 2025-2035 (milliards USD)
    13. 7.13 ESTIMATIONS DE TAILLE DU MARCHÉ APAC ; PRÉVISION
      1. 7.13.1 PAR DIAMÈTRE, 2025-2035 (milliards USD)
      2. 7.13.2 PAR TYPE, 2025-2035 (milliards USD)
    14. 7.14 ESTIMATIONS DE TAILLE DU MARCHÉ CHINOIS ; PRÉVISION
      1. 7.14.1 PAR DIAMÈTRE, 2025-2035 (milliards USD)
      2. 7.14.2 PAR TYPE, 2025-2035 (milliards USD)
    15. 7.15 ESTIMATIONS DE TAILLE DU MARCHÉ INDIEN ; PRÉVISION
      1. 7.15.1 PAR DIAMÈTRE, 2025-2035 (milliards USD)
      2. 7.15.2 PAR TYPE, 2025-2035 (milliards USD)
    16. 7.16 ESTIMATIONS DE TAILLE DU MARCHÉ JAPONAIS ; PRÉVISION
      1. 7.16.1 PAR DIAMÈTRE, 2025-2035 (milliards USD)
      2. 7.16.2 PAR TYPE, 2025-2035 (milliards USD)
    17. 7.17 ESTIMATIONS DE TAILLE DU MARCHÉ CORÉEN DU SUD ; PRÉVISION
      1. 7.17.1 PAR DIAMÈTRE, 2025-2035 (milliards USD)
      2. 7.17.2 PAR TYPE, 2025-2035 (milliards USD)
    18. 7.18 ESTIMATIONS DE TAILLE DU MARCHÉ MALAYSIEN ; PRÉVISION
      1. 7.18.1 PAR DIAMÈTRE, 2025-2035 (milliards USD)
      2. 7.18.2 PAR TYPE, 2025-2035 (milliards USD)
    19. 7.19 ESTIMATIONS DE TAILLE DU MARCHÉ THAÏLAIS ; PRÉVISION
      1. 7.19.1 PAR DIAMÈTRE, 2025-2035 (milliards USD)
      2. 7.19.2 PAR TYPE, 2025-2035 (milliards USD)
    20. 7.20 ESTIMATIONS DE TAILLE DU MARCHÉ INDONÉSIEN ; PRÉVISION
      1. 7.20.1 PAR DIAMÈTRE, 2025-2035 (milliards USD)
      2. 7.20.2 PAR TYPE, 2025-2035 (milliards USD)
    21. 7.21 ESTIMATIONS DE TAILLE DU MARCHÉ RESTE DE L'APAC ; PRÉVISION
      1. 7.21.1 PAR DIAMÈTRE, 2025-2035 (milliards USD)
      2. 7.21.2 PAR TYPE, 2025-2035 (milliards USD)
    22. 7.22 ESTIMATIONS DE TAILLE DU MARCHÉ EN AMÉRIQUE DU SUD ; PRÉVISION
      1. 7.22.1 PAR DIAMÈTRE, 2025-2035 (milliards USD)
      2. 7.22.2 PAR TYPE, 2025-2035 (milliards USD)
    23. 7.23 ESTIMATIONS DE TAILLE DU MARCHÉ BRÉSILIEN ; PRÉVISION
      1. 7.23.1 PAR DIAMÈTRE, 2025-2035 (milliards USD)
      2. 7.23.2 PAR TYPE, 2025-2035 (milliards USD)
    24. 7.24 ESTIMATIONS DE TAILLE DU MARCHÉ MEXICAIN ; PRÉVISION
      1. 7.24.1 PAR DIAMÈTRE, 2025-2035 (milliards USD)
      2. 7.24.2 PAR TYPE, 2025-2035 (milliards USD)
    25. 7.25 ESTIMATIONS DE TAILLE DU MARCHÉ ARGENTIN ; PRÉVISION
      1. 7.25.1 PAR DIAMÈTRE, 2025-2035 (milliards USD)
      2. 7.25.2 PAR TYPE, 2025-2035 (milliards USD)
    26. 7.26 ESTIMATIONS DE TAILLE DU MARCHÉ RESTE DE L'AMÉRIQUE DU SUD ; PRÉVISION
      1. 7.26.1 PAR DIAMÈTRE, 2025-2035 (milliards USD)
      2. 7.26.2 PAR TYPE, 2025-2035 (milliards USD)
    27. 7.27 ESTIMATIONS DE TAILLE DU MARCHÉ MEA ; PRÉVISION
      1. 7.27.1 PAR DIAMÈTRE, 2025-2035 (milliards USD)
      2. 7.27.2 PAR TYPE, 2025-2035 (milliards USD)
    28. 7.28 ESTIMATIONS DE TAILLE DU MARCHÉ DES PAYS DU CCG ; PRÉVISION
      1. 7.28.1 PAR DIAMÈTRE, 2025-2035 (milliards USD)
      2. 7.28.2 PAR TYPE, 2025-2035 (milliards USD)
    29. 7.29 ESTIMATIONS DE TAILLE DU MARCHÉ EN AFRIQUE DU SUD ; PRÉVISION
      1. 7.29.1 PAR DIAMÈTRE, 2025-2035 (milliards USD)
      2. 7.29.2 PAR TYPE, 2025-2035 (milliards USD)
    30. 7.30 ESTIMATIONS DE TAILLE DU MARCHÉ RESTE DE LA MEA ; PRÉVISION
      1. 7.30.1 PAR DIAMÈTRE, 2025-2035 (milliards USD)
      2. 7.30.2 PAR TYPE, 2025-2035 (milliards USD)
    31. 7.31 LANCEMENT DE PRODUIT / DÉVELOPPEMENT / APPROBATION
    32. 7.32 ACQUISITION / PARTENARIAT


Tuyaux en fonte ductile Segmentation du marché

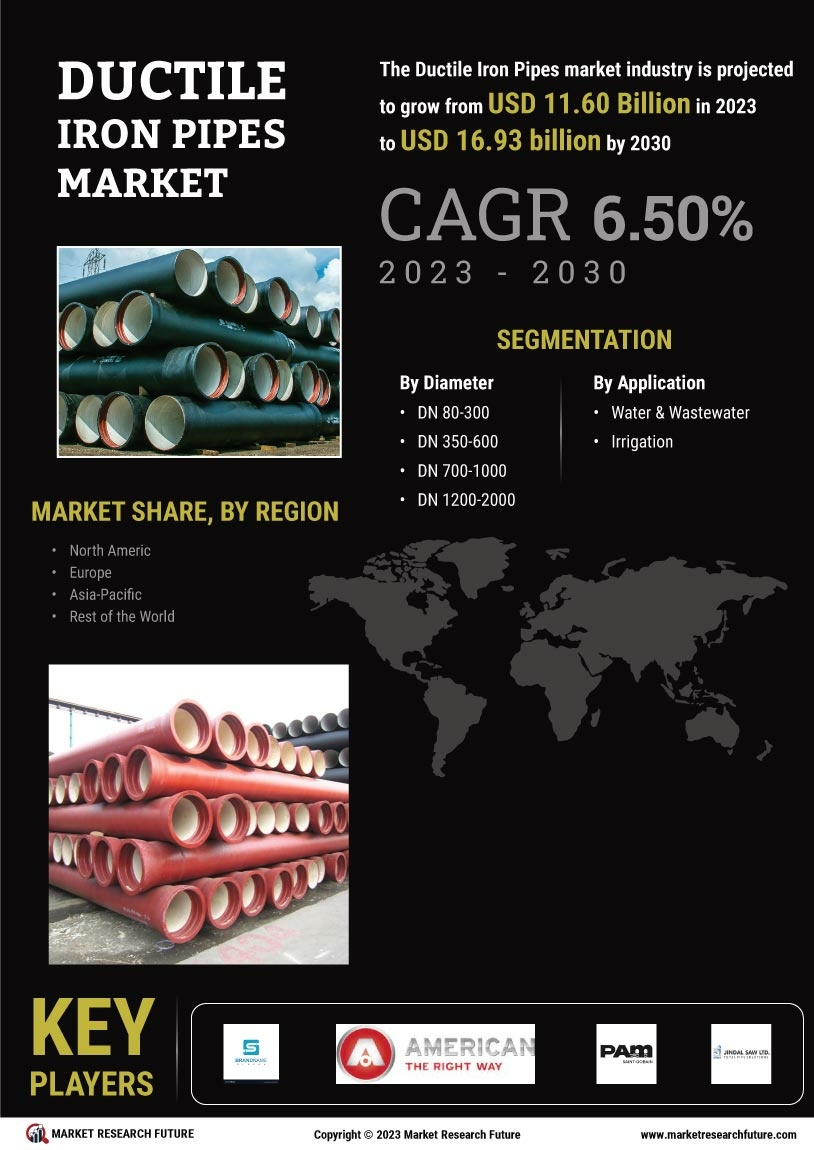
Perspectives du diamètre des tuyaux en fonte ductile (Milliards USD, 2018-2030)

  • DN 80-300

  • DN 350-600

  • DN 700-1000

  • DN 1 200-2 000

  • DN2000 et amp; ci-dessus

Perspectives d'application des tuyaux en fonte ductile (Milliards USD, 2018-2030)

  • Eau et amp; Eaux usées

  • Irrigation

Perspectives régionales des tuyaux en fonte ductile (en milliards USD, 2018-2030)

  • Perspectives de l'Amérique du Nord (milliards USD, 2018-2030)

    • Tuyaux en fonte ductile en Amérique du Nord, par technologie

      • DN 80-300

      • DN 350-600

      • DN 700-1000

      • DN 1 200-2 000

      • DN2000 et amp; ci-dessus

    • Tuyaux en fonte ductile en Amérique du Nord, par application

      • Eau et amp; Eaux usées

      • Irrigation

    • États-Unis Perspectives (en milliards de dollars américains, 2018-2030)

    • Tuyaux en fonte ductile aux États-Unis, par technologie

      • DN 80-300

      • DN 350-600

      • DN 700-1000

      • DN 1 200-2 000

      • DN2000 et amp; ci-dessus

    • Application de tuyaux en fonte ductile aux États-Unis

      • Eau et amp; Eaux usées

      • Irrigation

    • CANADA Perspectives (en milliards de dollars américains, 2018-2030)

    • Tuyaux en fonte ductile CANADA par technologie

      • DN 80-300

      • DN 350-600

      • DN 700-1000

      • DN 1 200-2 000

      • DN2000 et amp; ci-dessus

    • Tuyaux en fonte ductile CANADA par application

      • Eau et amp; Eaux usées

      • Irrigation

  • Perspectives européennes (milliards USD, 2018-2030)

    • Tuyaux en fonte ductile en Europe par technologie

      • DN 80-300

      • DN 350-600

      • DN 700-1000

      • DN 1 200-2 000

      • DN2000 et amp; ci-dessus

    • Application de tuyaux en fonte ductile en Europe

      • Eau et amp; Eaux usées

      • Irrigation

    • Allemagne Perspectives (milliards USD, 2018-2030)

    • Tuyaux en fonte ductile en Allemagne, par technologie

      • DN 80-300

      • DN 350-600

      • DN 700-1000

      • DN 1 200-2 000

      • DN2000 et amp; ci-dessus

    • Application de tuyaux en fonte ductile en Allemagne

      • Eau et amp; Eaux usées

      • Irrigation

    • Perspectives de la France (en milliards de dollars, 2018-2030)

    • Tuyaux en fonte ductile en France par technologie

      • DN 80-300

      • DN 350-600

      • DN 700-1000

      • DN 1 200-2 000

      • DN2000 et amp; ci-dessus

    • Application de tuyaux en fonte ductile en France

      • Eau et amp; Eaux usées

      • Irrigation

    • Royaume-Uni Perspectives (en milliards de dollars américains, 2018-2030)

    • Tuyaux en fonte ductile au Royaume-Uni, par technologie

      • DN 80-300

      • DN 350-600

      • DN 700-1000

      • DN 1 200-2 000

      • DN2000 et amp; ci-dessus

    • Application de tuyaux en fonte ductile au Royaume-Uni

      • Eau et amp; Eaux usées

      • Irrigation

    • ITALIE Perspectives (en milliards USD, 2018-2030)

    • Tuyaux en fonte ductile ITALIE par technologie

      • DN 80-300

      • DN 350-600

      • DN 700-1000

      • DN 1 200-2 000

      • DN2000 et amp; ci-dessus

    • Application de tuyaux en fonte ductile en ITALIE

      • Eau et amp; Eaux usées

      • Irrigation


    • ESPAGNE Perspectives (en milliards USD, 2018-2030)

    • Tuyaux en fonte ductile en Espagne par technologie

      • DN 80-300

      • DN 350-600

      • DN 700-1000

      • DN 1 200-2 000

      • DN2000 et amp; ci-dessus

    • Application de tuyaux en fonte ductile en Espagne

      • Eau et amp; Eaux usées

      • Irrigation

    • Reste de l'Europe Perspectives (en milliards USD, 2018-2030)

    • Tuyaux en fonte ductile pour le reste de l'Europe, par technologie

      • DN 80-300

      • DN 350-600

      • DN 700-1000

      • DN 1 200-2 000

      • DN2000 et amp; ci-dessus

    • Application de tuyaux en fonte ductile RESTE DE L'EUROPE

      • Eau et amp; Eaux usées

      • Irrigation

  • Perspectives Asie-Pacifique (milliards USD, 2018-2030)

    • Tuyaux en fonte ductile Asie-Pacifique par technologie

      • DN 80-300

      • DN 350-600

      • DN 700-1000

      • DN 1 200-2 000

      • DN2000 et amp; ci-dessus

    • Application de tuyaux en fonte ductile en Asie-Pacifique

      • Eau et amp; Eaux usées

      • Irrigation

    • Chine Perspectives (en milliards USD, 2018-2030)

    • Tuyaux en fonte ductile en Chine, par technologie

      • DN 80-300

      • DN 350-600

      • DN 700-1000

      • DN 1 200-2 000

      • DN2000 et amp; ci-dessus

    • Application de tuyaux en fonte ductile en Chine

      • Eau et amp; Eaux usées

      • Irrigation

    • Japon Perspectives (milliards USD, 2018-2030)

    • Tuyaux en fonte ductile au Japon par technologie

      • DN 80-300

      • DN 350-600

      • DN 700-1000

      • DN 1 200-2 000

      • DN2000 et amp; ci-dessus

    • Application de tuyaux en fonte ductile au Japon

      • Eau et amp; Eaux usées

      • Irrigation

    • Inde Perspectives (en milliards de dollars américains, 2018-2030)

    • Tuyaux en fonte ductile en Inde, par technologie

      • DN 80-300

      • DN 350-600

      • DN 700-1000

      • DN 1 200-2 000

      • DN2000 et amp; ci-dessus

    • Application de tuyaux en fonte ductile en Inde

      • Eau et amp; Eaux usées

      • Irrigation

    • Australie Perspectives (en milliards de dollars américains, 2018-2030)

    • Tuyaux en fonte ductile d'Australie par technologie

      • DN 80-300

      • DN 350-600

      • DN 700-1000

      • DN 1 200-2 000

      • DN2000 et amp; ci-dessus

    • Application de tuyaux en fonte ductile en Australie

      • Eau et amp; Eaux usées

      • Irrigation

    • Reste de Perspectives de l'Asie-Pacifique (en milliards de dollars, 2018-2030)

    • Reste des tuyaux en fonte ductile de la région Asie-Pacifique, par technologie

      • DN 80-300

      • DN 350-600

      • DN 700-1000

      • DN 1 200-2 000

      • DN2000 et amp; ci-dessus

    • Application des tuyaux en fonte ductile dans le reste de la région Asie-Pacifique

      • Eau et amp; Eaux usées

      • Irrigation

  • Perspectives du reste du monde (milliards USD, 2018-2030)

    • Tuyaux en fonte ductile pour le reste du monde, par technologie

      • DN 80-300

      • DN 350-600

      • DN 700-1000

      • DN 1 200-2 000

      • DN2000 et amp; ci-dessus

    • Application de tuyaux en fonte ductile dans le reste du monde

      • Eau et amp; Eaux usées

      • Irrigation

    • Moyen-Orient Perspectives (en milliards de dollars américains, 2018-2030)

    • Tuyaux en fonte ductile au Moyen-Orient, par technologie

      • DN 80-300

      • DN 350-600

      • DN 700-1000

      • DN 1 200-2 000

      • DN2000 et amp; ci-dessus

    • Application de tuyaux en fonte ductile au Moyen-Orient

      • Eau et amp; Eaux usées

      • Irrigation

    • Afrique Perspectives (en milliards USD, 2018-2030)

    • Tuyaux en fonte ductile en Afrique par technologie

      • DN 80-300

      • DN 350-600

      • DN 700-1000

      • DN 1 200-2 000

      • DN2000 et amp; ci-dessus

    • Application de tuyaux en fonte ductile en Afrique

      • Eau et amp; Eaux usées

      • Irrigation

    • Amérique latine Perspectives (en milliards USD, 2018-2030)

    • Tuyaux en fonte ductile en Amérique latine par technologie

      • DN 80-300

      • DN 350-600

      • DN 700-1000

      • DN 1 200-2 000

      • DN2000 et amp; ci-dessus

    • Application de tuyaux en fonte ductile en Amérique latine

      • Eau et amp; Eaux usées

      • Irrigation


Compare Licence

×
Features License Type
Single User Multiuser License Enterprise User
Price $4,950 $5,950 $7,250
Maximum User Access Limit 1 User Upto 10 Users Unrestricted Access Throughout the Organization
Free Customization
Direct Access to Analyst
Deliverable Format
Platform Access
Discount on Next Purchase 10% 15% 15%
Printable Versions