Request Free Sample ×

Kindly complete the form below to receive a free sample of this Report

* Please use a valid business email

Leading companies partner with us for data-driven Insights

clients tt-cursor
Hero Background

Compounding Chemotherapy Market

ID: MRFR/Pharma/8901-CR
193 Pages
Rahul Gotadki
Last Updated: May 11, 2026

Informations sur le rapport d'étude de marché sur la chimiothérapie composée par dose (chimiothérapeutique et non chimiothérapeutique), par méthode d'administration (dispositif de préparation automatisé gravimétrique et dispositif de préparation volumétrique automatisé), par stérilité (stérile et non stérile), par technologie (avec bras robotiques et sans bras robotiques) et par région (Amérique du Nord, Europe, Asie-Pacifique et reste du monde) – Prévisions de croissance et d'industrie 2025 2035

Partager
Download PDF ×

We do not share your information with anyone. However, we may send you emails based on your report interest from time to time. You may contact us at any time to opt-out.

Compounding Chemotherapy Market Infographic
Purchase Options
  1. 1 SECTION I: RÉSUMÉ ET PRINCIPAUX FAITS SAILLANTS
  2.   1.1 RÉSUMÉ EXÉCUTIF
  3.     Aperçu du marché 1.1.1
  4.     1.1.2 Principales conclusions
  5.     Segmentation du marché 1.1.3
  6.     1.1.4 Paysage concurrentiel
  7.     1.1.5 Défis et opportunités
  8.     1.1.6 Perspectives futures
  9. 2 SECTION II: CADRE, MÉTHODOLOGIE ET STRUCTURE DU MARCHÉ
  10.   2.1 INTRODUCTION AU MARCHÉ
  11.     Définition 2.1.1
  12.     2.1.2 Portée de l'étude
  13.       Objectif de recherche 2.1.2.1
  14.       Hypothèse 2.1.2.2
  15.       Limites de 2.1.2.3
  16.   2.2 MÉTHODOLOGIE DE RECHERCHE
  17.     2.2.1 Aperçu
  18.     2.2.2 Exploration de données
  19.     2.2.3 Recherche secondaire
  20.     2.2.4 Recherche primaire
  21.       2.2.4.1 Entretiens primaires et processus de collecte d'informations
  22.       2.2.4.2 Répartition des répondants principaux
  23.     Modèle de prévision 2.2.5
  24.     2.2.6 Estimation de la taille du marché
  25.       2.2.6.1 Approche ascendante
  26.       2.2.6.2 Approche descendante
  27.     2.2.7 Triangulation des données
  28.     Validation 2.2.8
  29. 3 SECTION III: ANALYSE QUALITATIVE
  30.   3.1 DYNAMIQUE DU MARCHÉ
  31.     3.1.1 Aperçu
  32.     Pilotes 3.1.2
  33.     3.1.3 Contraintes
  34.     3.1.4 Opportunités
  35.   3.2 ANALYSE DES FACTEURS DE MARCHÉ
  36.     3.2.1 Analyse de la chaîne de valeur
  37.     3.2.2 Analyse des cinq forces de Porter
  38.       3.2.2.1 Pouvoir de négociation des fournisseurs
  39.       3.2.2.2 Pouvoir de négociation des acheteurs
  40.       3.2.2.3 Menace des nouveaux entrants
  41.       3.2.2.4 Menace de remplacement
  42.       3.2.2.5 Intensité de la rivalité
  43.     3.2.3 COVID-19 Analyse d'impact
  44.       3.2.3.1 Analyse d’impact sur le marché
  45.       3.2.3.2 Impact régional
  46.       3.2.3.3 Analyse des opportunités et des menaces
  47. 4 SECTION IV: ANALYSE QUANTITATIVE
  48.   4.1 Soins de santé, par dose (USD milliards)
  49.     4.1.1 Chimiothérapeutique
  50.     4.1.2 Produits non chimiothérapeutiques
  51.   4.2 Soins de santé, par méthode de prestation (USD milliards)
  52.     4.2.1 Dispositif de préparation gravimétrique automatisé
  53.     4.2.2 Dispositif de préparation volumétrique automatisé
  54.   4.3 Soins de santé, PAR stérilité (USD milliards)
  55.     4.3.1 Stérile
  56.     4.3.2 Non stérile
  57.   4.4 Soins de santé, BY Technology (USD milliards)
  58.     4.4.1 avec bras robotisés
  59.     4.4.2 sans bras robotiques
  60.   4.5 Soins de santé, PAR région (USD milliards)
  61.     4.5.1 Amérique du Nord
  62.       4.5.1.1 US
  63.       4.5.1.2 Canada
  64.     4.5.2 Europe
  65.       4.5.2.1 Allemagne
  66.       4.5.2.2 UK
  67.       4.5.2.3 France
  68.       4.5.2.4 Russie
  69.       4.5.2.5 Italie
  70.       4.5.2.6 Espagne
  71.       4.5.2.7 Reste de l'Europe
  72.     4.5.3 APAC
  73.       4.5.3.1 Chine
  74.       4.5.3.2 Inde
  75.       4.5.3.3 Japon
  76.       4.5.3.4 Corée du Sud
  77.       4.5.3.5 Malaisie
  78.       4.5.3.6 Thaïlande
  79.       4.5.3.7 Indonésie
  80.       4.5.3.8 Reste de APAC
  81.     4.5.4 Amérique du Sud
  82.       4.5.4.1 Brésil
  83.       4.5.4.2 Mexique
  84.       4.5.4.3 Argentine
  85.       4.5.4.4 Reste de l'Amérique du Sud
  86.     4.5.5 MEA
  87.       4.5.5.1 Pays du CCG
  88.       4.5.5.2 Afrique du Sud
  89.       4.5.5.3 Reste de MEA
  90. 5 SECTION V: ANALYSE CONCURRENTIELLE
  91.   5.1 Paysage concurrentiel
  92.     5.1.1 Aperçu
  93.     Analyse concurrentielle 5.1.2
  94.     Analyse de la part de marché de 5.1.3
  95.     5.1.4 Stratégie de croissance majeure sur le secteur de la santé
  96.     5.1.5 Analyse comparative concurrentielle
  97.     5.1.6 Acteurs de premier plan in Conditions de nombre de développements sur le secteur de la santé
  98.     5.1.7 Développements clés et stratégies de croissance
  99.       5.1.7.1 Lancement d'un nouveau produit/déploiement de services
  100.       5.1.7.2 Fusion et Acquisitions
  101.       Coentreprises 5.1.7.3
  102.     5.1.8 Matrice financière des principaux acteurs
  103.       5.1.8.1 Ventes et résultat opérationnel
  104.       5.1.8.2 Dépenses de R&D des principaux acteurs. 2023
  105.   5.2 Profils d'entreprise
  106.     5.2.1 Fresenius Kabi (DE)
  107.       5.2.1.1 Aperçu financier
  108.       5.2.1.2 Produits proposés
  109.       5.2.1.3 Développements clés
  110.       Analyse SWOT 5.2.1.4
  111.       5.2.1.5 Stratégies clés
  112.     5.2.2 Baxter International (US)
  113.       5.2.2.1 Aperçu financier
  114.       5.2.2.2 Produits proposés
  115.       5.2.2.3 Développements clés
  116.       Analyse SWOT 5.2.2.4
  117.       5.2.2.5 Stratégies clés
  118.     5.2.3 Civica Rx (US)
  119.       5.2.3.1 Aperçu financier
  120.       5.2.3.2 Produits proposés
  121.       5.2.3.3 Développements clés
  122.       Analyse SWOT 5.2.3.4
  123.       5.2.3.5 Stratégies clés
  124.     5.2.4 Services PharMEdium (US)
  125.       5.2.4.1 Aperçu financier
  126.       5.2.4.2 Produits proposés
  127.       5.2.4.3 Développements clés
  128.       5.2.4.4 SWOT Analyse
  129.       5.2.4.5 Stratégies clés
  130.     5.2.5 B. Braun Melsungen AG (DE)
  131.       5.2.5.1 Aperçu financier
  132.       5.2.5.2 Produits proposés
  133.       5.2.5.3 Développements clés
  134.       Analyse SWOT 5.2.5.4
  135.       5.2.5.5 Stratégies clés
  136.     5.2.6 Groupe de santé Accredo (US)
  137.       5.2.6.1 Aperçu financier
  138.       5.2.6.2 Produits proposés
  139.       5.2.6.3 Développements clés
  140.       Analyse SWOT 5.2.6.4
  141.       5.2.6.5 Stratégies clés
  142.     5.2.7 Scripps Santé (US)
  143.       5.2.7.1 Aperçu financier
  144.       5.2.7.2 Produits proposés
  145.       5.2.7.3 Développements clés
  146.       Analyse SWOT 5.2.7.4
  147.       5.2.7.5 Stratégies clés
  148.     5.2.8 Medisca (US)
  149.       5.2.8.1 Aperçu financier
  150.       5.2.8.2 Produits proposés
  151.       5.2.8.3 Développements clés
  152.       Analyse SWOT 5.2.8.4
  153.       5.2.8.5 Stratégies clés
  154.   5.3 Annexe
  155.     5.3.1 Références
  156.     5.3.2 Rapports associés
  157. 6 LISTE DES FIGURES
  158.   6.1 SYNOPSIS DU MARCHÉ
  159.   6.2 ANALYSE DU MARCHÉ EN AMÉRIQUE DU NORD
  160.   6.3 US ANALYSE DU MARCHÉ PAR DOSE
  161.   6.4 US ANALYSE DU MARCHÉ PAR MÉTHODE DE LIVRAISON
  162.   6.5 US ANALYSE DU MARCHÉ PAR STÉRILITÉ
  163.   6.6 US ANALYSE DU MARCHÉ PAR TECHNOLOGIE
  164.   6.7 ANALYSE DU MARCHÉ CANADIEN PAR DOSE
  165.   6.8 ANALYSE DU MARCHÉ CANADA PAR MÉTHODE DE LIVRAISON
  166.   6.9 ANALYSE DU MARCHÉ CANADA PAR STÉRILITÉ
  167.   6.10 ANALYSE DU MARCHÉ CANADIEN PAR TECHNOLOGIE
  168.   6.11 ANALYSE DU MARCHÉ EUROPE
  169.   6.12 ANALYSE DU MARCHÉ ALLEMAGNE PAR DOSE
  170.   6.13 ANALYSE DU MARCHÉ ALLEMAGNE PAR MÉTHODE DE LIVRAISON
  171.   6.14 ANALYSE DU MARCHÉ ALLEMAGNE PAR STÉRILITÉ
  172.   6.15 ANALYSE DU MARCHÉ ALLEMAGNE PAR TECHNOLOGIE
  173.   6.16 UK ANALYSE DU MARCHÉ PAR DOSE
  174.   6.17 UK ANALYSE DU MARCHÉ PAR MÉTHODE DE LIVRAISON
  175.   6.18 UK ANALYSE DU MARCHÉ PAR STÉRILITÉ
  176.   6.19 UK ANALYSE DU MARCHÉ PAR TECHNOLOGIE
  177.   6.20 ANALYSE DU MARCHÉ FRANCE PAR DOSE
  178.   6.21 ANALYSE DU MARCHÉ FRANCE PAR MODE DE LIVRAISON
  179.   6.22 ANALYSE DU MARCHÉ FRANCE PAR STÉRILITÉ
  180.   6.23 ANALYSE DU MARCHÉ FRANCE PAR TECHNOLOGIE
  181.   6.24 ANALYSE DU MARCHÉ RUSSE PAR DOSE
  182.   6.25 ANALYSE DU MARCHÉ RUSSE PAR MODE DE LIVRAISON
  183.   6.26 ANALYSE DU MARCHÉ RUSSE PAR STÉRILITÉ
  184.   6.27 ANALYSE DU MARCHÉ RUSSE PAR TECHNOLOGIE
  185.   6.28 ANALYSE DU MARCHÉ ITALIE PAR DOSE
  186.   6.29 ANALYSE DU MARCHÉ ITALIE PAR MÉTHODE DE LIVRAISON
  187.   6.30 ANALYSE DU MARCHÉ ITALIE PAR STÉRILITÉ
  188.   6.31 ANALYSE DU MARCHÉ ITALIE PAR TECHNOLOGIE
  189.   6.32 ANALYSE DU MARCHÉ ESPAGNOL PAR DOSE
  190.   6.33 ANALYSE DU MARCHÉ ESPAGNOL PAR MÉTHODE DE LIVRAISON
  191.   6.34 ANALYSE DU MARCHÉ ESPAGNOL PAR STÉRILITÉ
  192.   6.35 ANALYSE DU MARCHÉ ESPAGNOL PAR TECHNOLOGIE
  193.   6.36 ANALYSE DU MARCHÉ RESTE DE L’EUROPE PAR DOSE
  194.   6.37 ANALYSE DU MARCHÉ RESTE DE L'EUROPE PAR MODE DE LIVRAISON
  195.   6.38 ANALYSE DU MARCHÉ RESTE DE L'EUROPE PAR STÉRILITÉ
  196.   6.39 ANALYSE DU MARCHÉ RESTE DE L'EUROPE PAR TECHNOLOGIE
  197.   6.40 APAC ANALYSE DE MARCHÉ
  198.   6.41 ANALYSE DU MARCHÉ CHINOISE PAR DOSE
  199.   6.42 ANALYSE DU MARCHÉ CHINOISE PAR MÉTHODE DE LIVRAISON
  200.   6.43 ANALYSE DU MARCHÉ CHINOISE PAR STÉRILITÉ
  201.   6.44 ANALYSE DU MARCHÉ CHINOISE PAR TECHNOLOGIE
  202.   6.45 ANALYSE DU MARCHÉ INDE PAR DOSE
  203.   6.46 INDE ANALYSE DE MARCHÉ PAR MODE DE LIVRAISON
  204.   6.47 ANALYSE DU MARCHÉ INDE PAR STÉRILITÉ
  205.   6.48 ANALYSE DU MARCHÉ INDE PAR TECHNOLOGIE
  206.   6.49 ANALYSE DU MARCHÉ JAPON PAR DOSE
  207.   6.50 ANALYSE DU MARCHÉ JAPON PAR MÉTHODE DE LIVRAISON
  208.   6.51 ANALYSE DU MARCHÉ JAPON PAR STÉRILITÉ
  209.   6.52 ANALYSE DU MARCHÉ JAPON PAR TECHNOLOGIE
  210.   6.53 ANALYSE DU MARCHÉ DE LA CORÉE DU SUD PAR DOSE
  211.   6.54 ANALYSE DU MARCHÉ DE LA CORÉE DU SUD PAR MÉTHODE DE LIVRAISON
  212.   6.55 ANALYSE DU MARCHÉ DE LA CORÉE DU SUD PAR STÉRILITÉ
  213.   6.56 ANALYSE DU MARCHÉ DE LA CORÉE DU SUD PAR TECHNOLOGIE
  214.   6.57 ANALYSE DU MARCHÉ EN MALAISIE PAR DOSE
  215.   6.58 ANALYSE DU MARCHÉ EN MALAISIE PAR MÉTHODE DE LIVRAISON
  216.   6.59 ANALYSE DU MARCHÉ EN MALAISIE PAR STÉRILITÉ
  217.   6.60 ANALYSE DU MARCHÉ EN MALAISIE PAR TECHNOLOGIE
  218.   6.61 ANALYSE DU MARCHÉ THAÏLANDAIS PAR DOSE
  219.   6.62 ANALYSE DU MARCHÉ THAÏLANDAIS PAR MÉTHODE DE LIVRAISON
  220.   6.63 ANALYSE DU MARCHÉ THAÏLANDAIS PAR STÉRILITÉ
  221.   6.64 ANALYSE DU MARCHÉ THAÏLANDAIS PAR TECHNOLOGIE
  222.   6.65 ANALYSE DU MARCHÉ INDONÉSIEN PAR DOSE
  223.   6.66 ANALYSE DU MARCHÉ INDONÉSIEN PAR MÉTHODE DE LIVRAISON
  224.   6.67 ANALYSE DU MARCHÉ INDONÉSIEN PAR STÉRILITÉ
  225.   6.68 ANALYSE DU MARCHÉ INDONÉSIEN PAR TECHNOLOGIE
  226.   6.69 RESTE DE APAC ANALYSE DU MARCHÉ PAR DOSE
  227.   6.70 RESTE DE APAC ANALYSE DU MARCHÉ PAR MÉTHODE DE LIVRAISON
  228.   6.71 RESTE DE APAC ANALYSE DU MARCHÉ PAR STÉRILITÉ
  229.   6.72 RESTE DE APAC ANALYSE DU MARCHÉ PAR TECHNOLOGIE
  230.   6.73 ANALYSE DU MARCHÉ EN AMÉRIQUE DU SUD
  231.   6.74 ANALYSE DU MARCHÉ BRÉSIL PAR DOSE
  232.   6.75 ANALYSE DU MARCHÉ BRÉSIL PAR MÉTHODE DE LIVRAISON
  233.   6.76 ANALYSE DU MARCHÉ BRÉSIL PAR STÉRILITÉ
  234.   6.77 ANALYSE DU MARCHÉ BRÉSIL PAR TECHNOLOGIE
  235.   6.78 ANALYSE DU MARCHÉ MEXIQUE PAR DOSE
  236.   6.79 ANALYSE DU MARCHÉ DU MEXIQUE PAR MÉTHODE DE LIVRAISON
  237.   6.80 ANALYSE DU MARCHÉ DU MEXIQUE PAR STÉRILITÉ
  238.   6.81 ANALYSE DU MARCHÉ DU MEXIQUE PAR TECHNOLOGIE
  239.   6.82 ANALYSE DU MARCHÉ ARGENTIN PAR DOSE
  240.   6.83 ANALYSE DU MARCHÉ ARGENTIN PAR MÉTHODE DE LIVRAISON
  241.   6.84 ANALYSE DU MARCHÉ ARGENTIN PAR STÉRILITÉ
  242.   6.85 ANALYSE DU MARCHÉ ARGENTINE PAR TECHNOLOGIE
  243.   6.86 ANALYSE DU MARCHÉ DU RESTE DE L'AMÉRIQUE DU SUD PAR DOSE
  244.   6.87 ANALYSE DU MARCHÉ DU RESTE DE L'AMÉRIQUE DU SUD PAR MÉTHODE DE LIVRAISON
  245.   6.88 ANALYSE DU MARCHÉ DU RESTE DE L'AMÉRIQUE DU SUD PAR STÉRILITÉ
  246.   6.89 ANALYSE DU MARCHÉ DU RESTE DE L'AMÉRIQUE DU SUD PAR TECHNOLOGIE
  247.   6.90 MEA ANALYSE DE MARCHÉ
  248.   6.91 ANALYSE DU MARCHÉ DES PAYS DU CCG PAR DOSE
  249.   6.92 ANALYSE DU MARCHÉ DES PAYS DU CCG PAR MÉTHODE DE LIVRAISON
  250.   6.93 ANALYSE DU MARCHÉ DES PAYS DU CCG PAR STÉRILITÉ
  251.   6.94 ANALYSE DU MARCHÉ DES PAYS DU CCG PAR TECHNOLOGIE
  252.   6.95 ANALYSE DU MARCHÉ SUD-AFRIQUE PAR DOSE
  253.   6.96 ANALYSE DU MARCHÉ SUD-AFRIQUE PAR MÉTHODE DE LIVRAISON
  254.   6.97 ANALYSE DU MARCHÉ SUD-AFRIQUE PAR STÉRILITÉ
  255.   6.98 ANALYSE DU MARCHÉ SUD-AFRIQUE PAR TECHNOLOGIE
  256.   6.99 RESTE DE MEA ANALYSE DU MARCHÉ PAR DOSE
  257.   6.100 RESTE DE MEA ANALYSE DU MARCHÉ PAR MÉTHODE DE LIVRAISON
  258.   6.101 RESTE DE MEA ANALYSE DU MARCHÉ PAR STÉRILITÉ
  259.   6.102 RESTE DE MEA ANALYSE DU MARCHÉ PAR TECHNOLOGIE
  260.   6.103 CRITÈRES D'ACHAT CLÉS DE SOINS DE SANTÉ
  261.   6.104 PROCESSUS DE RECHERCHE DU MRFR
  262.   6.105 ANALYSE DRO DES SOINS DE SANTÉ
  263.   6.106 ANALYSE D’IMPACT DES FACTEURS: SOINS DE SANTÉ
  264.   6.107 ANALYSE D’IMPACT DES RESTRICTIONS: SOINS DE SANTÉ
  265.   6.108 CHAÎNE D'APPROVISIONNEMENT / DE VALEUR: SANTÉ
  266.   6.109 SOINS DE SANTÉ, PAR DOSE, 2024 (% PART)
  267.   6.110 SOINS DE SANTÉ, PAR DOSE, 2024 À 2035 (USD Billion)
  268.   6.111 SOINS DE SANTÉ, PAR MODE DE LIVRAISON, 2024 (% DE PART)
  269.   6.112 SOINS DE SANTÉ, PAR MODE DE LIVRAISON, 2024 À 2035 (USD Billion)
  270.   6.113 SOINS DE SANTÉ, PAR STÉRILITÉ, 2024 (% DE PART)
  271.   SOINS DE SANTÉ 6.114, PAR STÉRILITÉ, 2024 À 2035 (USD Billion)
  272.   6.115 SOINS DE SANTÉ, PAR TECHNOLOGIE, 2024 (% DE PART)
  273.   SOINS DE SANTÉ 6.116, PAR TECHNOLOGIE, 2024 À 2035 (USD Billion)
  274.   6.117 BENCHMARKING DES PRINCIPAUX CONCURRENTS
  275. 7 LISTE DES TABLEAUX
  276.   7.1 LISTE DES HYPOTHÈSES
  277.     7.1.1   7.2 ESTIMATIONS DE LA TAILLE DU MARCHÉ en Amérique du Nord; PRÉVISION
  278.     7.2.1 PAR DOSE, 2025-2035 (USD milliards)
  279.     7.2.2 PAR MODE DE LIVRAISON, 2025-2035 (USD milliards)
  280.     7.2.3 PAR STÉRILITÉ, 2025-2035 (USD milliards)
  281.     7.2.4 PAR TECHNOLOGIE, 2025-2035 (USD milliards)
  282.   7.3 US ESTIMATIONS DE LA TAILLE DU MARCHÉ; PRÉVISION
  283.     7.3.1 PAR DOSE, 2025-2035 (USD milliards)
  284.     7.3.2 PAR MODE DE LIVRAISON, 2025-2035 (USD milliards)
  285.     7.3.3 PAR STÉRILITÉ, 2025-2035 (USD milliards)
  286.     7.3.4 PAR TECHNOLOGIE, 2025-2035 (USD milliards)
  287.   7.4 ESTIMATIONS DE LA TAILLE DU MARCHÉ canadien; PRÉVISION
  288.     7.4.1 PAR DOSE, 2025-2035 (USD milliards)
  289.     7.4.2 PAR MODE DE LIVRAISON, 2025-2035 (USD milliards)
  290.     7.4.3 PAR STÉRILITÉ, 2025-2035 (USD milliards)
  291.     7.4.4 PAR TECHNOLOGIE, 2025-2035 (USD milliards)
  292.   7.5 ESTIMATIONS DE LA TAILLE DU MARCHÉ européen; PRÉVISION
  293.     7.5.1 PAR DOSE, 2025-2035 (USD milliards)
  294.     7.5.2 PAR MODE DE LIVRAISON, 2025-2035 (USD milliards)
  295.     7.5.3 PAR STÉRILITÉ, 2025-2035 (USD milliards)
  296.     7.5.4 PAR TECHNOLOGIE, 2025-2035 (USD milliards)
  297.   7.6 ESTIMATIONS DE LA TAILLE DU MARCHÉ en Allemagne; PRÉVISION
  298.     7.6.1 PAR DOSE, 2025-2035 (USD milliards)
  299.     7.6.2 PAR MODE DE LIVRAISON, 2025-2035 (USD milliards)
  300.     7.6.3 PAR STÉRILITÉ, 2025-2035 (USD milliards)
  301.     7.6.4 PAR TECHNOLOGIE, 2025-2035 (USD milliards)
  302.   7.7 UK ESTIMATIONS DE LA TAILLE DU MARCHÉ; PRÉVISION
  303.     7.7.1 PAR DOSE, 2025-2035 (USD milliards)
  304.     7.7.2 PAR MODE DE LIVRAISON, 2025-2035 (USD milliards)
  305.     7.7.3 PAR STÉRILITÉ, 2025-2035 (USD milliards)
  306.     7.7.4 PAR TECHNOLOGIE, 2025-2035 (USD milliards)
  307.   7.8 ESTIMATIONS DE LA TAILLE DU MARCHÉ en France; PRÉVISION
  308.     7.8.1 PAR DOSE, 2025-2035 (USD milliards)
  309.     7.8.2 PAR MODE DE LIVRAISON, 2025-2035 (USD milliards)
  310.     7.8.3 PAR STÉRILITÉ, 2025-2035 (USD milliards)
  311.     7.8.4 PAR TECHNOLOGIE, 2025-2035 (USD milliards)
  312.   7.9 ESTIMATIONS DE LA TAILLE DU MARCHÉ en Russie; PRÉVISION
  313.     7.9.1 PAR DOSE, 2025-2035 (USD milliards)
  314.     7.9.2 PAR MODE DE LIVRAISON, 2025-2035 (USD milliards)
  315.     7.9.3 PAR STÉRILITÉ, 2025-2035 (USD milliards)
  316.     7.9.4 PAR TECHNOLOGIE, 2025-2035 (USD milliards)
  317.   7.10 ESTIMATIONS DE LA TAILLE DU MARCHÉ italien; PRÉVISION
  318.     7.10.1 PAR DOSE, 2025-2035 (USD milliards)
  319.     7.10.2 PAR MODE DE LIVRAISON, 2025-2035 (USD milliards)
  320.     7.10.3 PAR STÉRILITÉ, 2025-2035 (USD milliards)
  321.     7.10.4 PAR TECHNOLOGIE, 2025-2035 (USD milliards)
  322.   7.11 ESTIMATIONS DE LA TAILLE DU MARCHÉ espagnol; PRÉVISION
  323.     7.11.1 PAR DOSE, 2025-2035 (USD milliards)
  324.     7.11.2 PAR MODE DE LIVRAISON, 2025-2035 (USD milliards)
  325.     7.11.3 PAR STÉRILITÉ, 2025-2035 (USD milliards)
  326.     7.11.4 PAR TECHNOLOGIE, 2025-2035 (USD milliards)
  327.   7.12 ESTIMATIONS DE LA TAILLE DU MARCHÉ pour le reste de l’Europe; PRÉVISION
  328.     7.12.1 PAR DOSE, 2025-2035 (USD milliards)
  329.     7.12.2 PAR MODE DE LIVRAISON, 2025-2035 (USD milliards)
  330.     7.12.3 PAR STÉRILITÉ, 2025-2035 (USD milliards)
  331.     7.12.4 PAR TECHNOLOGIE, 2025-2035 (USD milliards)
  332.   7.13 APAC ESTIMATIONS DE LA TAILLE DU MARCHÉ; PRÉVISION
  333.     7.13.1 PAR DOSE, 2025-2035 (USD milliards)
  334.     7.13.2 PAR MODE DE LIVRAISON, 2025-2035 (USD milliards)
  335.     7.13.3 PAR STÉRILITÉ, 2025-2035 (USD milliards)
  336.     7.13.4 PAR TECHNOLOGIE, 2025-2035 (USD milliards)
  337.   7.14 ESTIMATIONS DE LA TAILLE DU MARCHÉ chinois; PRÉVISION
  338.     7.14.1 PAR DOSE, 2025-2035 (USD milliards)
  339.     7.14.2 PAR MODE DE LIVRAISON, 2025-2035 (USD milliards)
  340.     7.14.3 PAR STÉRILITÉ, 2025-2035 (USD milliards)
  341.     7.14.4 PAR TECHNOLOGIE, 2025-2035 (USD milliards)
  342.   7.15 ESTIMATIONS DE LA TAILLE DU MARCHÉ indien; PRÉVISION
  343.     7.15.1 PAR DOSE, 2025-2035 (USD milliards)
  344.     7.15.2 PAR MODE DE LIVRAISON, 2025-2035 (USD milliards)
  345.     7.15.3 PAR STÉRILITÉ, 2025-2035 (USD milliards)
  346.     7.15.4 PAR TECHNOLOGIE, 2025-2035 (USD milliards)
  347.   7.16 ESTIMATIONS DE LA TAILLE DU MARCHÉ japonais; PRÉVISION
  348.     7.16.1 PAR DOSE, 2025-2035 (USD milliards)
  349.     7.16.2 PAR MODE DE LIVRAISON, 2025-2035 (USD milliards)
  350.     7.16.3 PAR STÉRILITÉ, 2025-2035 (USD milliards)
  351.     7.16.4 PAR TECHNOLOGIE, 2025-2035 (USD milliards)
  352.   7.17 ESTIMATIONS DE LA TAILLE DU MARCHÉ en Corée du Sud; PRÉVISION
  353.     7.17.1 PAR DOSE, 2025-2035 (USD milliards)
  354.     7.17.2 PAR MODE DE LIVRAISON, 2025-2035 (USD milliards)
  355.     7.17.3 PAR STÉRILITÉ, 2025-2035 (USD milliards)
  356.     7.17.4 PAR TECHNOLOGIE, 2025-2035 (USD milliards)
  357.   7.18 ESTIMATIONS DE LA TAILLE DU MARCHÉ en Malaisie; PRÉVISION
  358.     7.18.1 PAR DOSE, 2025-2035 (USD milliards)
  359.     7.18.2 PAR MODE DE LIVRAISON, 2025-2035 (USD milliards)
  360.     7.18.3 PAR STÉRILITÉ, 2025-2035 (USD milliards)
  361.     7.18.4 PAR TECHNOLOGIE, 2025-2035 (USD milliards)
  362.   7.19 ESTIMATIONS DE LA TAILLE DU MARCHÉ thaïlandais; PRÉVISION
  363.     7.19.1 PAR DOSE, 2025-2035 (USD milliards)
  364.     7.19.2 PAR MODE DE LIVRAISON, 2025-2035 (USD milliards)
  365.     7.19.3 PAR STÉRILITÉ, 2025-2035 (USD milliards)
  366.     7.19.4 PAR TECHNOLOGIE, 2025-2035 (USD milliards)
  367.   7.20 ESTIMATIONS DE LA TAILLE DU MARCHÉ indonésien; PRÉVISION
  368.     7.20.1 PAR DOSE, 2025-2035 (USD milliards)
  369.     7.20.2 PAR MODE DE LIVRAISON, 2025-2035 (USD milliards)
  370.     7.20.3 PAR STÉRILITÉ, 2025-2035 (USD milliards)
  371.     7.20.4 PAR TECHNOLOGIE, 2025-2035 (USD milliards)
  372.   7.21 Reste des ESTIMATIONS DE LA TAILLE DU MARCHÉ APAC; PRÉVISION
  373.     7.21.1 PAR DOSE, 2025-2035 (USD milliards)
  374.     7.21.2 PAR MODE DE LIVRAISON, 2025-2035 (USD milliards)
  375.     7.21.3 PAR STÉRILITÉ, 2025-2035 (USD milliards)
  376.     7.21.4 PAR TECHNOLOGIE, 2025-2035 (USD milliards)
  377.   7.22 ESTIMATIONS DE LA TAILLE DU MARCHÉ en Amérique du Sud; PRÉVISION
  378.     7.22.1 PAR DOSE, 2025-2035 (USD milliards)
  379.     7.22.2 PAR MODE DE LIVRAISON, 2025-2035 (USD milliards)
  380.     7.22.3 PAR STÉRILITÉ, 2025-2035 (USD milliards)
  381.     7.22.4 PAR TECHNOLOGIE, 2025-2035 (USD milliards)
  382.   7.23 ESTIMATIONS DE LA TAILLE DU MARCHÉ brésilien; PRÉVISION
  383.     7.23.1 PAR DOSE, 2025-2035 (USD milliards)
  384.     7.23.2 PAR MODE DE LIVRAISON, 2025-2035 (USD milliards)
  385.     7.23.3 PAR STÉRILITÉ, 2025-2035 (USD milliards)
  386.     7.23.4 PAR TECHNOLOGIE, 2025-2035 (USD milliards)
  387.   7.24 ESTIMATIONS DE LA TAILLE DU MARCHÉ DU Mexique; PRÉVISION
  388.     7.24.1 PAR DOSE, 2025-2035 (USD milliards)
  389.     7.24.2 PAR MODE DE LIVRAISON, 2025-2035 (USD milliards)
  390.     7.24.3 PAR STÉRILITÉ, 2025-2035 (USD milliards)
  391.     7.24.4 PAR TECHNOLOGIE, 2025-2035 (USD milliards)
  392.   7.25 ESTIMATIONS DE LA TAILLE DU MARCHÉ Argentine; PRÉVISION
  393.     7.25.1 PAR DOSE, 2025-2035 (USD milliards)
  394.     7.25.2 PAR MODE DE LIVRAISON, 2025-2035 (USD milliards)
  395.     7.25.3 PAR STÉRILITÉ, 2025-2035 (USD milliards)
  396.     7.25.4 PAR TECHNOLOGIE, 2025-2035 (USD milliards)
  397.   7.26 ESTIMATIONS DE LA TAILLE DU MARCHÉ pour le reste de l'Amérique du Sud; PRÉVISION
  398.     7.26.1 PAR DOSE, 2025-2035 (USD milliards)
  399.     7.26.2 PAR MODE DE LIVRAISON, 2025-2035 (USD milliards)
  400.     7.26.3 PAR STÉRILITÉ, 2025-2035 (USD milliards)
  401.     7.26.4 PAR TECHNOLOGIE, 2025-2035 (USD milliards)
  402.   7.27 MEA ESTIMATIONS DE LA TAILLE DU MARCHÉ; PRÉVISION
  403.     7.27.1 PAR DOSE, 2025-2035 (USD milliards)
  404.     7.27.2 PAR MODE DE LIVRAISON, 2025-2035 (USD milliards)
  405.     7.27.3 PAR STÉRILITÉ, 2025-2035 (USD milliards)
  406.     7.27.4 PAR TECHNOLOGIE, 2025-2035 (USD milliards)
  407.   7.28 ESTIMATIONS DE LA TAILLE DU MARCHÉ des pays du CCG; PRÉVISION
  408.     7.28.1 PAR DOSE, 2025-2035 (USD milliards)
  409.     7.28.2 PAR MODE DE LIVRAISON, 2025-2035 (USD milliards)
  410.     7.28.3 PAR STÉRILITÉ, 2025-2035 (USD milliards)
  411.     7.28.4 PAR TECHNOLOGIE, 2025-2035 (USD milliards)
  412.   7.29 ESTIMATIONS DE LA TAILLE DU MARCHÉ en Afrique du Sud; PRÉVISION
  413.     7.29.1 PAR DOSE, 2025-2035 (USD milliards)
  414.     7.29.2 PAR MODE DE LIVRAISON, 2025-2035 (USD milliards)
  415.     7.29.3 PAR STÉRILITÉ, 2025-2035 (USD milliards)
  416.     7.29.4 PAR TECHNOLOGIE, 2025-2035 (USD milliards)
  417.   7.30 Reste des ESTIMATIONS DE LA TAILLE DU MARCHÉ MEA; PRÉVISION
  418.     7.30.1 PAR DOSE, 2025-2035 (USD milliards)
  419.     7.30.2 PAR MODE DE LIVRAISON, 2025-2035 (USD milliards)
  420.     7.30.3 PAR STÉRILITÉ, 2025-2035 (USD milliards)
  421.     7.30.4 PAR TECHNOLOGIE, 2025-2035 (USD milliards)
  422.   7.31 LANCEMENT DE PRODUIT/DÉVELOPPEMENT DE PRODUIT/APPROBATION
  423.     7.31.1   7.32 ACQUISITION/PARTENARIAT
  424.   7.32.1  

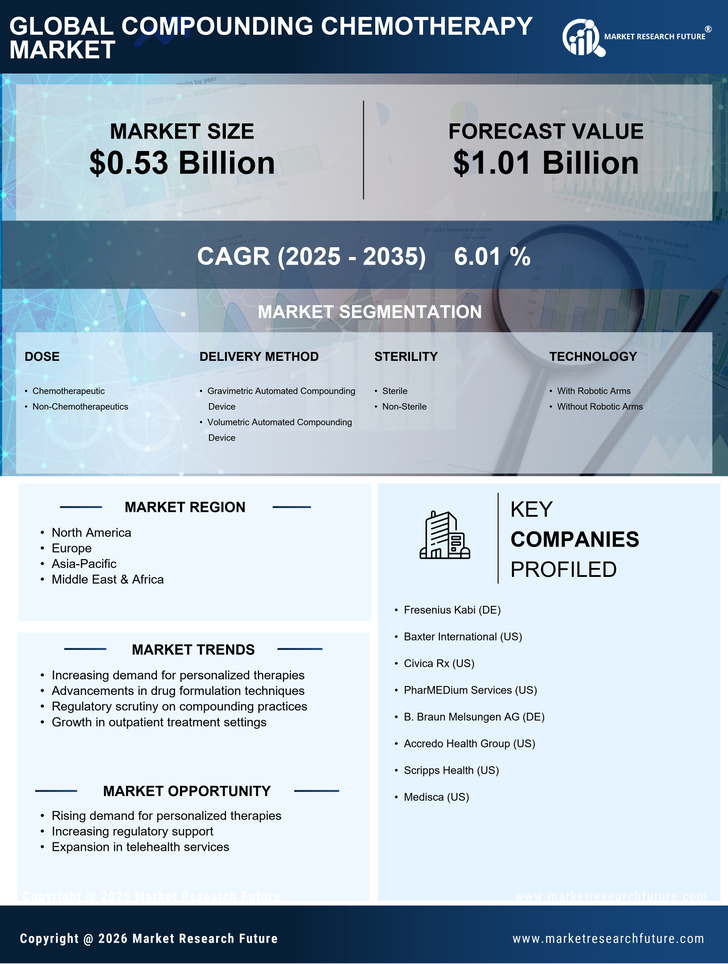
Segmentation du marché des soins de santé

Soins de santé par dose (USD milliards, 2025-2035)

  • Chimiothérapeutique
  • Produits non chimiothérapeutiques

Soins de santé par méthode de prestation (USD milliards, 2025-2035)

  • Dispositif de composition automatisé gravimétrique
  • Dispositif de composition automatisé volumétrique

Soins de santé par stérilité (Milliard USD, 2025-2035)

  • Stérile
  • Non stérile

Soins de santé par technologie (Milliard USD, 2025-2035)

  • Avec des bras robotiques
  • Sans bras robotiques

Compare Licence

×
Features License Type
Single User Multiuser License Enterprise User
Price $4,950 $5,950 $7,250
Maximum User Access Limit 1 User Upto 10 Users Unrestricted Access Throughout the Organization
Free Customization
Direct Access to Analyst
Deliverable Format
Platform Access
Discount on Next Purchase 10% 15% 15%
Printable Versions